Expansion brings about differentiation in volume and price, while institutional finance continues to accelerate its entry.
Written by: Token Terminal
Translated by: Saoirse, Foresight News
Ethereum is the core underlying settlement network for on-chain assets, relying on ETH to pay transaction fees and staking to maintain network security. Traditional finance suffers from slow settlement times, numerous intermediaries, and high counterparty risks, while tokenized assets and stablecoins provide on-chain solutions. From 2025 to 2026, related regulations will gradually mature, and institutional arrangements for on-chain businesses will officially be feasible.
Various stablecoins, tokenized funds, commodities, and on-chain stocks are issued and settled on Ethereum; transactions on layer two networks ultimately return to layer one for final rights confirmation, allowing ETH to continue accumulating value. By market capitalization, Ethereum remains the largest platform for tokenized assets globally, operated jointly by the Ethereum Foundation and developer community, with teams like Etherealize specifically connecting with traditional financial institutions to promote institutional capital entry. In the first quarter of 2026, the Ethereum ecosystem exhibits a polarized trend, with the following details analyzed using complete data from Token Terminal.
The first quarter of 2026 saw a distinct two-sided situation: the scale of on-chain usage reached an all-time high — monthly active users, total transaction volume, and throughput all broke records; however, the asset scale valued in USD and transaction fee metrics simultaneously contracted, fully diluting total market capitalization, total locked assets, transaction volume, and two types of fee data all declined month-on-month. Key events during this quarter deeply shaped this special market condition:
In January, the second round of the Fusaka upgrade cycle saw the Blob parameter fork (BPO#2) implemented, significantly enhancing data storage capacity;
In February, the ERC-8004 standard went live on the mainnet, becoming the universal specification for AI entities' identity and credit rating;
The Ethereum Foundation set three core goals for the 2026 protocol: expansion, optimizing user experience, and strengthening layer one security;
In March, an institutional Ethereum forum was held, significantly increasing participation from traditional financial institutions.
Core indicators for the first quarter of 2026
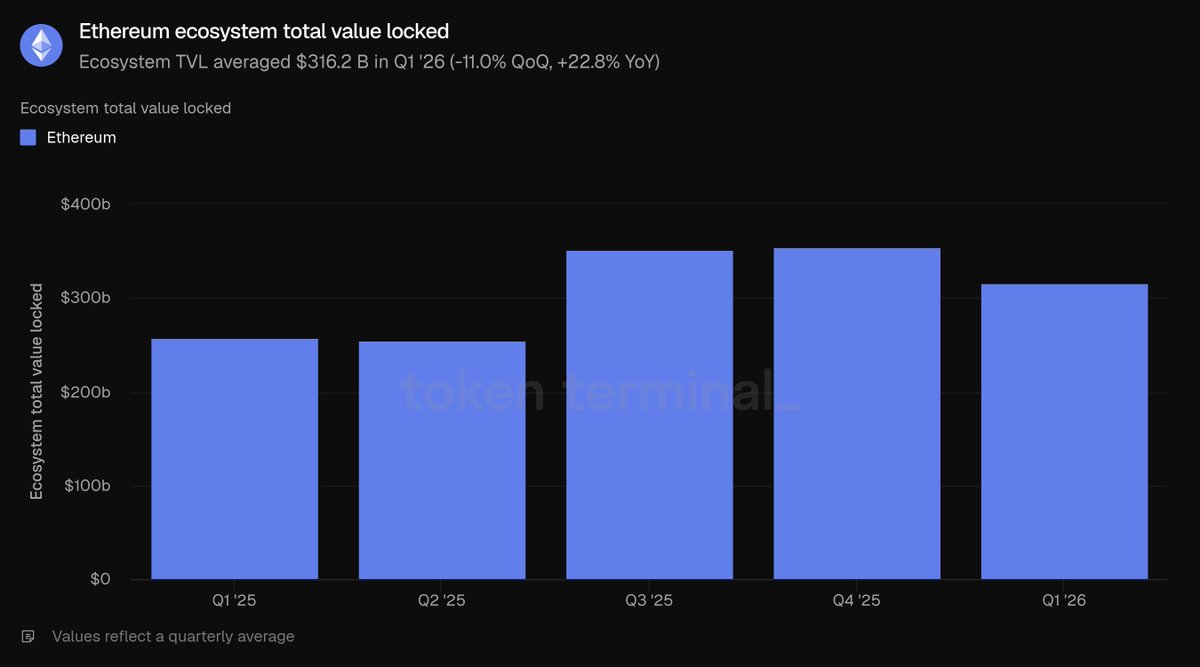
Total locked assets in the ecosystem: $316.2 billion (month-on-month -11.0%, year-on-year +22.8%)
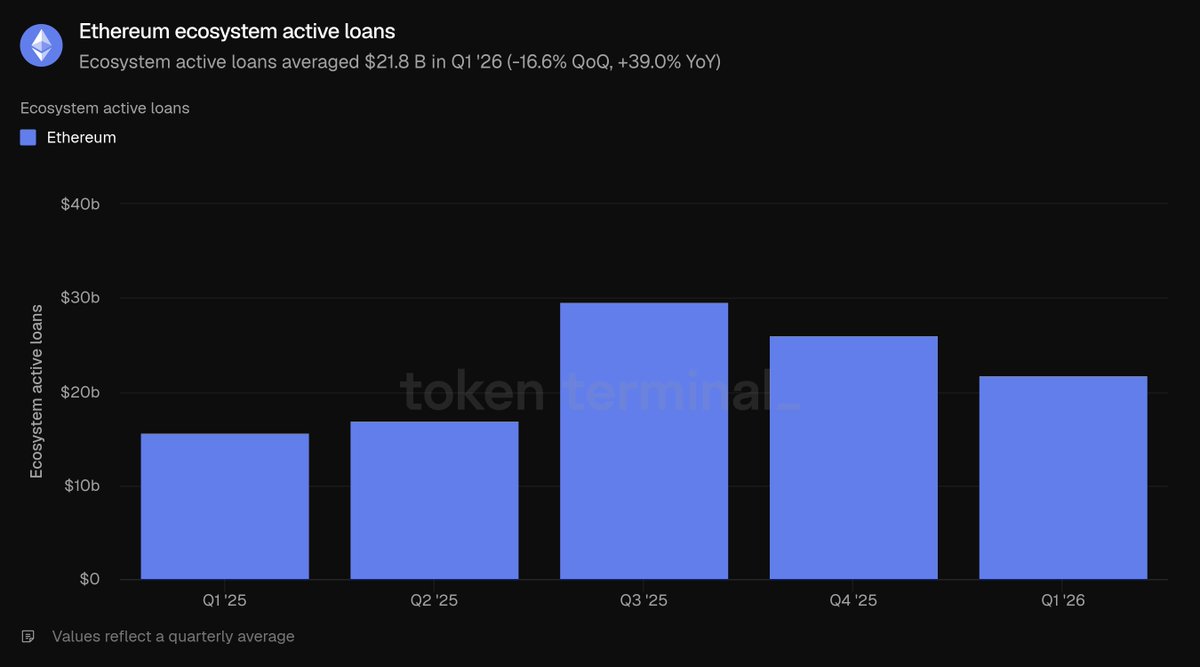
Total active borrowing not cleared in the ecosystem: $21.8 billion (month-on-month -16.6%, year-on-year +39.0%)
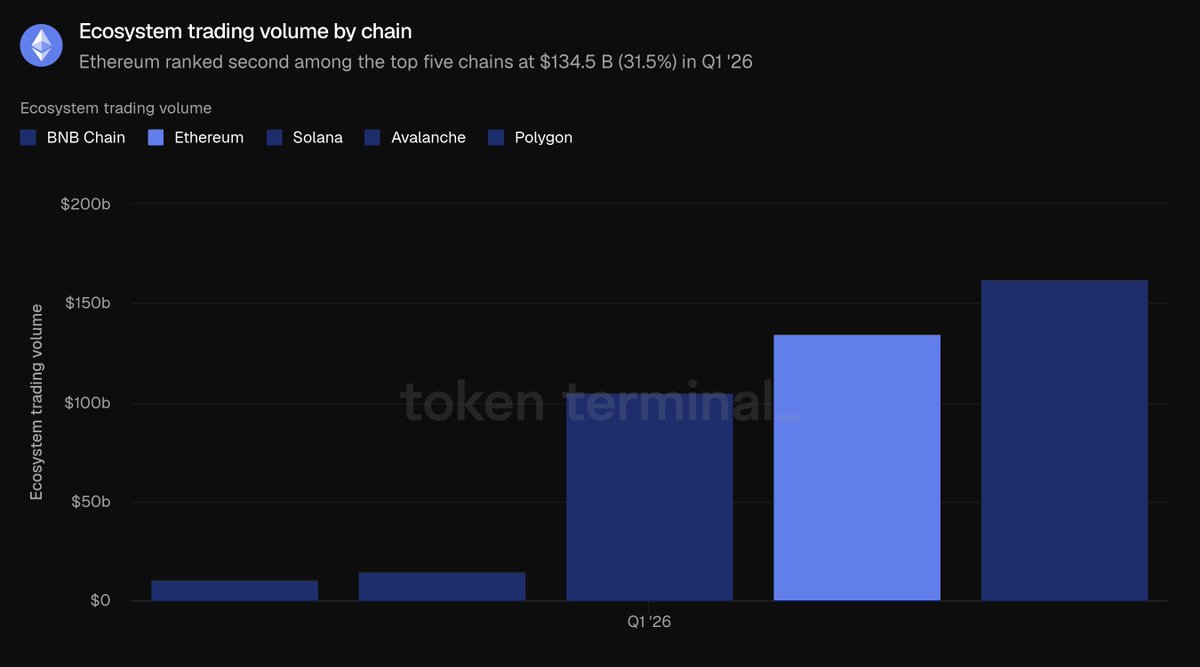
Total trading volume of decentralized exchanges in the ecosystem: $134.5 billion (month-on-month -24.0%, year-on-year -31.2%)
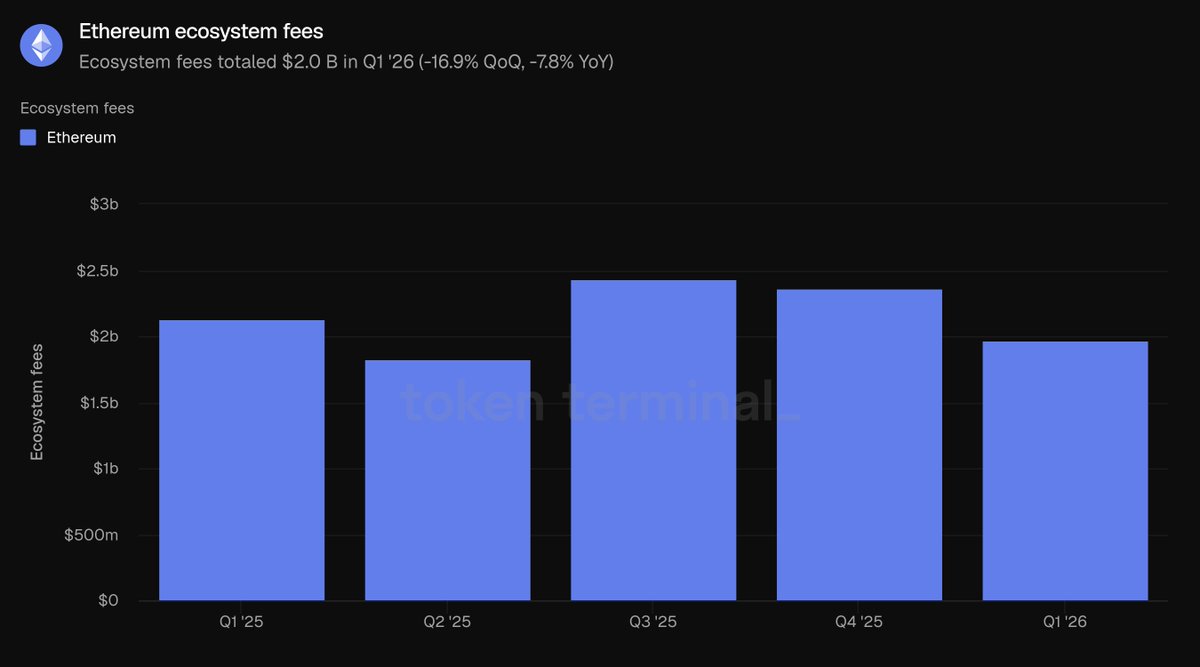
Total income from application fees across the entire ecosystem: $2 billion (month-on-month -16.9%, year-on-year -7.8%)
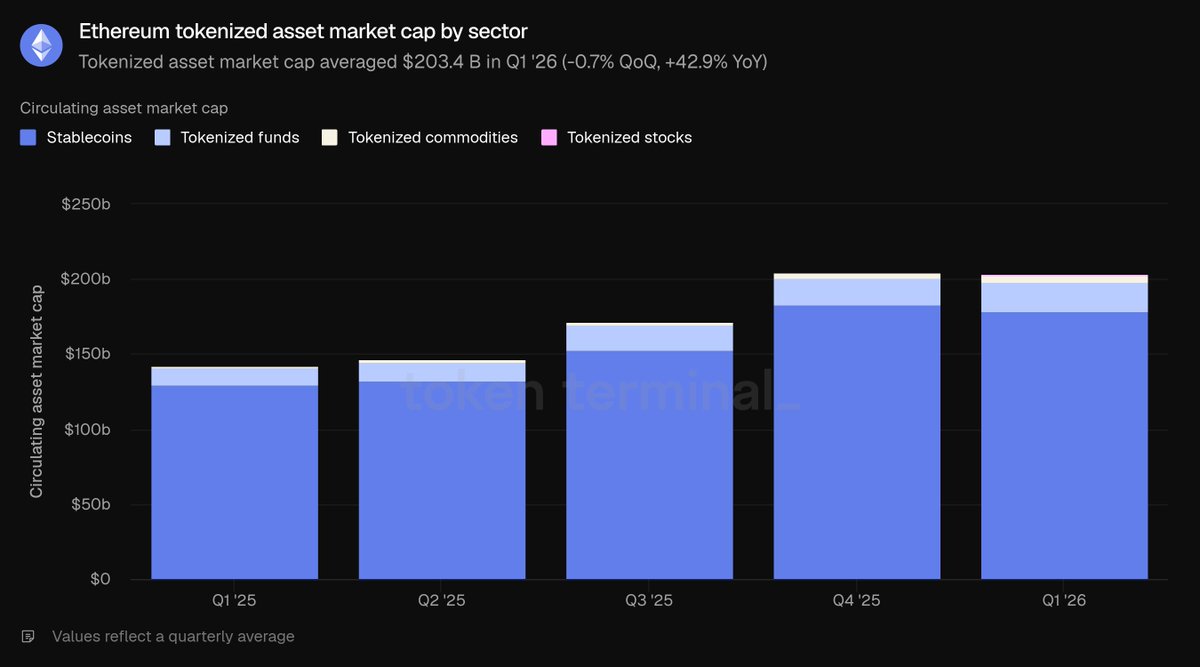
Total market capitalization of on-chain tokenized assets: $203.4 billion (month-on-month -0.7%, year-on-year +42.9%)
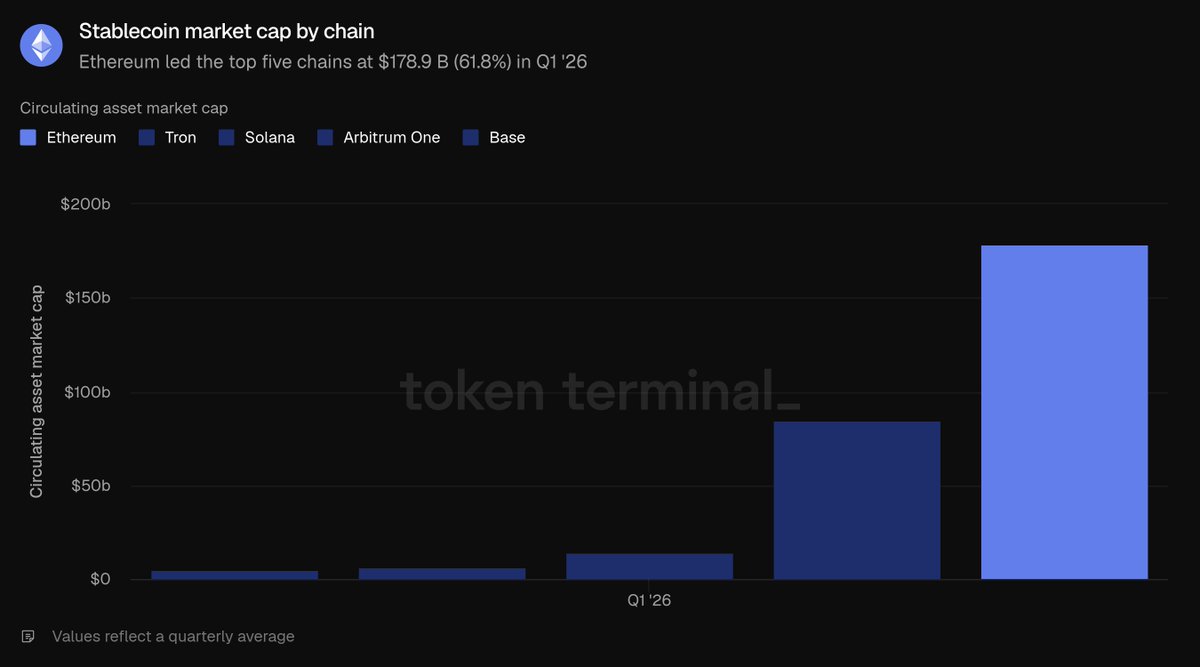
Stablecoins: $178.9 billion (month-on-month -2.3%, year-on-year +37.6%)
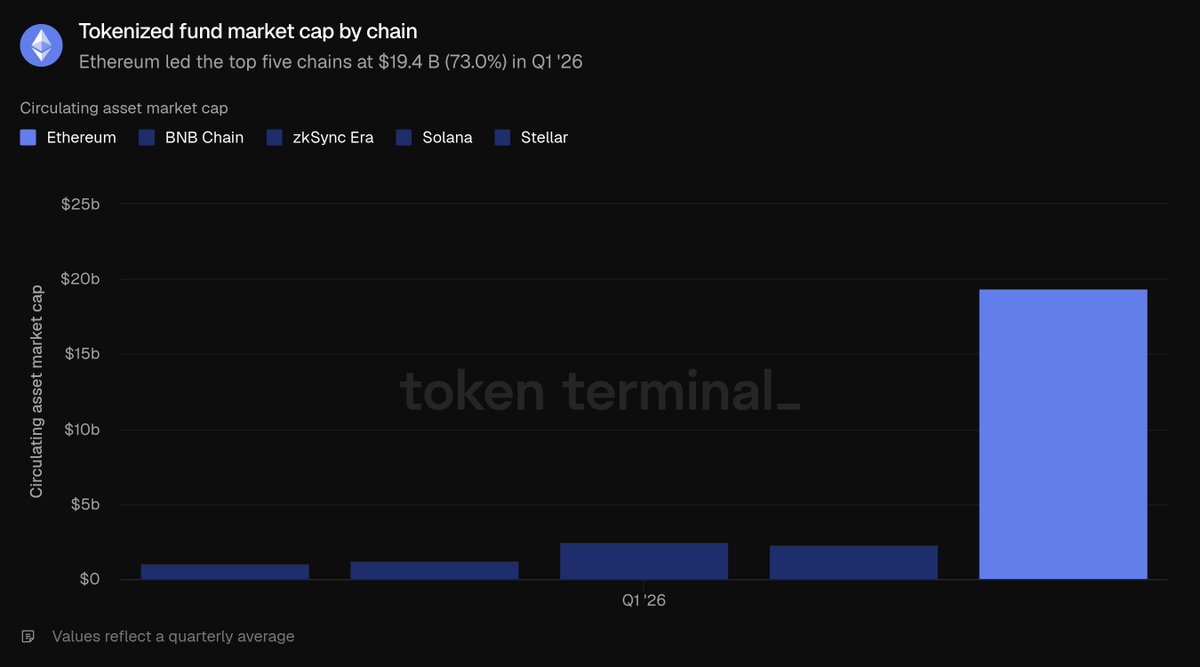
Tokenized funds: $19.4 billion (month-on-month +4.9%, year-on-year +73.1%)
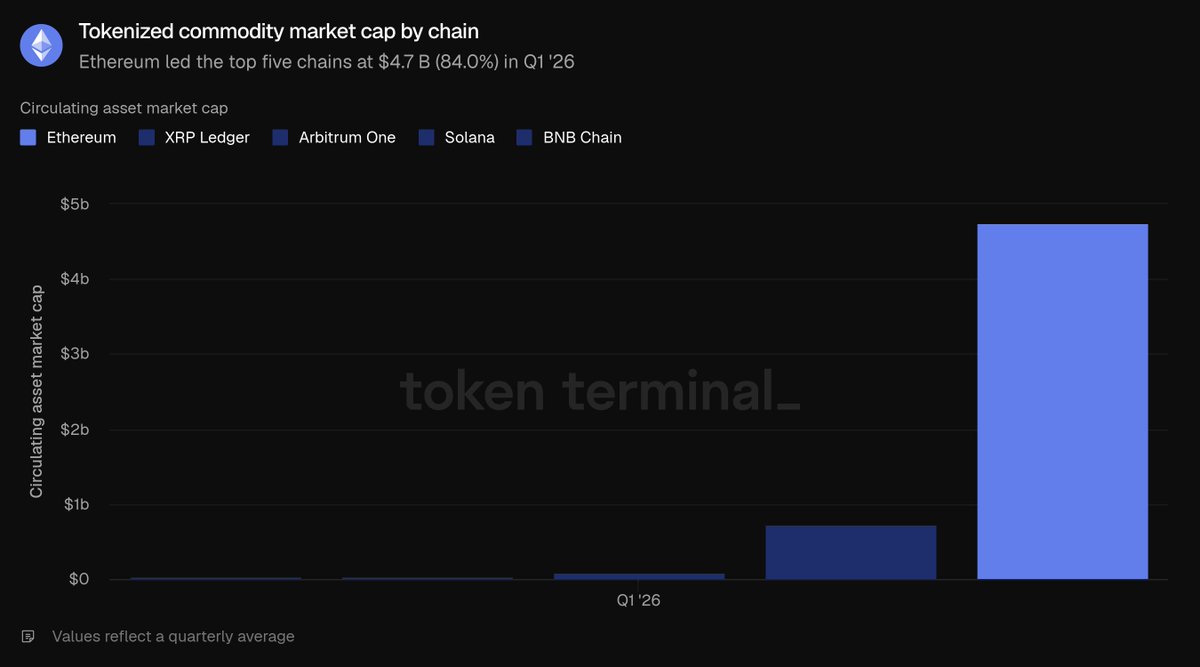
Tokenized commodities: $4.7 billion (month-on-month +60.0%, year-on-year +325.9%)
Tokenized stocks: $365.1 million (month-on-month +16.5%)
Monthly active user addresses: 13.2 million (month-on-month +53.5%, year-on-year +85.9%)
Total transaction count on layer one: 200.4 million (month-on-month +38.0%, year-on-year +81.5%)
Average transactions per second: 25.78 (month-on-month +41.2%, year-on-year +81.7%)
Total revenue from layer one transaction fees: $39.9 million (month-on-month -47.9%, year-on-year -81.9%)
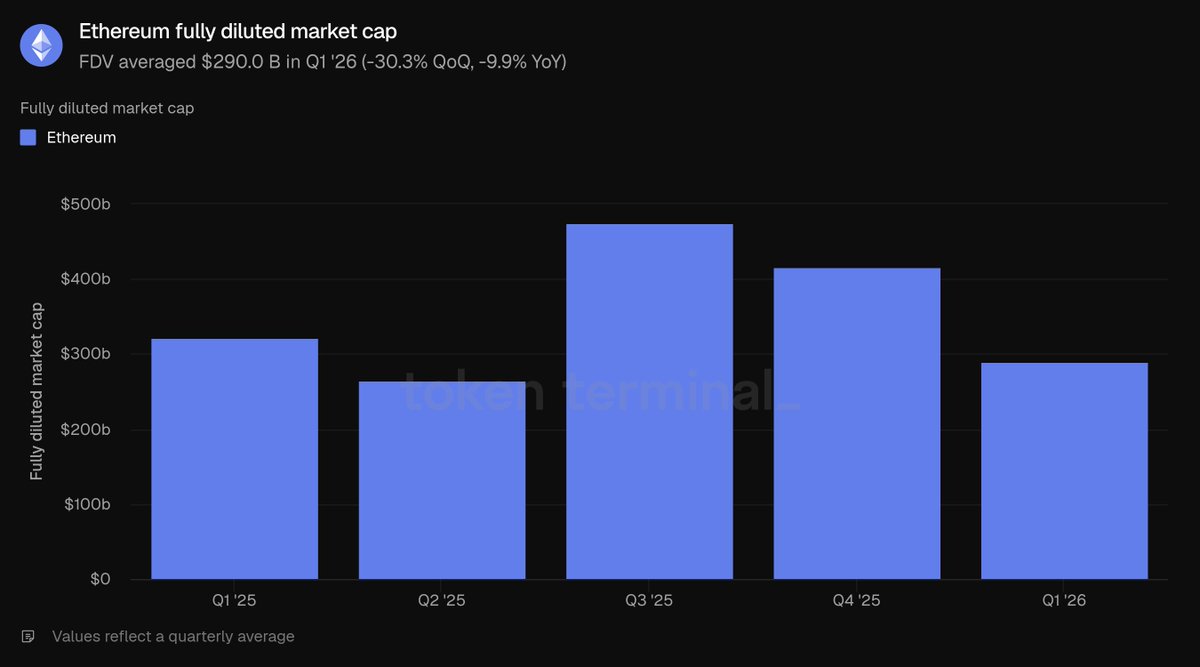
Completely diluted total market capitalization of ETH: $290 billion (month-on-month -30.3%, year-on-year -9.9%)
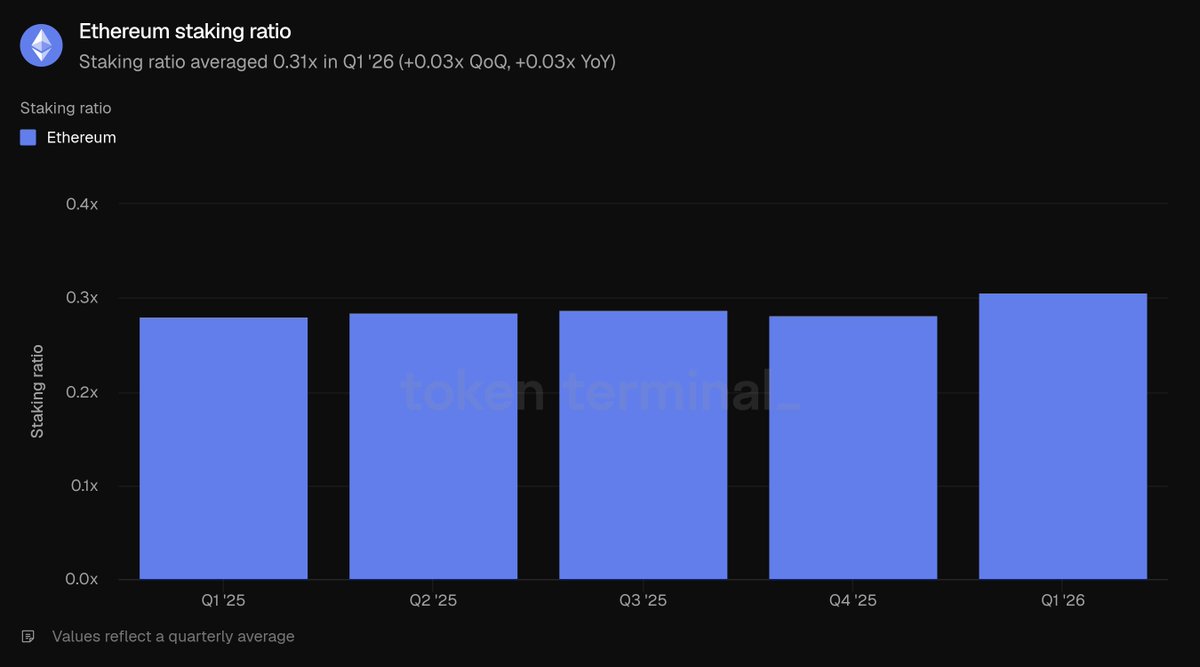
ETH staking ratio: 0.31 (up 0.03 month-on-month and year-on-year)
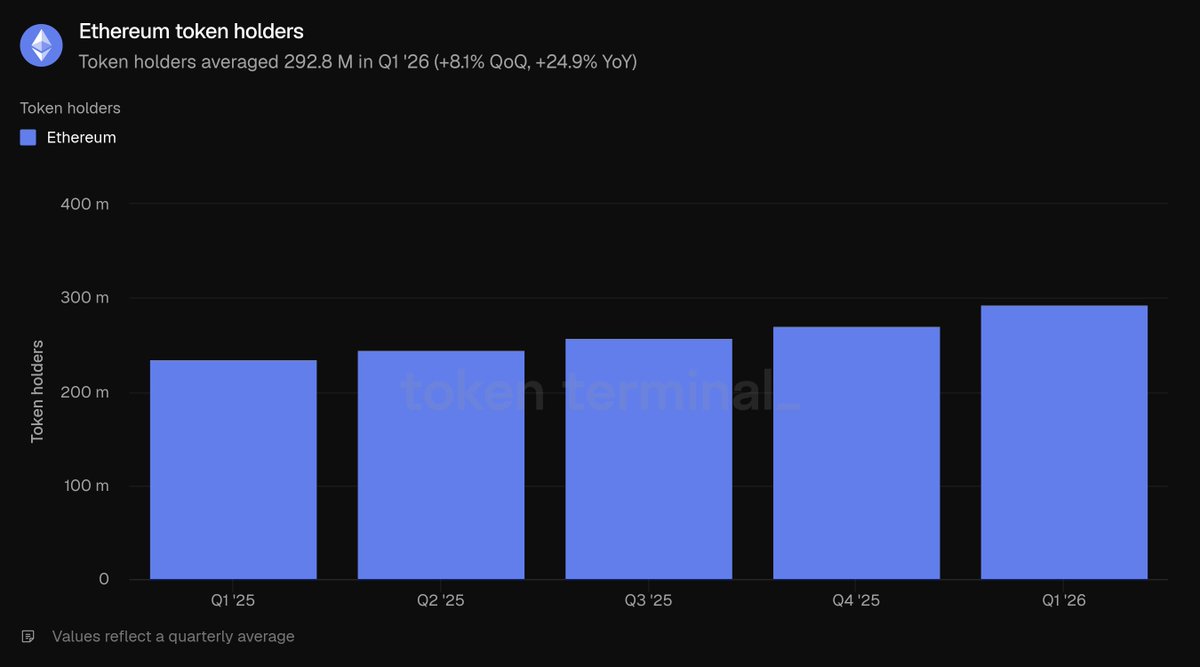
Total number of ETH holding addresses: 292.8 million (month-on-month +8.1%, year-on-year +24.9%)
Note: This report only includes Ethereum layer one mainnet statistics, with layer two networks considered independent blockchains, and related data not included in Ethereum's reporting metrics.
Overall development of the ecosystem
Total locked assets represent the dollar value of assets deposited in various on-chain applications and serve as a leading indicator for revenue-generating activities such as lending, trading, and staking; here we track on-chain funds that Ethereum's entire ecosystem users can withdraw at any time. In the first quarter of 2026, the average total locked assets in the Ethereum ecosystem reached $316.2 billion, down 11.0% month-on-month but up 22.8% year-on-year. The month-on-month shrinkage is due to the overall price adjustment of crypto assets, while the year-on-year significant increase indicates a substantial expansion compared to the same period last year.
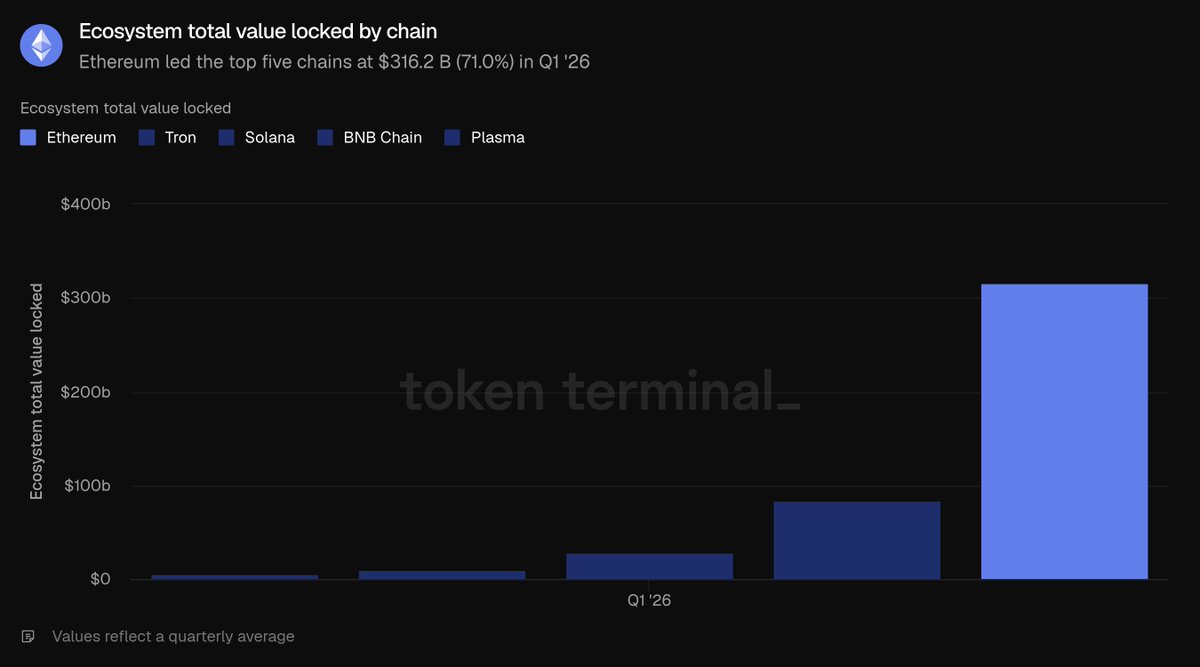
Among the top five public chains, Ethereum’s locked asset scale leads significantly: $316.2 billion far exceeds the combined totals of TRON ($84.5 billion), Solana ($28.8 billion), BNB Chain ($10.3 billion), and Plasma ($5.7 billion), occupying 71% of the total locked assets of the five public chains. Funds are mainly concentrated in two tracks: the liquid staking track led by Lido and the lending track centered around Aave; the EigenLayer and ether.fi restaking protocols, as well as the Ethena and Sky synthetic dollar stablecoin platforms, also command significant capital. The high degree of capital concentration is Ethereum’s most notable structural advantage.
The active lending indicator represents the scale of deposits made by users for lending, generating interest income, and directly reflects the revenue of lending operations; here we gauge the total outstanding loans across all lending applications on Ethereum. The average active lending scale in the ecosystem for the first quarter was $21.8 billion, down 16.6% month-on-month but up 39.0% year-on-year. The shrinkage in lending balances in line with total locked assets indicates a dampening of market overall risk appetite, yet the scale remains significantly higher than the same period last year.
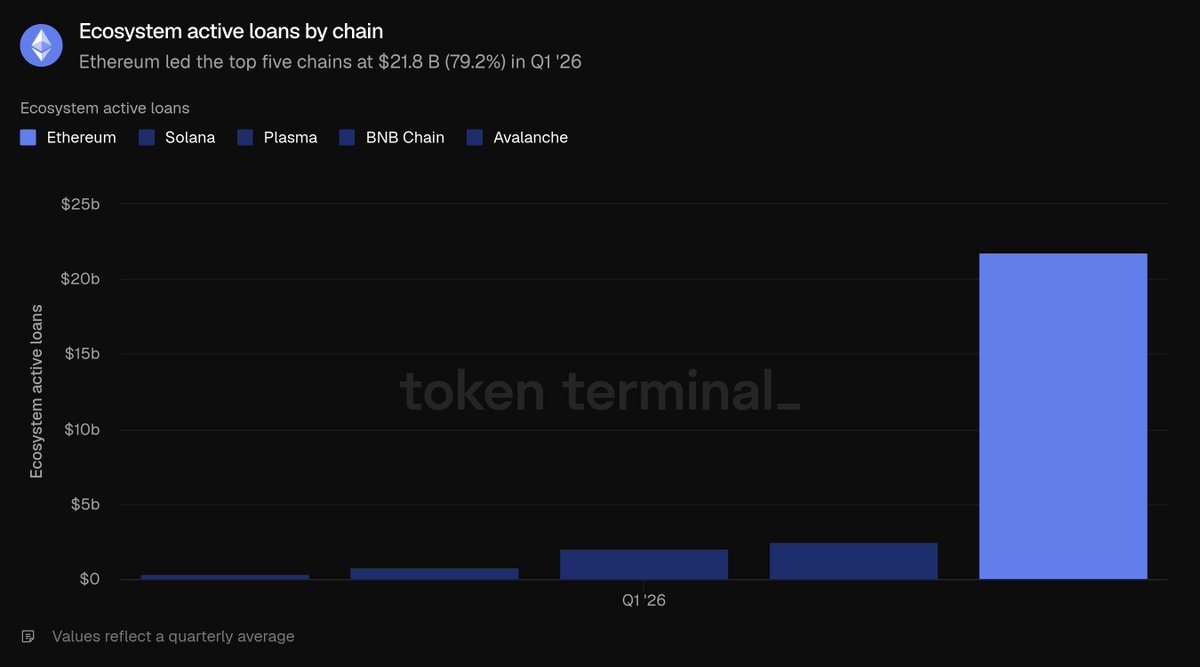
The Ethereum lending market is concentrated in a few liquidity pools, dominated by Aave: the active lending scale at the end of the quarter was approximately $13.5 billion, capturing most of the ecosystem's share; followed by Morpho (around $1.9 billion), Sky's Spark (around $1 billion), and Maple (around $840 million). The contraction in lending scale this quarter was primarily driven by Aave, as declining crypto asset prices led to weakened lending demand, with its total lending volume shrinking about 24%. Compared with the other top public chains, Ethereum’s active lending of $21.8 billion significantly outpaced Solana ($2.5 billion), Plasma ($2.1 billion), BNB Chain ($760.8 million), and Avalanche ($392.4 million), holding 79.2% of the total lending volume across the five public chains, making it the highest proportion of any segment on Ethereum.
Decentralized exchange trading volume refers to the total amount of transactions concluded in on-chain spot exchanges; traders pay fees when executing transactions, thus trading volume is closely related to platform revenues, with this data summarizing Ethereum's entire ecosystem of DEX trading. The total trading volume for the ecosystem in the first quarter was $134.5 billion, down 24% month-on-month and down 31.2% year-on-year. The drop in trading volume exceeded the shrinkage in locked assets, confirming a significant reduction in market risk appetite during this quarter's asset decline cycle.
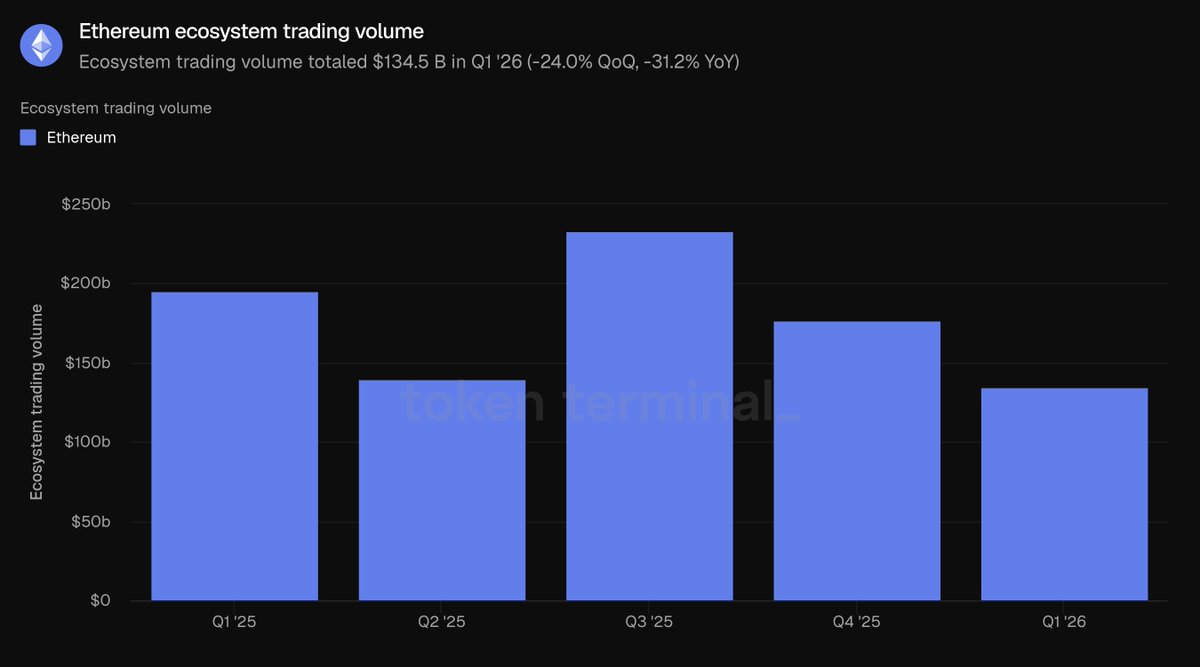
Ethereum DEX trading is highly concentrated among leading platforms: Uniswap's trading volume was around $85.5 billion in the first quarter, accounting for two-thirds of the ecosystem total; followed by Curve (about $22.1 billion) and CoW Swap (about $12.4 billion). Trading volume is the only metric where Ethereum did not top the five public chains: BNB Chain’s total trading volume of $162.5 billion is higher than Ethereum’s $134.5 billion, with Solana closely following ($104.9 billion); Avalanche ($14.5 billion) and Polygon ($10.7 billion) ranked lower. Ethereum's trading volume accounted for 31.5% of the total of the five major chains, ranked second to BNB Chain's 38%.
Ecological fees refer to all expenses incurred by users when utilizing various applications, including borrower interests and trader transaction fees, representing the economic value created by the ecosystem; this statistic aggregates all application fees across Ethereum. Total ecosystem fees in the first quarter amounted to $2 billion, down 16.9% month-on-month and down 7.8% year-on-year, corresponding with decreased trading and lending activity.
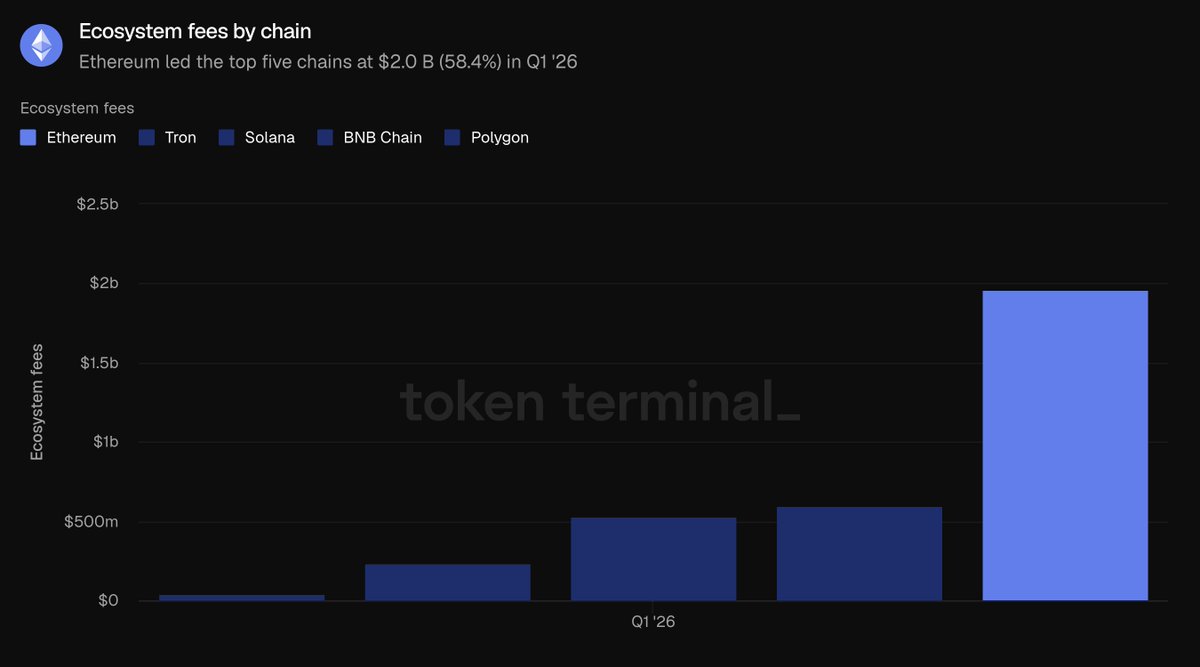
Ethereum's $2 billion ecological fees greatly surpass TRON ($599.3 million), Solana ($532.5 million), BNB Chain ($231.9 million), and Polygon ($38.8 million), capturing 58.4% of the total fees across the five major public chains. Despite data declines this quarter, Ethereum remains the largest source of application fees in the industry. Aggregating all indicators in this segment: Ethereum leads the industry in locked funds, lending scale, and ecosystem fees metrics, with only DEX trading volume not surpassing BNB Chain.
Tokenized asset sector
The total market capitalization of circulating assets refers to the total value of on-chain tokenized assets, calculated as circulating supply multiplied by the day's closing price; stablecoins take their total circulating issuance, tokenized funds take the scale of on-chain managed assets, and tokenized stocks take the total value of shares issued on-chain, with this segment only tracking assets issued on Ethereum.
In the first quarter, Ethereum’s average total market capitalization of tokenized assets was $203.4 billion, approximately stable month-on-month (down just 0.7%) but a substantial year-on-year increase of 42.9%. Stablecoins constitute 87.9% of the overall scale, with the remaining share divided among tokenized funds, commodities, and stocks.
Stablecoins
In the first quarter, Ethereum's average stablecoin scale was $178.9 billion, slightly declining 2.3% month-on-month but rising 37.6% year-on-year, making it the only category in the tokenized segment to see a month-on-month decrease. The market is monopolized by two main issuers: at the end of the quarter, Tether USDT ($94.1 billion) and Circle USDC ($54.5 billion) together account for the vast majority of Ethereum's stablecoin market cap; other leading products include Sky USDS ($12.4 billion), Ethena USDe ($5.9 billion), and PayPal PYUSD ($2.9 billion); Ripple's compliant stablecoin RLUSD ($1.1 billion) and other new compliant varieties have also been launched. Compared to the top five public chains, Ethereum's $178.9 billion stablecoin scale leads TRON ($84.5 billion), Solana ($14.5 billion), Arbitrum One ($6.8 billion), and Base ($4.7 billion), holding 61.8% of the total stablecoins across the five public chains.
Tokenized funds
In the first quarter, Ethereum's average tokenized fund scale was $19.4 billion, rising 4.9% month-on-month and surging 73.1% year-on-year. The sector divides into two main types:
Yield-based on-chain dollar products (largest scale): Sky sUSDS (approximately $6.4 billion), Ethena sUSDe (approximately $3.5 billion);
Compliance funds in traditional finance (core vehicle for institutional narratives): BlackRock BUIDL (issued by Securitize, approximately $1.0 billion), WisdomTree Government Money Fund (approximately $815 million), Superstate USTB (approximately $620 million), with Ondo OUSG (approximately $320 million) following closely. In comparison with the five major public chains, Ethereum's $19.4 billion tokenized fund significantly outpaces ZKsync Era ($2.5 billion), BNB Chain ($2.3 billion), Solana ($1.3 billion), and Stellar ($1.1 billion), accounting for 73% of the total.
Tokenized commodities
In the first quarter, Ethereum's average tokenized commodity scale was $4.7 billion, growing 60% month-on-month and soaring 325.9% year-on-year, marking the fastest-growing tokenized category. This sector is almost entirely composed of on-chain gold: Tether Gold XAUT (about $2.6 billion) and Paxos Gold PAXG (about $2.4 billion) together occupy the full market. Compared to the five related public chains, Ethereum's $4.7 billion scale far exceeds Ripple ($736.6 million), Arbitrum One ($95.9 million), BNB Chain ($38.4 million), and Solana ($29.8 million), accounting for 84% of the total—a segment where Ethereum exhibits the strongest dominance.
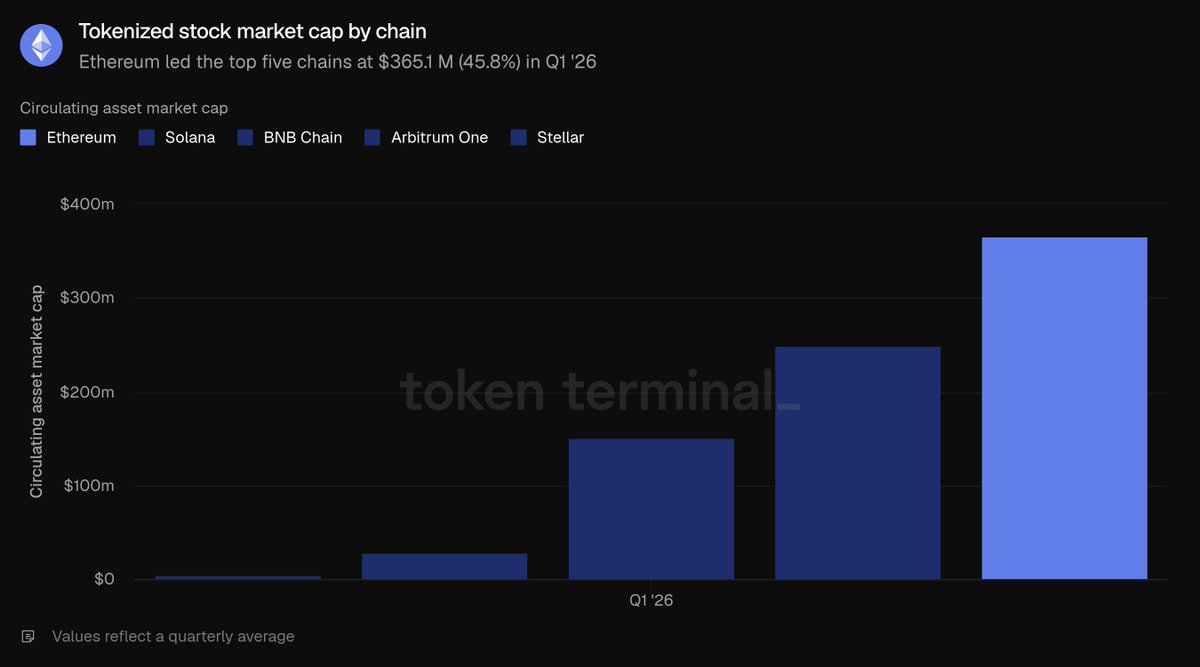
Tokenized stocks
Tokenized stocks are the smallest subcategory, with Ethereum averaging $365.1 million in the first quarter, nearly zero in the same period last year, with a month-on-month increase of 16.5%. This sector is almost entirely monopolized by Ondo Finance, which issues on-chain assets for the S&P 500, NASDAQ 100 broad index, and dozens of individual stocks, comprising most of the Ethereum tokenized stock market cap. In comparison with the five major public chains, Ethereum's $365.1 million slightly leads Solana ($249 million), BNB Chain ($150.5 million), Arbitrum One ($29 million), and Stellar ($4.2 million), accounting for only 45.8% of the total tokenized stocks on the five public chains, marking the only segment where Ethereum does not command an absolute majority share.
Overall tokenized asset segment: In the first quarter, stablecoin inventory slightly receded, but Ethereum’s monopolistic position in token funds and commodity sectors continues to strengthen.
On-chain activity levels
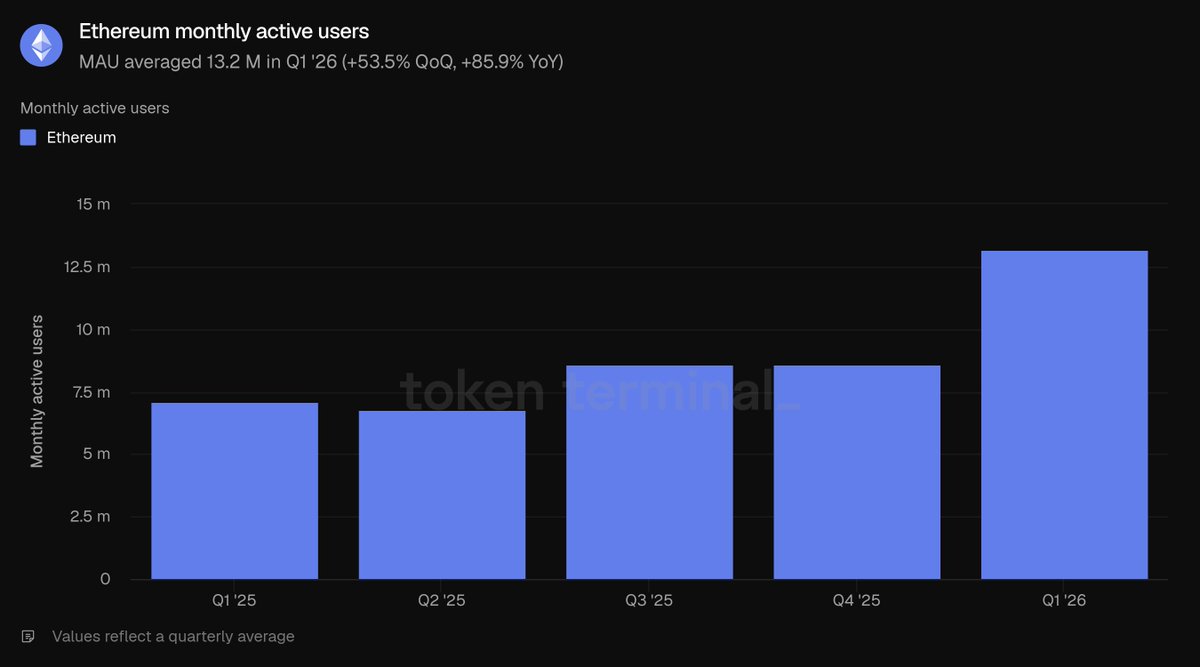
Monthly active users are defined as unique addresses generating revenue-creating on-chain transactions each month; this metric only tracks interaction addresses on Ethereum layer one. The average monthly active users in the first quarter reached 13.2 million, climbing 53.5% month-on-month and 85.9% year-on-year, marking an all-time high, ending the previously slow growth trend over multiple quarters, with a significant acceleration in user growth.
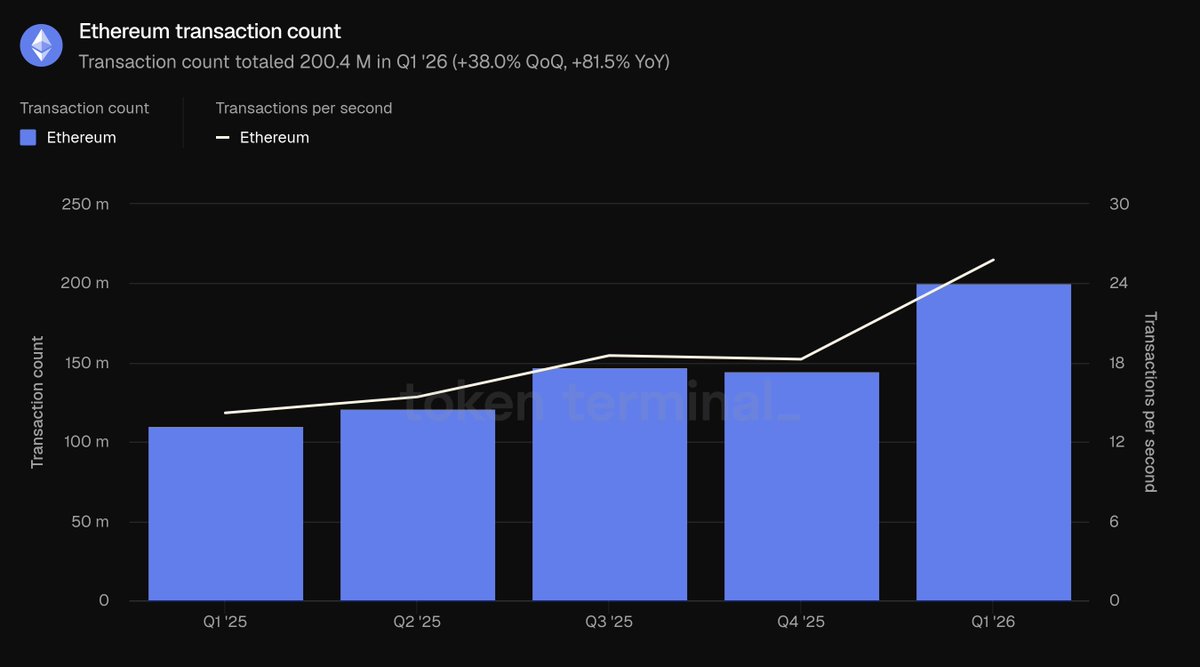
Total transaction volume refers to the number of transactions written to the blockchain and confirmed, reflecting users' on-chain interaction enthusiasm; average transactions per second (TPS) represents the average confirmation rate in the period, measuring the network's real-time carrying capacity; both metrics only account for Ethereum layer one. In the first quarter, total transactions on layer one amounted to 200.4 million, up 38% month-on-month and 81.5% year-on-year; average TPS rose to 25.78, increasing by 41.2%. Both metrics reached new all-time highs, proving that the growth in user scale is effectively translating into real business increments on-chain.
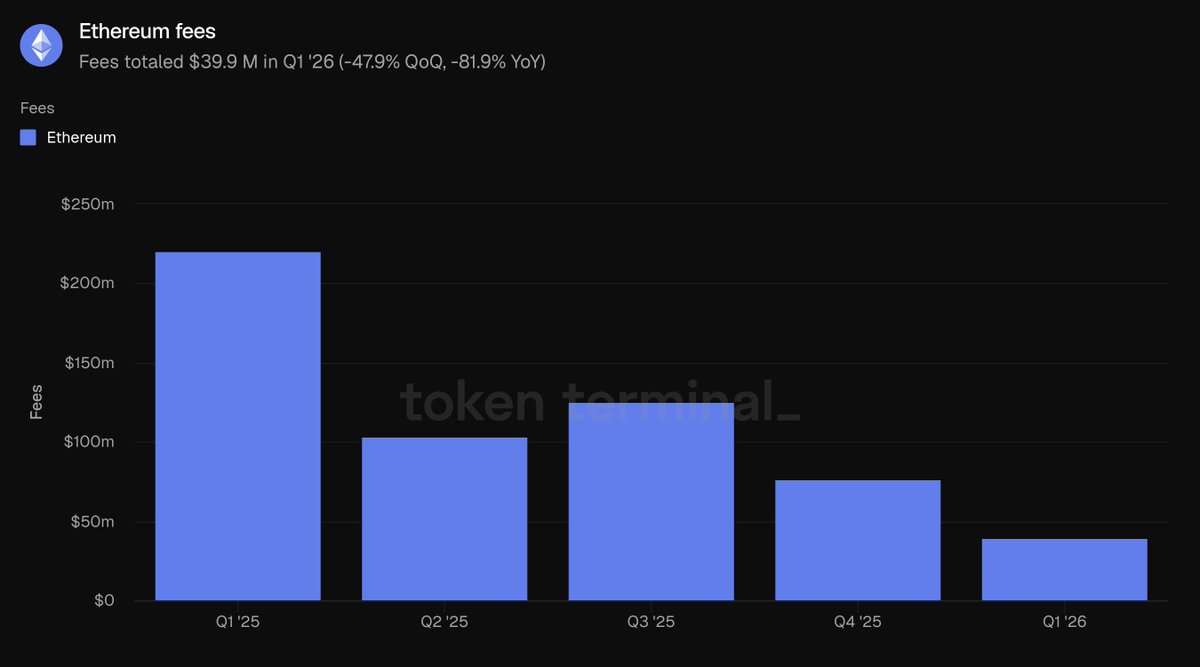
This fee specifically refers to the basic network costs incurred by users when initiating transactions on Ethereum layer one and is distinct from the total ecosystem application fees reported in the second part of the analysis. In the first quarter, total transaction fees on layer one were $39.9 million, plummeting 47.9% month-on-month and falling 81.9% year-on-year. The high activity levels coupled with a drastic drop in fees represent the most critical data contrast of this quarter: total transactions increased by 38% while total fees shrank nearly by half, primarily due to the Blob expansion significantly increasing block storage capacity, providing ample block space, which led to a notable decrease in costs per transaction.
The core conclusion of this section is that the expansion dividend has landed: both users and transaction numbers have reached record highs while the overall network usage cost has declined. When the speed of network throughput expansion outpaces the growth rate of market transaction demand, characteristics of "increased activity and decreased fees" will emerge.
Native token ETH fundamentals
The calculation logic for fully diluted total market capitalization: ETH token price × total supply under the current token economic model (including circulating, locked, unlocked, and pending issuance tokens). In the first quarter, the average fully diluted market capitalization of ETH was $290 billion, falling 30.3% month-on-month and decreasing 9.9% year-on-year, marking the largest month-on-month decline among all valuation metrics reported and the core factor driving the shrinkage in the total dollar-denominated asset scale across the ecosystem.
Staking ratio: the total dollar value of staked ETH securing the proof-of-stake network, relative to ETH's overall market capitalization; 0.31 indicates that approximately 31% of ETH's market cap is staked. The average staking ratio in the first quarter was 0.31, higher than the previous quarter and last year's level of 0.28. Despite the significant overall market cap evaporation of ETH, the proportion of tokens participating in securing network staking still rose, indicating that users' willingness to stake long-term remained stable during the price downturn period.
Token holder indicator: the total number of unique wallet addresses holding ETH. In the first quarter, the average number of ETH holding addresses was 292.8 million, increasing by 8.1% month-on-month and 24.9% year-on-year, marking a steady rise for five consecutive quarters. In the context of a continuing decline in fully diluted market cap, the expansion of holding addresses suggests that the holder demographic for ETH is further diversifying, and the willingness of ordinary users to hold does not decrease with the short-term market cooling.
Etherealize team interpretation and commentary
The most critical contradictory phenomenon of this quarter: while the usage scale of Ethereum layer one mainnet reached a historical high, network transaction fees simultaneously declined. Ethereum is actively promoting network expansion, willingly sacrificing short-term fee revenues; the long-term logic is that cheaper block space will release massive potential market demand, ultimately driving long-term revenue growth across the network.
Data from Token Terminal's "Q1 2026 Ethereum Report" proves that this long-term logic is being realized: the year-on-year growth of monthly active users increased by 85.9%, total transaction volume rose by 81.5%, and network throughput increased by 81.7%. This is a typical manifestation of Jevons Paradox. The team predicts that long-term net increases in overall network transaction demand will fully offset the short-term revenue losses caused by declining per-transaction fees. Drawing an analogy to the semiconductor industry: when Gordon Moore proposed Moore's Law in 1975, the industry's revenue scale was limited, but today it has grown by several orders of magnitude. The expansion dividend has yet to be fully realized: the Q3 Glamsterdam upgrade plan will triple the gas limit; Ethereum's long-term roadmap aims to achieve tens of thousands of TPS by 2029, building a high-speed layer one public chain with second-level transaction finality.
The team agrees with BlackRock CEO Larry Fink's viewpoint from December last year: the current stage of the tokenization industry is equivalent to the internet in 1996 — at that time, Amazon's online book sales amounted to just $16 million. The market widely believed that Amazon was merely surviving on the internet bubble while sustaining losses as an online bookstore; yet Bezos anticipated the internet would completely reshape the retail industry, opting to sacrifice short-term profits to fully build network effects and scale advantages. Ethereum is now making the same trade-off to solidify its position as the underlying settlement layer for global finance.
The development of the internet provides another crucial insight: open, permissionless networks will ultimately surpass closed, proprietary networks. In 1995, Bill Gates predicted in "The Road Ahead" that digital commerce would rely on proprietary private networks, "information highways," rather than the open internet. At the time, Microsoft developed MSN, America Online, CompuServe, and Prodigy as closed, walled gardens housing millions of paid users; the French Minitel terminal system surpassed the global internet in user scale until late 1996. However, all these closed systems ultimately failed. No major legitimate enterprise would wish to build its business on a network controlled by competitors; more critically, no company can permanently keep up with the rate of innovation in a permissionless open ecosystem. History continually reinforces this rule: Linux outpaced proprietary Unix systems, open webpages replaced corporate closed intranets, and Wikipedia supplanted the Encyclopaedia Britannica. In every early phase of upheaval, proprietary products gain the first-mover advantage through more precise functionality, ample marketing, and commercial resources; however, once an open ecosystem accumulates sufficient development tools, developers, and trusted neutrality, the first-mover advantage dissolves rapidly.
This industry rule is now being reenacted in the field of financial infrastructure, with all data in this report substantiating that Ethereum has crossed the ecosystem critical point: dominating absolute market shares in all core sectors. Institutional arrangements for tokenized finance choose Ethereum not out of ideological preference, but because ecological liquidity, composability, and mature institutional case studies are concentrated here. According to the report data: Ethereum accounts for 79.2% of DeFi active lending, 61.8% of stablecoins, 73% of tokenized funds, and 84% of tokenized commodities market share among the top five public chains. Each new type of tokenized asset will further bolster ecological liquidity, continuously attracting more institutional entry; the neutral and unbiased underpinning is the only stable and balanced solution for the industry — major financial institutions will never unite to select competing proprietary chains for asset settlement. Furthermore, institutions are gradually realizing that privacy interactions, entry restrictions, KYC compliance, and asset transfer control can all be achieved on Ethereum's upper layer through a privacy computing environment and permissioned token standards, while fully accessing the entire network's public liquidity; conversely, closed proprietary chains are incapable of tapping into the vast liquidity and diverse applications of the open ecosystem.
After the quarter ended, institutional arrangement speed further accelerated, with several significant implementations emerging just in May: in the asset management sector: BlackRock filed for two new tokenized funds; JPMorgan issued its second Ethereum-based money market fund JLTXX; Fidelity International launched the Moody’s AAA-rated dollar liquidity fund FILQ, launching in ERC-20 token format. In the stablecoin sector: the Japan Blockchain Association's yen stablecoin EJPY is set to deploy on Ethereum; a coalition of 12 major banks in Europe (including BNP Paribas, ING Group,信用银行, and Banco Santander) is preparing a compliant euro stablecoin.
The 1990s internet seemed far away, but by 2005 had become an essential need for society. If Fink's judgment about the current stage of the tokenization industry is accurate, the next few years may represent the most opportunistic phase in Ethereum's development history. The team's earlier report "Efficient Currency" posited a core view: network fees form the intrinsic value bottom line for ETH; the long-term optimistic logic is that with more complete monetary properties, ETH is expected to absorb a cumulative storage value premium exceeding $30 trillion from gold and Bitcoin. Ethereum can establish its industry-leading position without relying on high fees.
免责声明:本文章仅代表作者个人观点,不代表本平台的立场和观点。本文章仅供信息分享,不构成对任何人的任何投资建议。用户与作者之间的任何争议,与本平台无关。如网页中刊载的文章或图片涉及侵权,请提供相关的权利证明和身份证明发送邮件到support@aicoin.com,本平台相关工作人员将会进行核查。


