Abstract
• Chart patterns are important tools in technical analysis used to observe changes in market supply and demand, trend continuation, or trend reversal.
• Pattern analysis is not about mechanical memorization of shapes, but rather a comprehensive judgment of trends, volume, support and resistance, time cycles, and the validity of breakouts.
• Patterns can be broadly categorized into two types: one is reversal patterns, including double tops, double bottoms, head and shoulders top, head and shoulders bottom, etc.; the other is continuation patterns, including flags, triangles, rectangles, etc.
• Effective breakouts generally need to be based on clear support/resistance, long periods of consolidation, trend background, and volume confirmation.
• A breakout does not equate to a certain trend; false breakouts occur frequently in live trading, so traders need to control risks through position sizing, stop loss, pullback confirmation, and staged profit-taking.
1. Introduction
Chart patterns are important tools in technical analysis used to observe changes in market supply and demand, trend continuation, or trend reversal. The core logic is that price action reflects the buying and selling power of market participants, and patterns compress the long-short game into observable graphical structures. Pattern analysis is not about mechanical memorization of shapes, but rather a comprehensive judgment of trends, volume, support and resistance, time cycles, and the validity of breakouts.
Breakout trading is a direct application scenario of pattern analysis. Effective breakouts generally need to be based on clear support/resistance, long periods of consolidation, trend background, and volume confirmation. A breakout does not equate to a certain trend; false breakouts occur frequently in live trading, so traders need to control risks through position sizing, stop loss, pullback confirmation, and staged profit-taking.
2. Theoretical Framework of Pattern Analysis
2.1 Two Basic Assumptions
Technical analysis usually relies on two basic assumptions:
1. Prices move in trends;
2. History tends to repeat itself in a similar manner.
In an uptrend, bulls typically dominate; in a downtrend, bears typically dominate. However, trends do not last forever; when the balance of power between bulls and bears is reached, prices enter a consolidation phase, which subsequently forms patterns. After the consolidation ends, prices may continue to move along the original trend or reverse the trend.
2.2 Pattern Classification
Common chart patterns can be divided into the following categories. It is important to note that pattern classification is not absolute. The same pattern could have different meanings depending on different locations, time frames, and volume structures.
3. Main Pattern Types
3.1 Rectangle Pattern
A rectangle pattern forms when prices oscillate between two parallel support and resistance levels, indicating market indecision. Rectangles usually belong to continuation patterns but can also evolve into reversal patterns, depending on the breakout direction and volume confirmation. Typical characteristics of rectangle patterns include:
• Prices repeatedly test the upper and lower boundaries;
• Support and resistance are relatively clear;
• The forces of bulls and bears are relatively balanced during consolidation;
• Significant volume expansion during effective breakout or breakdown.
Rectangle patterns can be divided into bullish rectangles and bearish rectangles. Whether breaking upward or downward, subsequent volatility typically matches the width of the rectangle.
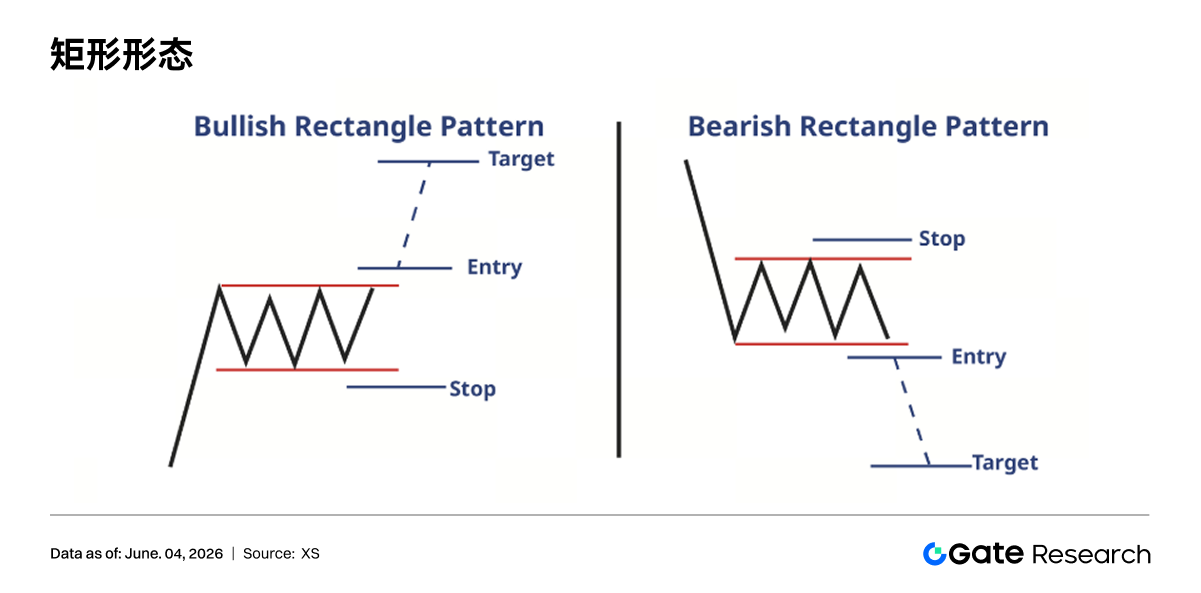
•Bullish Rectangle: In an uptrend, when prices stop moving up and form a horizontal shape between two price levels, a bullish rectangle forms. This pattern suggests that the market will enter a short consolidation before prices resume their upward trend. A price breakout above the resistance level with increased volume can confirm that the uptrend will continue. Traders can establish long positions after the breakout and set target levels above the height of the rectangle from the resistance line.
•Bearish Rectangle: When prices maintain a stable horizontal range during a downtrend, a bearish rectangle pattern appears. The market continues to decline after a brief consolidation through this pattern. A breakdown below the support level can confirm that the downtrend will continue. Traders should establish short positions after the breakdown, anticipating that prices will drop to the height of the rectangle.
3.2 Flag Patterns and Pennant Patterns
Flag patterns and pennant patterns both belong to short-term continuation patterns, typically occurring after a period of rapid rise or fall. The flag pattern consists of a sharp price movement (flagpole) followed by a rectangular or parallelogram consolidation phase (flag), where the incline direction is opposite to the trend. The pennant pattern also starts with a sharp price movement (flagpole) but is followed by a small symmetrical triangle formed by converging trend lines. Typical characteristics include:
• A significant move should precede the formation;
• The flagpole stage is usually accompanied by higher volume;
• Volume may decrease during the consolidation phase;
• Volume should expand again upon re-breakout.
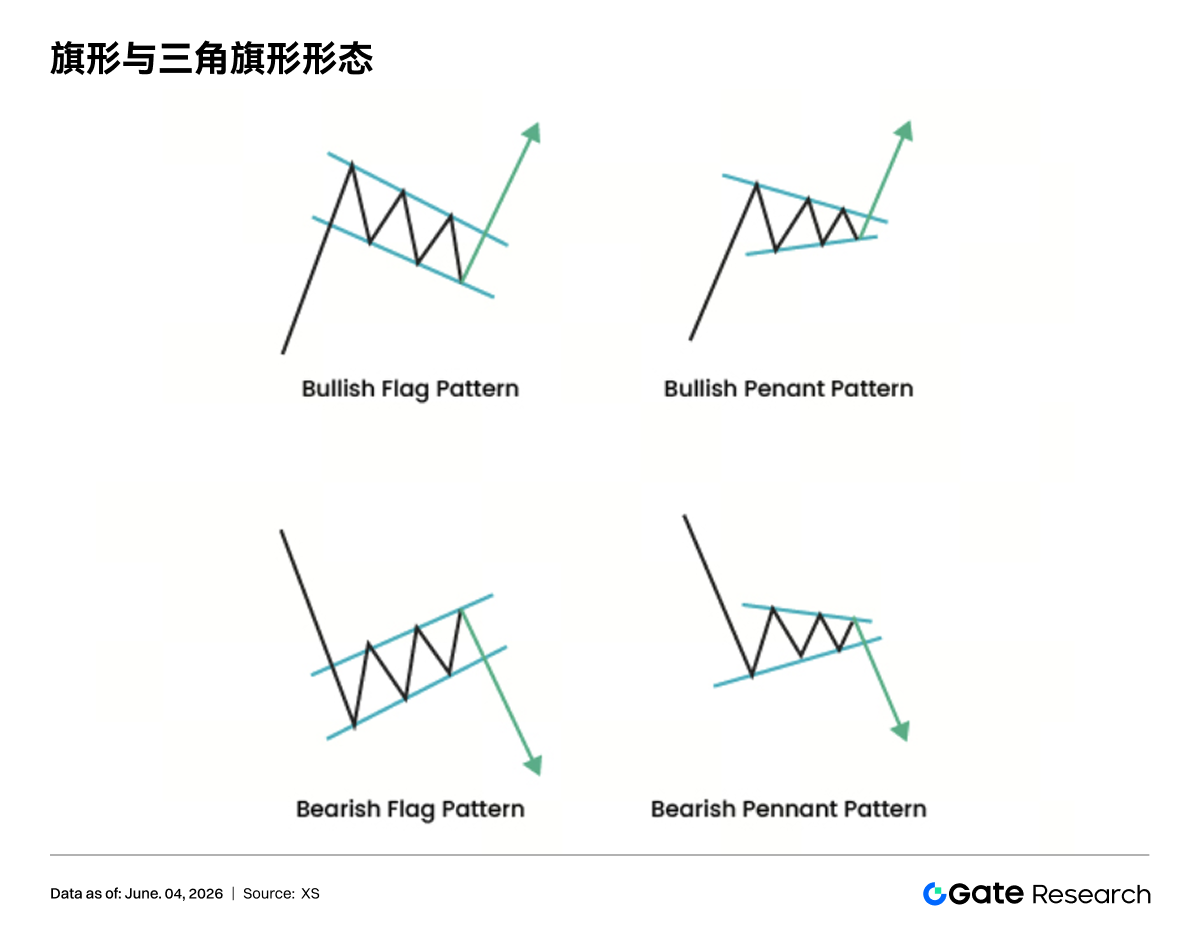
The flag pattern typically indicates that the existing trend will extend in the short term. Breakouts usually occur in the original flagpole direction, with the flagpole being a rapid price movement before the flag forms. After the breakout, the length of the flagpole can be used to project subsequent target levels.
Traders can enter when prices break out of the flag pattern. For bullish flag patterns, look for signs of prices breaking above the upper trend line; for bearish flag patterns, look for signs of prices breaking below the lower trend line. Set profit targets based on the height of the flagpole. Use stop loss orders to manage risk and prevent false breakouts.
It is important to note that rectangle patterns typically take about 3 months to form, while flag patterns usually take about 3 weeks.
3.3 Symmetrical Triangle
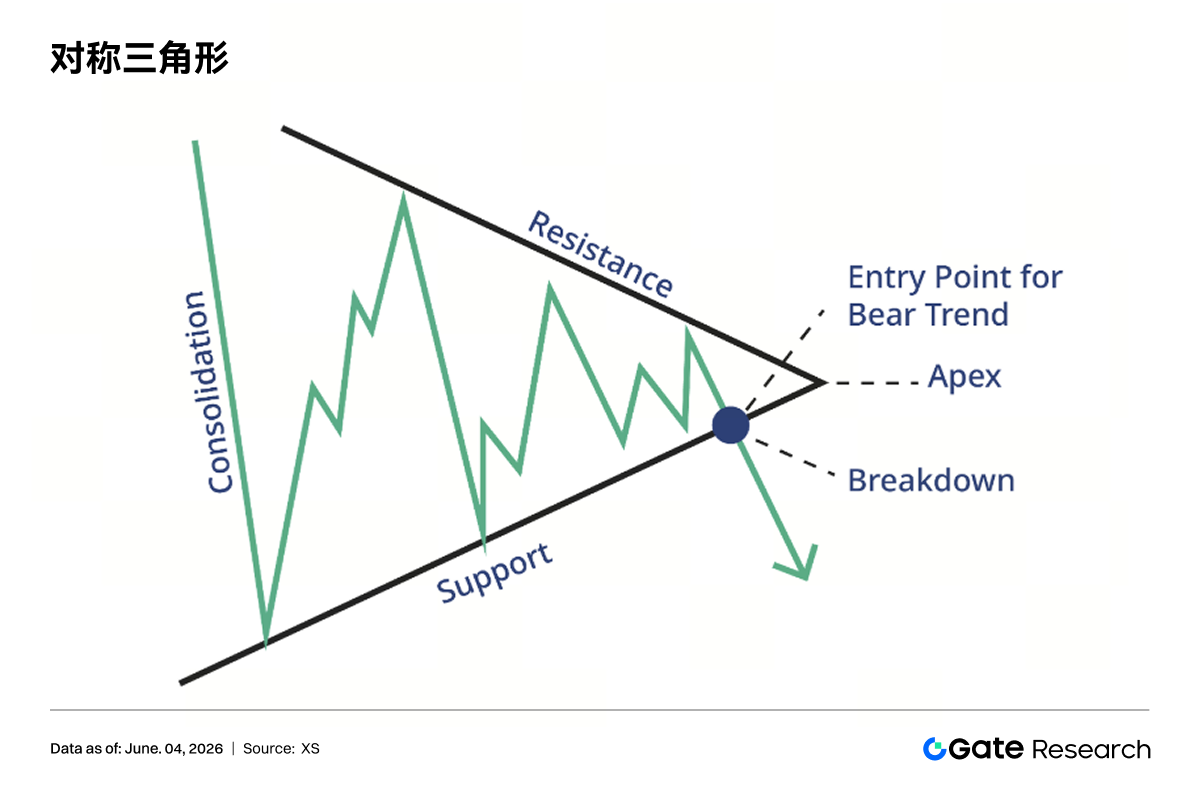
Symmetrical triangles are generally bullish but can break upward or downward. They manifest as progressively lower highs and progressively higher lows, with a continuously narrowing fluctuation range. Unlike flags, symmetrical triangles usually last longer than three weeks. This pattern reflects a market entering a stage of indecision, where the forces of bulls and bears temporarily approach balance. Symmetrical triangles often appear as continuation patterns but can also become reversal patterns. When determining the direction, one should wait for valid breakouts or breakdowns instead of making subjective predictions in advance. Typical characteristics include:
• At least two progressively lower highs;
• At least two progressively higher lows;
• Volume typically decreases during the convergence process;
• Ideal breakout positions usually occur between halfway and three-quarters of the pattern's development;
• Observe volume and price acceleration during breakouts or breakdowns.
Target levels can be estimated in two ways: one is to measure the widest part of the triangle and project it to the breakout point; the other is to draw a line parallel to the trendline and estimate the price movement space. The essence of symmetrical triangles is not to determine which side, bulls or bears, has won but to identify the process of market volatility gradually converging. Lowering highs indicates that selling pressure arises with each bounce, and elevating lows indicates that buying interest also intervenes with every drop. The forces on both sides continue to compress, ultimately necessitating a decision through breakout or breakdown.
3.4 Ascending Triangle
Ascending triangles are usually considered bullish patterns. Their upper boundary is approximately horizontal, representing resistance; the lower boundary progressively rises, indicating that buyers are willing to enter at increasingly higher levels. The key significance of this pattern is that sellers repeatedly suppress prices at the same resistance level, while buying power gradually strengthens, potentially pushing prices to break through resistance. Typical characteristics include:
• The top resistance is relatively flat;
• The bottom lows progressively rise;
• Volume should expand significantly upon breakout;
• The original resistance level may turn into a support level after breakout.
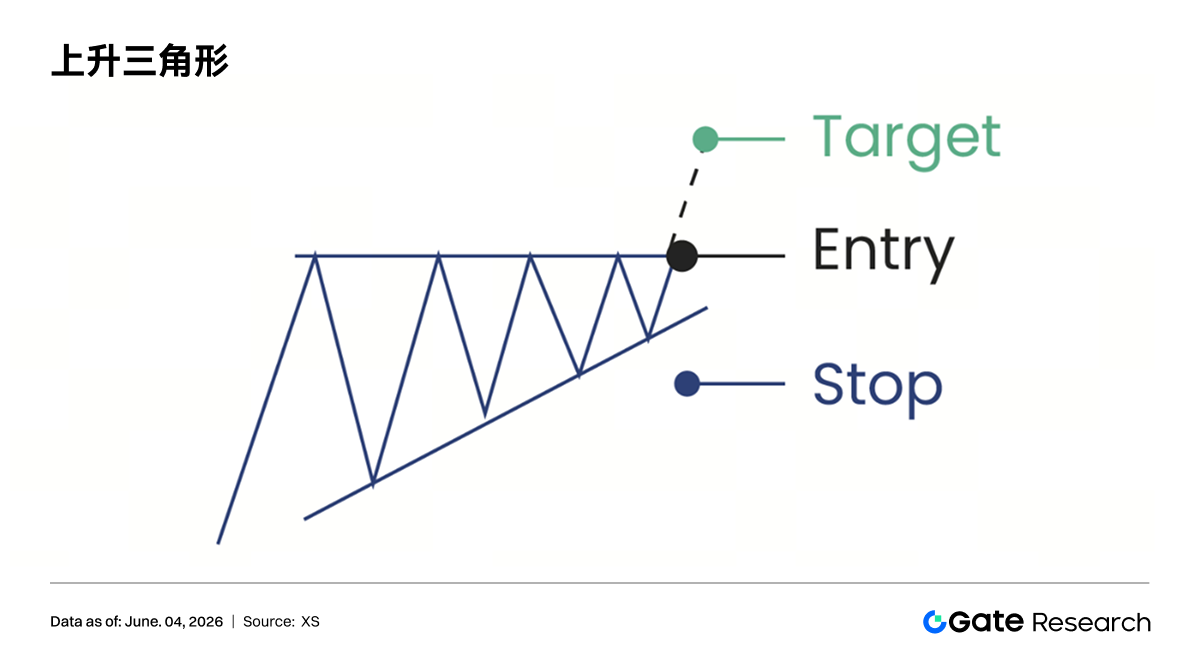
Target levels can be calculated by taking the height of the widest part of the pattern and adding it above the breakout level. The key for ascending triangles lies in the relatively fixed top resistance and continuously rising bottom support. Multiple tests of the resistance level indicate sustained selling pressure; however, each low from subsequent pullbacks progressively rises, showing that buyers are willing to absorb leveraged positions at higher costs. As the price fluctuation range narrows and the selling pressure is gradually digested, if a breakout occurs with volume, upper space is often opened.
3.5 Descending Triangle
Descending triangles are the inverse structure of ascending triangles, typically viewed as bearish patterns. Their lower boundary is approximately horizontal, representing support; the upper boundary progressively declines, indicating that sellers exert pressure at increasingly lower levels. Typical characteristics include:
• The bottom support is relatively flat;
• The upper highs progressively lower;
• After breaking through support, the original support may turn into resistance;
• Target levels can be projected downwards using the height of the pattern.
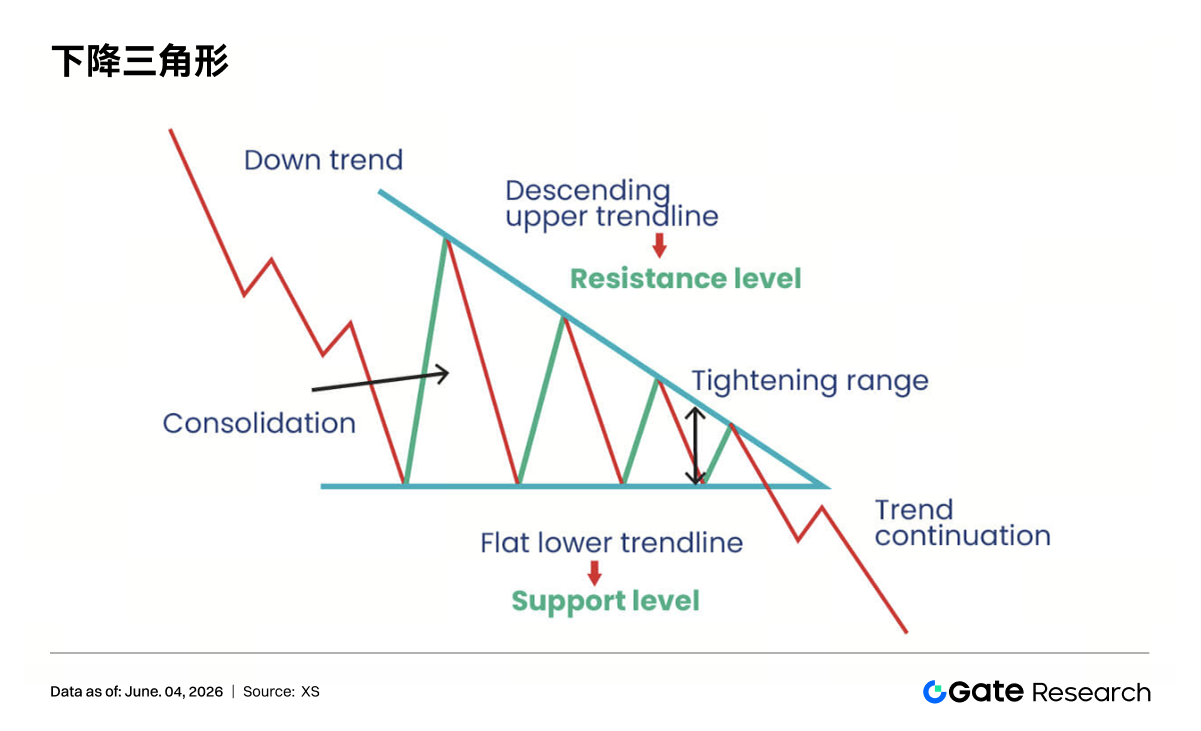
The essence of descending triangles lies in the repeated testing of bottom support, while the rebound highs continue to drop. Multiple touches of the support level indicate that there is still buying interest in that area; however, the lowering heights of each rebound suggest that sellers are willing to continue selling at lower levels, diminishing the strength of the bull response. When prices eventually break below the horizontal support, the previous support may convert into stop-loss orders and new selling pressure, leading to further declines.
3.6 Head and Shoulders and Inverted Head and Shoulders
The head and shoulders top is a significant reversal pattern, a classic bearish reversal formation that usually appears at the end of an uptrend. It consists of the left shoulder, head, right shoulder, and neckline, which connects the low points on either side of the head and extends to the right, forming the neckline. The head is higher than the left and right shoulders, which are roughly of similar height. The formation logic is as follows:
• In an uptrend, prices reach a stage high, forming the left shoulder;
• The price then hits a new high, forming the head, but volume may weaken;
• The third rebound fails to break above the head's height, forming the right shoulder;
• When the price breaks below the neckline, the pattern completes, signaling a trend reversal.
The left shoulder's rise is accompanied by higher volume, the head shows diminished volume, and the right shoulder's rebound has even weaker volume; when breaking below the neckline, volume increases, enhancing the reliability of the reversal signal. The target level calculation method is to measure the vertical distance from the head to the neckline and project it downward from the neckline breakout point. After the neckline is broken, the previous support level typically becomes a resistance level.
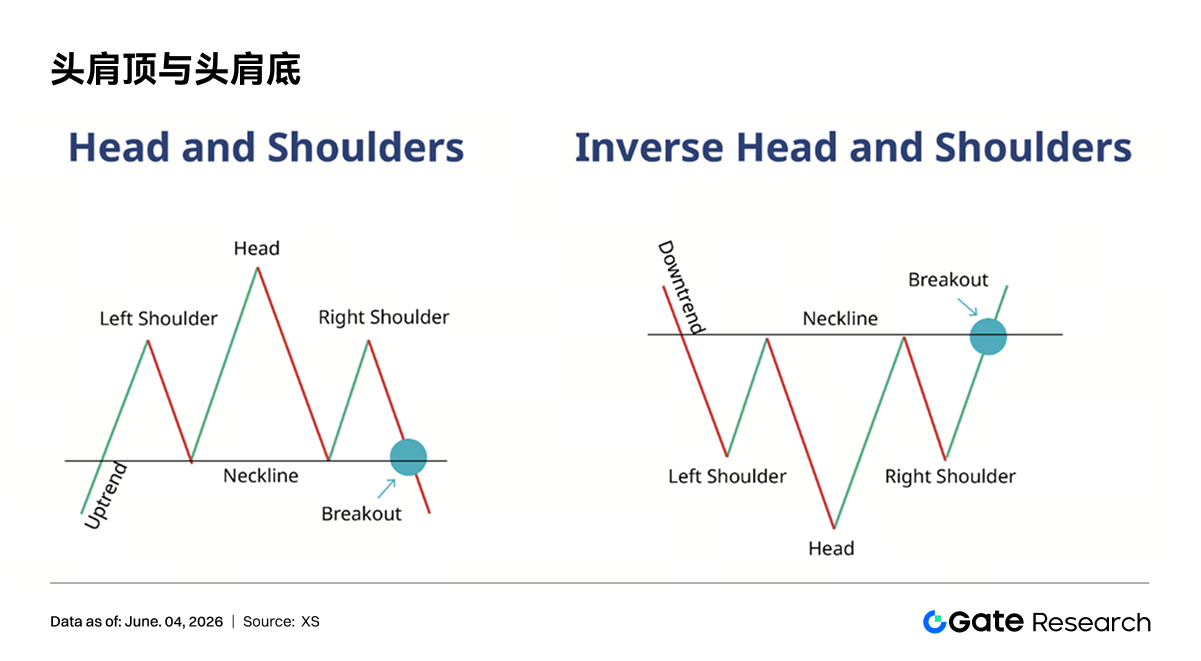
The inverted head and shoulders is the inverse structure of the head and shoulders top and usually happens at the end of a downtrend. Its structure consists of the left shoulder, head, right shoulder, and neckline, where the head is lower than both side shoulders. Its logic and usage are opposite that of the head and shoulders top.
4. Breakout and Breakdown Trading Strategies
4.1 Definition of Breakout Trading
A breakout (breakout) refers to the price moving up beyond a clearly defined resistance level and continuing to rise; a breakdown (breakdown) is when the price breaks down below a clearly defined support level and continues to fall, generally referred to collectively as breakouts. The core concern for breakout traders is not the fluctuations within a range but the trend extension after prices leave the original range. The underlying logic of breakout trading is that once prices effectively escape the range after a long consolidation or clear pattern formation, it may trigger a bigger-scale行情.
Breakout trading is effective because it reflects market psychology and herd mentality. Many traders set buy or sell orders above resistance or below support. When prices break through these levels, all pending orders get triggered simultaneously, causing rapid market fluctuations, and this FOMO (fear of missing out) sentiment further drives prices up.
4.2 The Relationship Between Range Trading and Breakout Trading
Range traders usually buy near support levels and sell near resistance levels, profiting from price fluctuations within the channel. Breakout traders wait for prices to leave the range and trade accordingly. The two approaches are not contradictory but correspond to different market phases.
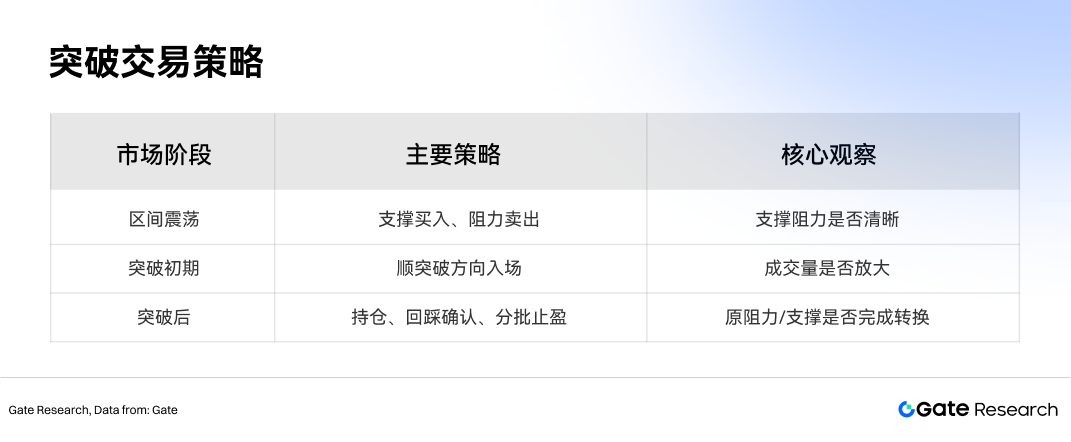
4.3 Conditions for Effective Breakouts
Effective breakouts usually have the following characteristics:
• Prices break through clear resistance or drop below clear support;
• There is a clearly defined consolidation range or pattern before the breakout;
• Volume expands during the breakout;
• After the breakout, prices do not quickly return to the original range;
• If a pullback occurs, the original resistance should convert to support, and the original support should convert to resistance.
In practice, the effectiveness of breakouts should not just rely on instantaneous price movements; one should focus on the closing position. If prices break above resistance during the session but close below it, there is still strong selling pressure above; if prices close firmly above resistance with increased volume, the signal quality is higher. For daily chart traders, daily close confirmations are often more valuable than intraday breakouts; for short-term traders, it is also advisable to use corresponding periodic closing confirmations to avoid being disturbed by instantaneous fluctuations.
The quality of consolidation before breakouts is also crucial. Good breakout patterns typically exhibit three features: first, clear boundaries of the consolidation range, allowing market participants to identify nearby support and resistance; second, adequate consolidation time, indicating sufficient exchange of positions; third, gradually converging fluctuations during consolidation, showing that direction selection is approaching. If prices suddenly rise without clear consolidation or critical resistance, it is more likely to be short-term impulse rather than a structural breakout.
Breakout signals can be divided into strong, medium, and weak levels. Strong breakouts typically manifest as long bullish or bearish candles, with a closing price significantly away from the breakout level and not returning to the original range; medium breakouts exhibit slightly above the breakout level at closing but require pullback confirmation; weak breakouts show intraday breakouts but end with unstable closes, insufficient volume, or immediate sideways movement post-breakout. Different levels of breakouts should correspond to different position sizes rather than applying the same position rules.
4.4 Entry and Stop Loss
Basic trading strategies include:
• For upward breakouts, one can go long above the high of the first candle after the breakout;
• For downward breakdowns, one can go short below the low of the first candle after the breakdown;
• In range trading, one can buy near support and sell near resistance;
• In breakout trading, stop losses can be set about 1% to 2% below the breakout level or set just outside the critical support/resistance of the pattern.
Entry methods can be further divided into three types. The first type is entering at the breakout, suitable for situations with significantly increased volume, strong closing prices, and clear market trends. The advantage is capturing the strongest movement, while the downside is the high cost of false breakouts. The second type is entering on pullback confirmation, appropriate when prices pull back to test original resistance or support after the breakout. The advantage is a clearer risk-reward ratio, while the downside is possibly missing strong trends that do not pull back. The third type is entering in batches, which involves building partial positions at breakout and adding to the position after confirming the pullback, balancing opportunity and risk management.
Stop loss settings should follow the principle of "stop loss when the pattern fails." For rectangle breakouts, if prices return to the inside of the rectangle and cannot consistently stay in the breakout direction, the pattern weakens; for triangle breakouts, if prices return inside the triangle, the breakout signal usually fails; for head and shoulders patterns, if prices return to the neckline from the opposite side and stabilize after a breakout or breakdown, the reversal signal needs to be reassessed. Stop losses should not be mechanically fixed to a single ratio but should be comprehensively determined by the asset's volatility, volume, liquidity, periodic levels, and position sizes.
On position management, one should allocate different layers based on signal quality. Strong breakouts can allocate a relatively high base position, medium breakouts focus on exploratory positions, and weak breakouts should wait for confirmation. If multiple signals across different time frames resonate in the same direction, such as a weekly upward trend, a daily rectangle breakout, and simultaneous volume expansion, position sizes can be more aggressive; if short-term breakouts are close to long-term resistance levels, one should reduce position sizes or increase profit-taking requirements.
4.5 Profit Taking and Position Management
In trading execution, buying is often relatively easy, while selling and position management test discipline more. The core of profit in breakout trading lies in letting effective trends run while avoiding large losses from false breakouts. Possible position management methods include:
• Selling part of the position after reaching the first target level;
• Retaining the remaining position to follow the trend;
• Protecting profits with trailing stop losses;
• If prices rapidly drop back into the range after a breakout, decisively reduce positions or stop out.
Profit-taking methods can be divided into target-based profit taking, structural profit taking, and trend-based profit taking. Target-based profit taking is suitable for trades where the height calculation of patterns is clearer, such as rectangles, triangles, and head and shoulders; structural profit taking is suitable when prices reach previous highs, previous lows, long-term moving averages, or significant volume density areas; trend-based profit taking applies to strong trends post-effective breakouts, where one can use trailing moving averages, rising trend lines, previous low points, or volatility stop losses as exit criteria.
In breakout trading, premature profit taking and delayed stop losses are the most common sources of performance loss. If prices are quickly liquidated for a slight profit just after breaking out, one might miss the primary trend rally; if breakthrough failures are not followed by stop losses, a single loss might consume multiple small profits. Therefore, the strategy can adopt the principle of "first protect the capital, then maximize the profit": if prices run to a certain profit level after breakouts, stop losses can be moved up to near the cost; after reaching the first target level, part of the position can be realized; the remaining position can track the trend rules.
5. Breakout Types and Their Trading Implications
Common post-breakout movements can be divided into three categories: effective breakouts, pullback breakouts, and false breakouts.
5.1 Effective Breakouts
The breakouts mentioned above are effective breakouts where prices rise rapidly and almost do not look back. There may be short-term pullbacks of a few candles, but in most cases, prices will continue to rise until the trend ends. These opportunities represent the ideal situation for trend traders, but occur less frequently.
Typical characteristics of effective breakouts include: strong entities of breakout candles, closing prices outside the breakout zone, volume significantly higher than the average volume during consolidation, and small retracement amplitude after the breakout. If prices run in the direction of the breakout for several candles in succession after breaking out, it indicates that market consensus has formed, and one can adopt trend-following methods for position management rather than exiting prematurely based on small targets.
5.2 Pullback Breakouts
Pullback breakouts refer to the scenario where prices first break above resistance, then retreat to test the original breakout area, confirming support before rising again. Many traders will wait for pullback confirmation before entering positions to reduce the risk of false breakouts. The risk lies in the fact that not all breakouts will pull back. If traders wait too long, they might miss rapid price rallies.
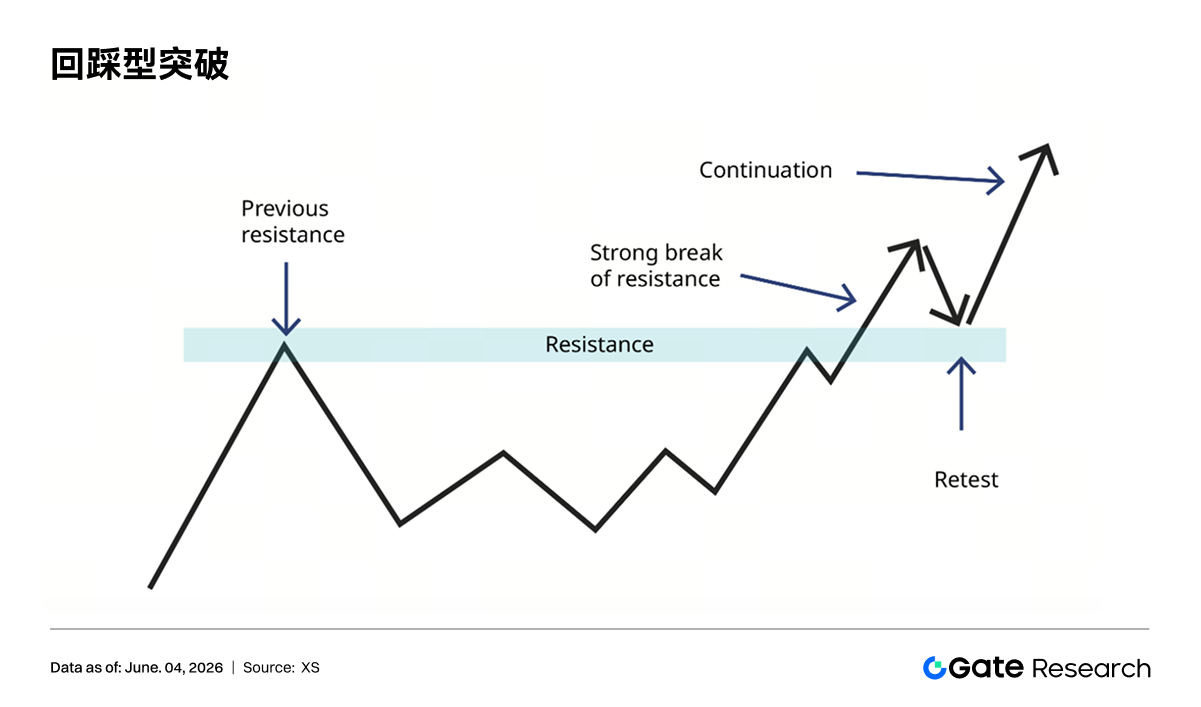
The key for pullback breakouts lies in whether the pullback is "orderly." A healthy pullback typically exhibits diminished volume followed by increased volume during subsequent upswing. If during the pullback, volume increases and drops below the breakout level while staying within the original range, it indicates the previous breakout may fail. For confirmation of upward reactions after downward breakouts, one should observe whether the pullback encounters resistance at the original support area.
Pullback entry methods are suitable for funds with lower risk appetite. Their advantage is closer stop loss positions and clearer risk-reward ratios; the disadvantage is that strong trends may not provide pullback opportunities. Therefore, when the market is in a strong trend phase, one might consider participating with small positions during the breakout and increasing positions during pullbacks.
5.3 False Breakouts
False breakouts refer to situations where prices briefly break above resistance or below support, then swiftly return to the original range, sometimes even moving in the opposite direction. False breakouts frequently occur in breakout trading and are a significant source of psychological pressure and losses for traders. The key to dealing with false breakouts is not to completely avoid them but to acknowledge their existence in advance and control single losses within an acceptable range through stop losses and position management.
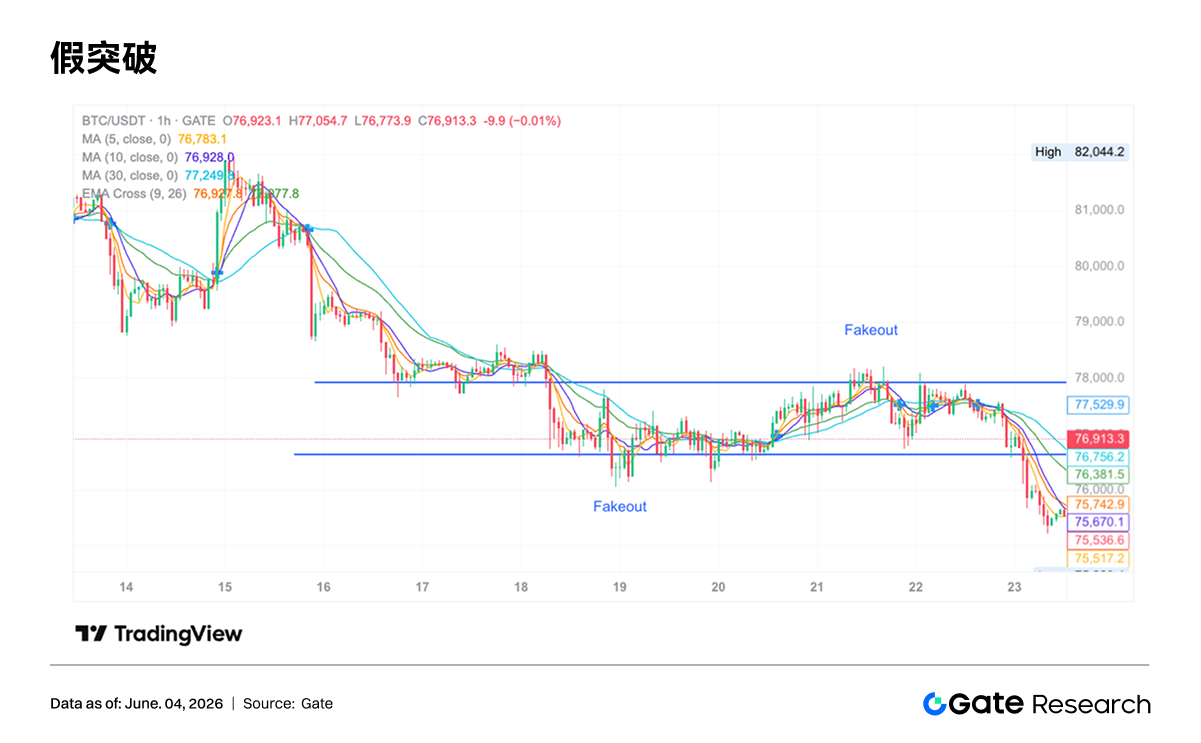
False breakouts commonly occur in three scenarios: firstly, the market lacks an overall trend, and breakouts near the range boundaries tend to originate from short-term funds testing; secondly, there is no significant increase in volume during the breakout, indicating insufficient participation from new funds; thirdly, after a price breakout, it encounters higher-level resistance or support, causing short-term signals to be suppressed by the long-term structure.
Identifying false breakouts can be done by observing three signals: prices unable to close consecutively outside key levels after the breakout, rapid volume contraction after the breakout, and prices quickly reversing to break below the low of the breakout candle or above the high of the breakdown candle. In response, traders can lower their entry positions on the first breakout, require closing confirmation, or wait for pullback confirmation before increasing their positions.
6. Breakout Verification Indicators
6.1 Volume
Volume is an important indicator for verifying the validity of a pattern breakout. Volume usually decreases during the consolidation phase, while it should significantly increase during the breakout phase. Especially in upward breakouts and head and shoulders neckline breakouts, a lack of accompanying volume decreases reliability.
6.2 Support and Resistance Conversion
Support and resistance conversion is a fundamental basis for breakout trading. After prices break above resistance, the original resistance level often becomes new support; after prices break below support, the original support level typically becomes new resistance. Whether pullbacks or reactions are successful is a key observation for confirming the effectiveness of the breakout.
6.3 Momentum Indicators
The following momentum indicators can also be used to verify breakout trading:
•Average True Range (ATR): A volatility indicator, the ATR indicator shows an increase in market activity through its continuously rising values, leading to price breakouts at established levels.
•Moving Averages (MA): An indicator for judging current market trends. Breakouts of major moving averages (either upward or downward) can confirm that a trend has changed.
•Bollinger Bands: A volatility indicator, when volatility is low, Bollinger Bands narrow, referred to as "squeeze." Prices often break out immediately following a squeeze.
•Relative Strength Index (RSI): It can help traders identify overbought or oversold market conditions before or after price movements occur.
7. Conclusion
Chart patterns and breakout trading can provide a structured framework for market judgments, but their effectiveness comes from the resonance of multiple factors rather than the pattern itself. The trend background, volume confirmation, support and resistance conversion, duration of the pattern, and risk management collectively determine the quality of trading signals. For institutions or professional traders, pattern analysis is better suited as a component within a trading system rather than an independent basis for decision-making. A more robust approach is to establish an observation checklist based on pattern recognition, trigger trading plans upon breakout confirmations, control risks through position sizing and stop losses, and manage trend profits through staged profit-taking and trailing stops.
References
•XS, https://www.xs.com/en/blog/flag-patterns/
•XS, https://www.xs.com/en/blog/symmetrical-triangle-pattern/
•Forex, https://forextraininggroup.com/false-breakouts-fakeouts-can-profitable-setups/fakeout-pattern-on-a-rising-wedge/
•Coursera, https://www.coursera.org/learn/master-trading-indicators-chart-patterns/home/welcome
Gate Research Institute is a comprehensive blockchain and cryptocurrency research platform that provides readers with in-depth content, including technical analysis, hot insights, market reviews, industry research, trend predictions, and macroeconomic policy analysis.
Disclaimer
Investing in the cryptocurrency market involves high risks, and users are advised to conduct independent research and thoroughly understand the nature of any assets and products purchased before making any investment decisions. Gate is not responsible for any losses or damages resulting from such investment decisions.
免责声明:本文章仅代表作者个人观点,不代表本平台的立场和观点。本文章仅供信息分享,不构成对任何人的任何投资建议。用户与作者之间的任何争议,与本平台无关。如网页中刊载的文章或图片涉及侵权,请提供相关的权利证明和身份证明发送邮件到support@aicoin.com,本平台相关工作人员将会进行核查。


