Wave in the Currency Sea: June 16th Bitcoin (BTC), Ethereum (ETH) today's latest market analysis reference, information interpretation
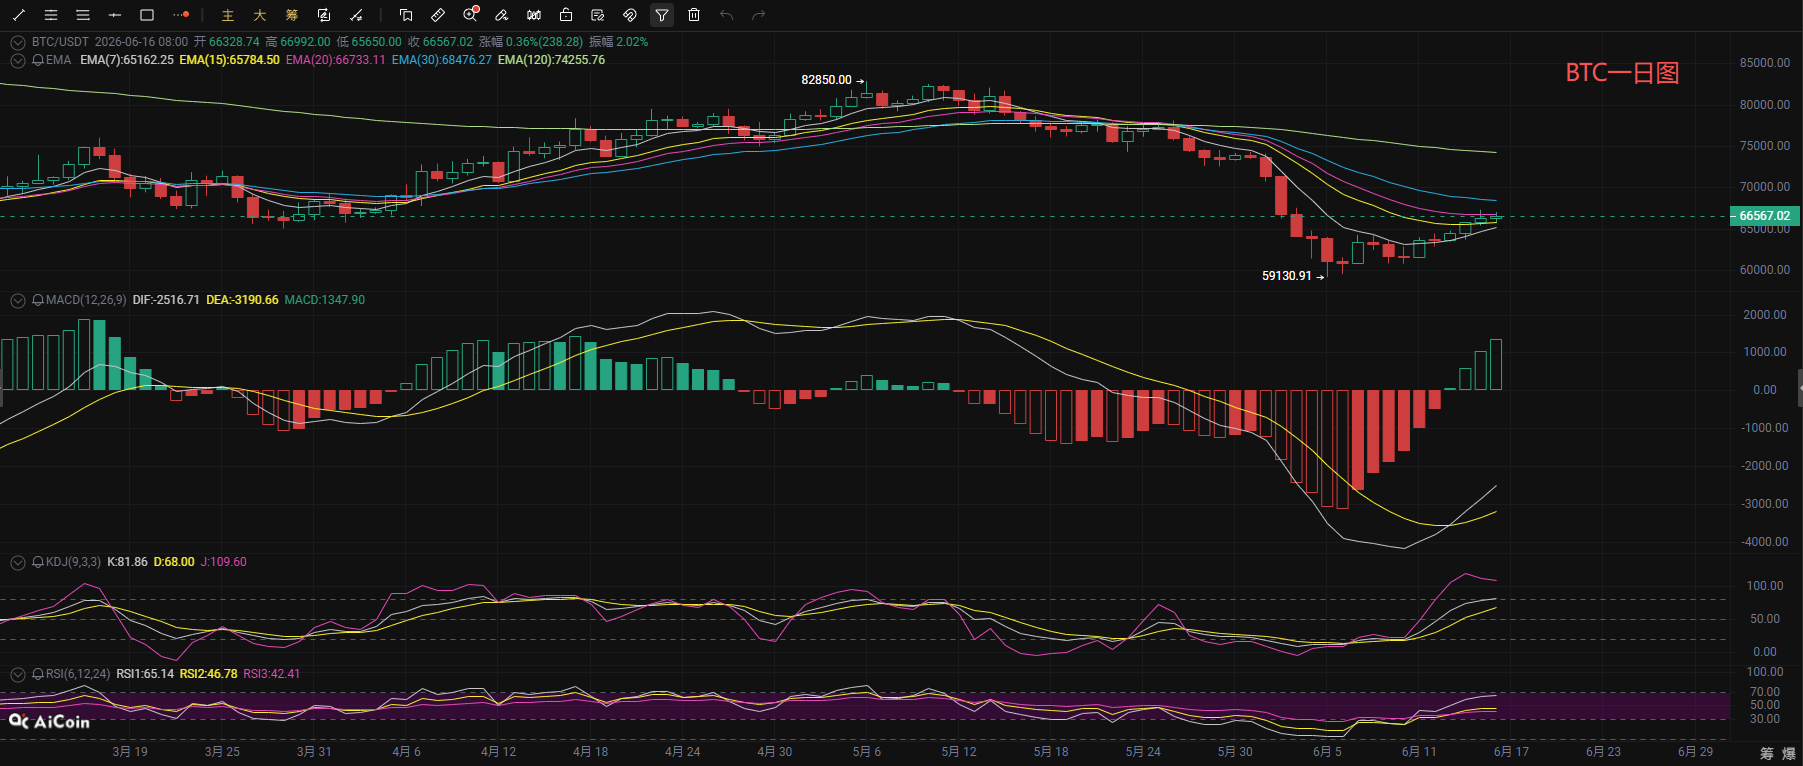
Bitcoin and Ethereum daily charts have synchronized out of the stop decline and rebounding structure, currently the coin price is operating near the middle track of the Bollinger Bands, with prices rebounding from previous lows. The MACD indicator is continually contracting and turning positive, the DIF indicator is turning upward, and the downward momentum has somewhat diminished; the KDJ indicator has entered the high zone approaching overbought, the RSI indicator is rising synchronously, and the EMA short-term moving average has turned upwards, confirming the daily level rebound trend. However, the overall long-term daily chart is still in a repair phase after a decline, with strong selling pressure at the upper medium to long-term moving averages, and a pullback power demand existing at high indicator levels, the overall trend is mainly a volatile rebound, and the upward rhythm will be suppressed by the upper moving averages.
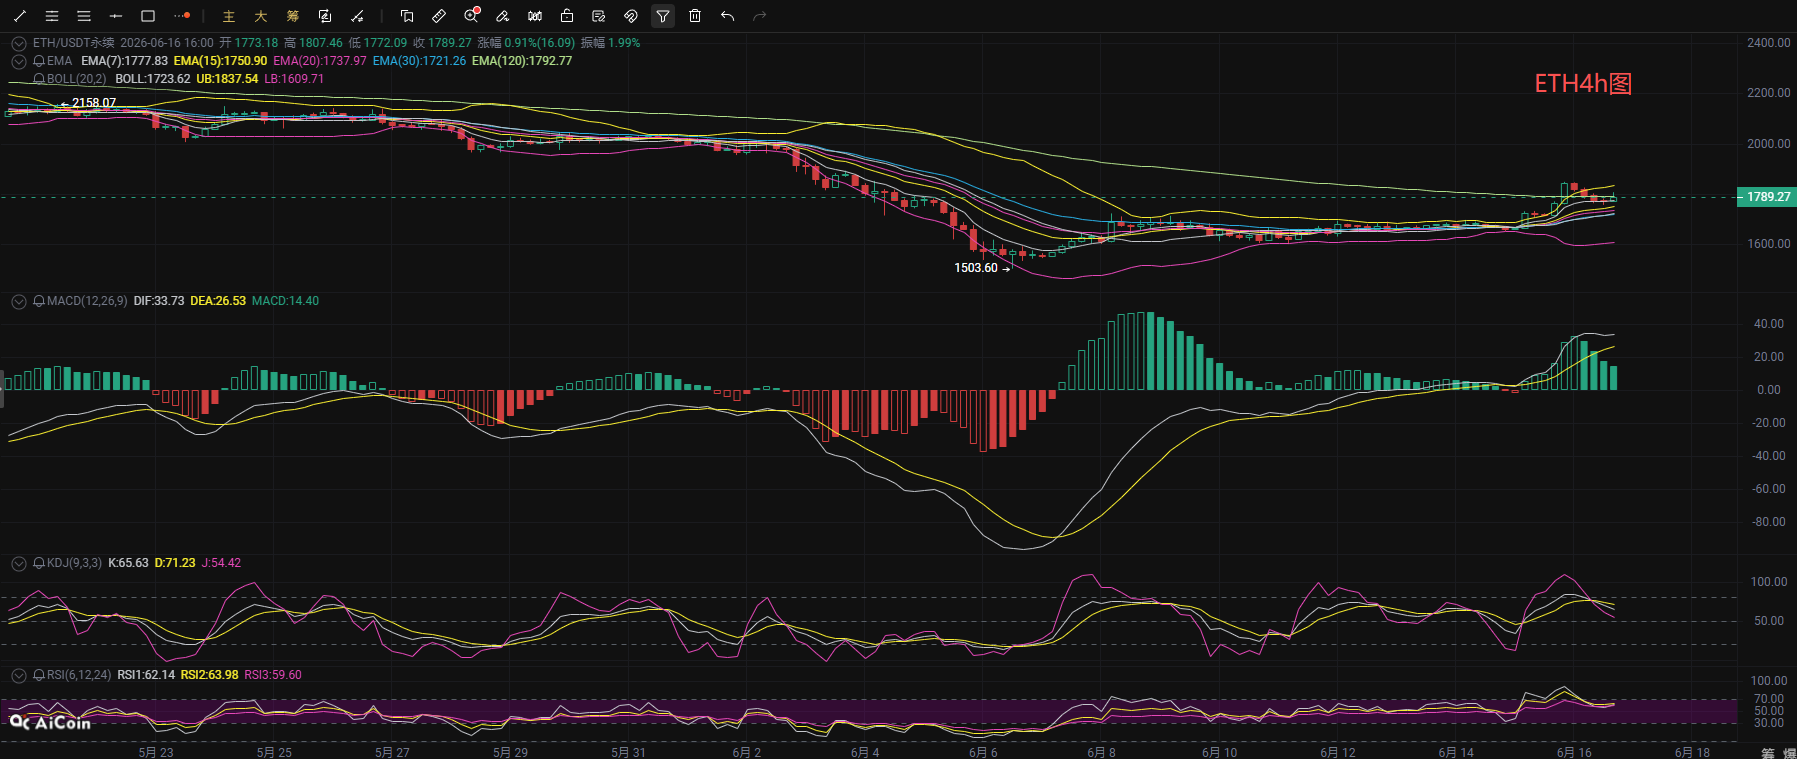
The short-term 4-hour level trend is stronger, with the coin price continuously lifting based on the short-term EMA moving average, and the Bollinger Band channel opening upward, maintaining operation above the middle track. The MACD bullish momentum is slightly shrinking in volume, but the DIF remains stable above the DEA line, continuing bullish strength; the KDJ indicator shows signs of a turning blunt, the RSI indicator is around 60, and bullish momentum has somewhat slowed, with short-term upward strength weakening. There is a slight pullback adjustment demand in short-term indicators, and after completing the pullback support at the moving average and building up strength, it is expected to continue to explore upwards, but due to heavy selling pressure at the medium to long-term moving averages on the daily level, it is not advisable to chase blindly higher, and one can layout strategies around high sell low buy.
Wave in the Currency Sea: June 16th Bitcoin short-term reference:
Long position: Buy in the range of 64700-65500, stop loss 500 points, target look at 66000-67200,
Short position: Sell in the range of 68000-67200, stop loss 500 points, target look at 66500-65500,
Wave in the Currency Sea: June 16th Ethereum short-term reference:
Short position: Sell in the range of 1860-1820, stop loss 30 points, target look at 1800-1750,
Long position: Buy in the range of 1710-1740, stop loss 30 points, target look at 1760-1820,
[The above analysis and strategy are for reference only, please bear the risks yourself. The article review and publication may be delayed, and the strategies lack timeliness, so do not operate blindly]

This content is originally shared by 【Wave in the Currency Sea】, representing personal views only, the article may have delays in transmission and is only for reference, please do not operate blindly! Want to get more daily real-time signals? Then follow my public account! Here, you can learn online technical analysis of market trends, and understand knowledge related to unlocking and exiting. I have years of research experience in the market, focusing on the overall trend in the cryptocurrency market. Mainly responsible for analyzing and guiding investment operations of BTC, ETH, SOL, BCH, and other coins. Welcome to study together.
免责声明:本文章仅代表作者个人观点,不代表本平台的立场和观点。本文章仅供信息分享,不构成对任何人的任何投资建议。用户与作者之间的任何争议,与本平台无关。如网页中刊载的文章或图片涉及侵权,请提供相关的权利证明和身份证明发送邮件到support@aicoin.com,本平台相关工作人员将会进行核查。