Academician of the Crypto Circle: Is the Bitcoin rebound on June 16 over or continuing? Latest market analysis and trading advice
Bitcoin is currently priced at 66400. How much did this wave of ascent capture? A reminder to everyone: it’s time to take profits, don’t let short-term rebounds cloud your judgment. I captured 3000 points in the short-term ascent, but the larger cycle has not yet emerged from the shadow of a downtrend. This is merely a technical recovery after a sharp decline; do not chase long positions with high leverage. A fluctuating market is the most grueling, as minor back-and-forth movements can easily trigger losses. Avoid opening positions frequently until the key support and resistance levels are reached. Friends who are stuck in positions should take advantage of this rebound to reduce their holdings and lower their risk, and do not fantasize about a direct surge to resolve their positions.
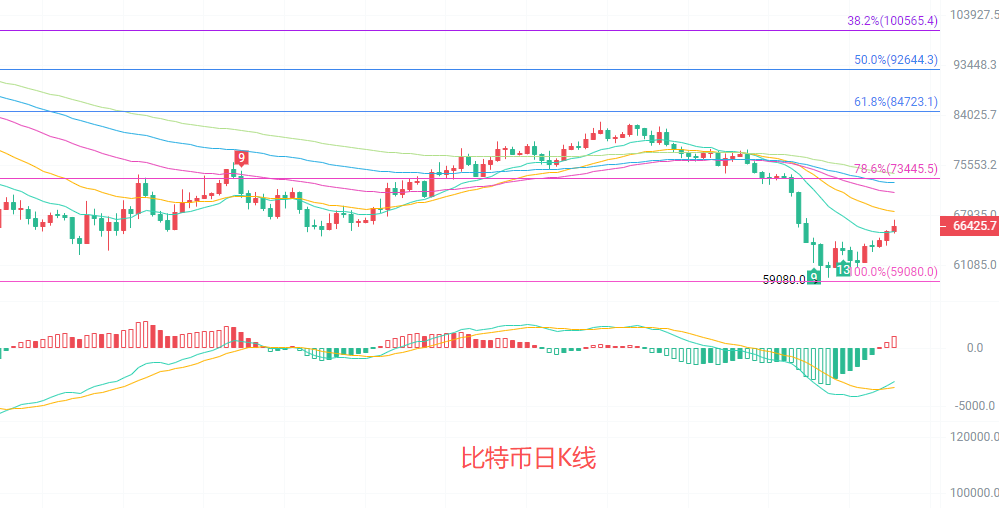
The daily K-line is currently in the recovery rebound phase after the low point of 59080. The price is still under pressure from all mid-to-long-term EMA moving averages. The Bollinger Bands are contracting; the middle line at 66512 is almost equal to the current price, with the upper line at 76076 and the lower line at 56948. It is operating in the middle to lower Bollinger Bands range in the short term. The MACD's downward momentum has significantly weakened, but a complete golden cross upward trend has not yet formed. The Fibonacci 0.236 resistance level at 68103 is the first level of pressure, and until it stabilizes above 6850 on the daily chart, it can only be defined as a rebound recovery after a decline. No reversal signal has appeared, and the large cycle downward structure has not been completely broken.
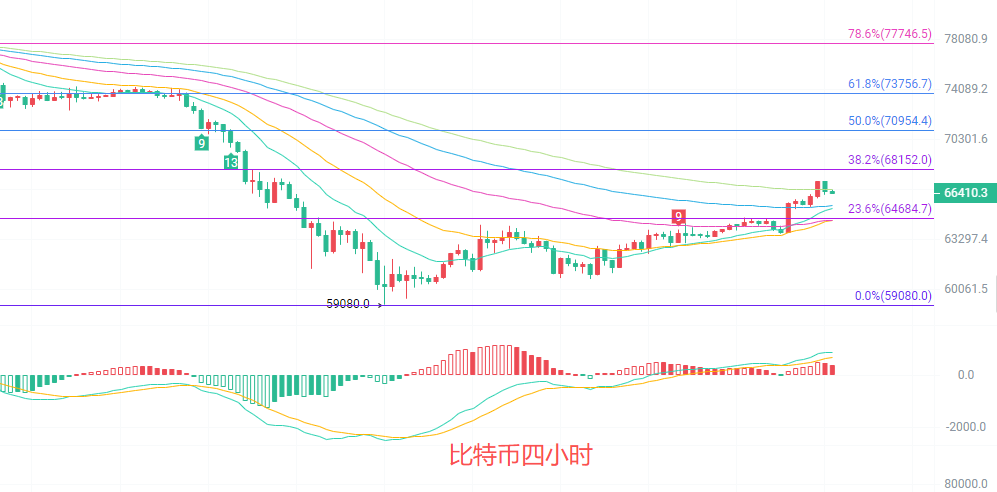
The hourly K-line is steadily rising, with the price firmly above the short-term moving averages, and the short-term upward rhythm is dominant. The EMA120 long-term moving average at 66703 is closely above, creating direct pressure and serving as a division of strength for the short term. The Bollinger Bands channel is continuously opening upward, with the middle line at 64813 acting as strong support, and the lower line at 62531 supporting the low point of this round of rebound. The MACD is maintaining a golden cross operation with ongoing short-term upward momentum, and the retracement force is minimal. The Fibonacci 0.236 pressure at 64684 has been effectively broken through, with the next resistance at the 0.382 level of 68152. The four-hour chart represents a standard oscillating upward structure, but there is significant pressure from long-term moving averages above, limiting the rebound space. It is likely to face pressure and fall back before testing support a second time, as the conditions for a substantial upward surge are not met.
Short-term trading strategy reference: Follow the trend of the larger cycle, small stop loss, quick entry and exit
Buy between 65000 and 64500, stop loss at 64000, target at 66500 to 67500
Sell between 67000 and 67500, stop loss at 68000, target at 66000 to 65500
Specific operations should be based on real-time market data. For more information, you can consult the author. The publication of the article may be delayed; the advice is for reference only, and risks are to be borne by the reader.

Friendly reminder: The above content is solely created by the author on Weibo. The advertisements at the end of the article and in the comment section are unrelated to the author, please discern carefully. Thank you for reading.
免责声明:本文章仅代表作者个人观点,不代表本平台的立场和观点。本文章仅供信息分享,不构成对任何人的任何投资建议。用户与作者之间的任何争议,与本平台无关。如网页中刊载的文章或图片涉及侵权,请提供相关的权利证明和身份证明发送邮件到support@aicoin.com,本平台相关工作人员将会进行核查。