Crypto Circle Academician: How far can the Ethereum rebound on June 16 go after the severe drop? Latest market analysis and operational suggestions.
The current price of Ethereum is 1815. Now the market has seen another wave of friends in the crypto world who are caught in a dilemma, with some heading south to 1700 without stop losses, and a group stubbornly heading to 1650 without stop losses. Those who missed the opportunity are starting to regret, while those who chased in are worried about being trapped by short-term adjustments. The market is always repeating the human emotional game, panicking when it drops and being greedy when it rises. At this position, even the gods can't find the right timing; how will you choose?
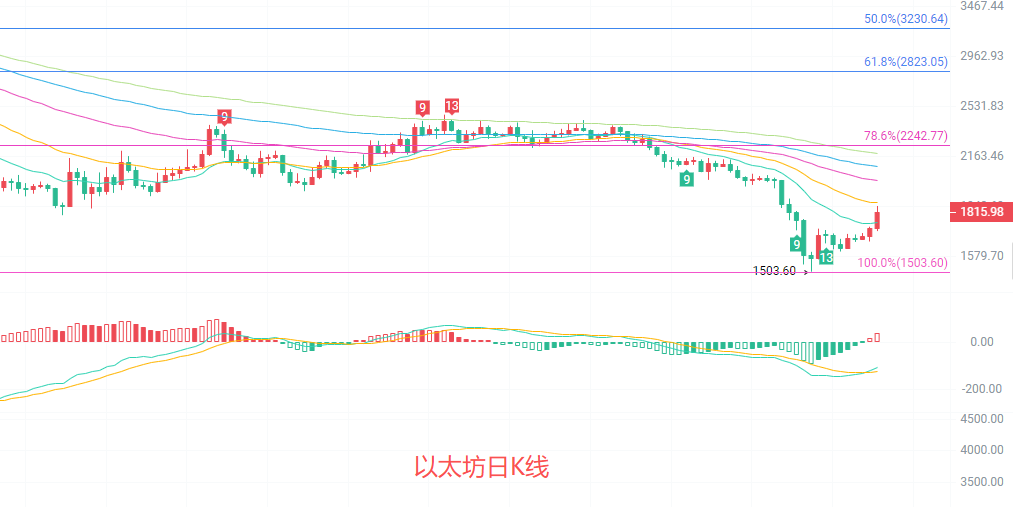
The daily K-line has started to repair and rebound from the low point of 1503. The price is currently above the EMA15 short-term average line at 1758, but still faces pressure from the EMA30 and EMA60 medium to long-term average lines. The first resistance above corresponds to the Fibonacci 0.236 position at 2242. The short-term rebound is a repair after a big drop and has not changed the long-term downtrend on the daily line. The MACD indicator DIF has turned upward from a low position and continues to shrink in volume. The northern momentum is gradually being released but has not completely reversed; the Bollinger Band price is tightly running above the lower track, and the overall channel is opening downwards. The large cycle's downward structure is unbroken, and the rebound can only be defined as a repair after overselling. The multiple average lines above will restrict the upward space, and there is a risk of retreat after a high surge.
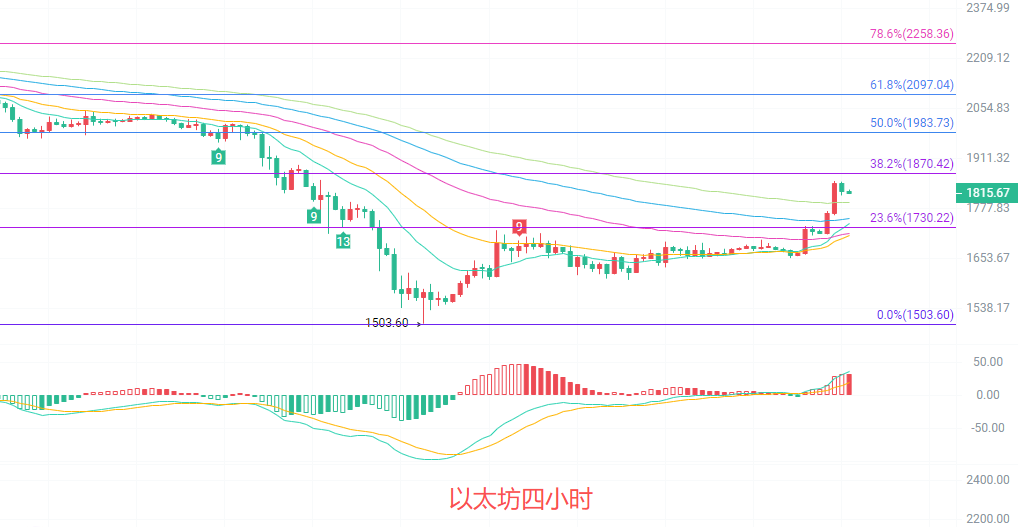
The four-hour K-line price is steadily standing above all short-term EMA average lines, with the 15/30/60 average lines all turning upward, forming a short-term upward support zone. The Fibonacci 0.236 resistance level at 1730 has been successfully broken, currently facing the 0.382 position at 1870, which is the first strong pressure zone for the short term. The MACD maintains operation in the upward range, with both the DIF and DEA lines rising together and maintaining an increasing volume, indicating sufficient upward strength for the short term; the Bollinger Band, after completing its contraction, is opening upwards, and the price is running near the upper Bollinger band, indicating a short-term overbought area. The short-term trend on the 4-hour chart is advantageous for the upward direction, but there is a hidden danger of a top divergence in the indicators. After approaching the 1870 pressure level, it is easy to experience pressure and retreat, so short-term blind chasing of highs is not advisable.
Short-term reference:
For the upper range of 1870 to 1920, go short with a stop loss at 1950, targeting 1820 to 1780.
For the lower range of 1780 to 1740, go long with a stop loss at 1700, targeting 1800 to 1850.
Specific operations should rely on real-time market data. For more information, you can consult the author. The article publication may have delays, and the suggestions are for reference only, with risks borne by the reader.

Kind reminder: The above content is exclusively created by the author of the public account. The advertisements at the end of the article and in the comments section are unrelated to the author, so please carefully discern, and thank you for reading.
免责声明:本文章仅代表作者个人观点,不代表本平台的立场和观点。本文章仅供信息分享,不构成对任何人的任何投资建议。用户与作者之间的任何争议,与本平台无关。如网页中刊载的文章或图片涉及侵权,请提供相关的权利证明和身份证明发送邮件到support@aicoin.com,本平台相关工作人员将会进行核查。