Academician of the Coin Circle: Let's take a look at the real-time data of Bitcoin's afternoon market on June 15
In the four-hour candlestick chart, the Fibonacci retracement from the starting point of this round of decline at 82828 to the low point of 59080 can be observed. The 0.236 position at 64684 has been effectively broken through, opening up a rebound space. The EMA15, 30, and 60 moving averages have all turned from downward to upward, and the coin price is steadily operating above the moving averages, establishing a short-term bullish trend. The MACD indicator shows that the bullish red bars are continuously expanding, with the dual lines diverging upwards, indicating strong bullish momentum; the middle line of the Bollinger Bands at 64285 forms solid support, and the channel is expanding upwards. The core resistance above is set at the 0.382 level of 68152. If this level cannot be broken with volume, the market is likely to enter a period of high-level consolidation; only by stabilizing above 68152 can it challenge the 0.5 retracement level at 70954, indicating a qualitative rebound after a decline at this stage.
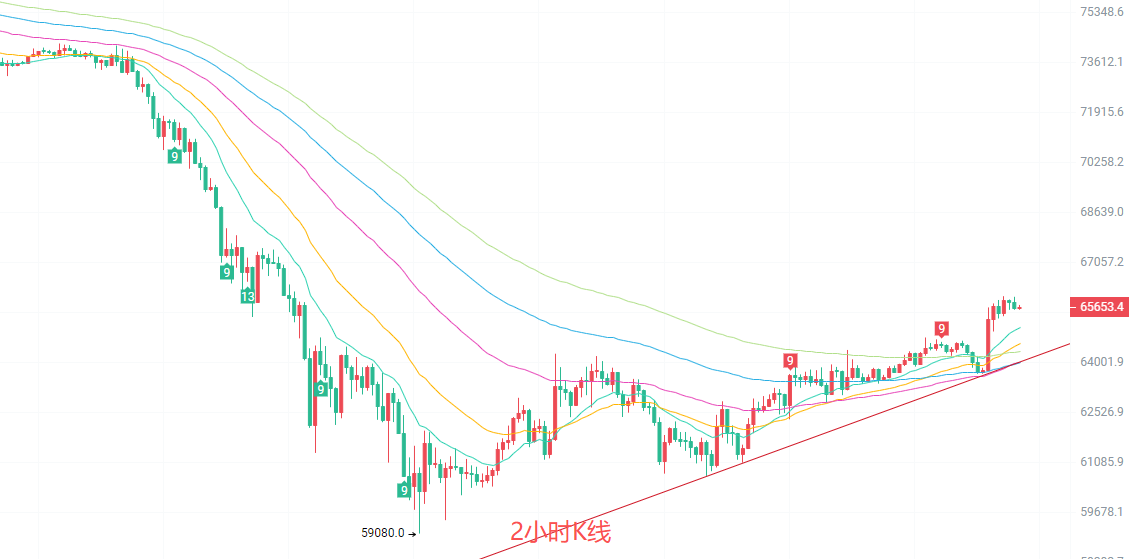
In the two-hour candlestick chart, the short-term rise to 65996 faced pressure and retraced, showing a pattern of narrow fluctuations at high levels. The moving average system maintains a bullish upward arrangement, with the short-term support tier intact, and no bearish signals of the moving averages turning downwards have appeared. The MACD short-term bullish effort has temporarily stagnated, requiring a pullback to wash out short-term profit-taking. The upper track of the Bollinger Bands at 66137 forms immediate short-term pressure, with the middle track at 64759 being the core support for this short-term rise. As long as the middle track support holds, there will still be upward momentum after the fluctuation ends; if the entity breaks below the middle track, it will deepen the magnitude of the pullback, overall showing a short-term bullish fluctuation with no signs of turning bearish.
Afternoon reference points for north and south
North: 64700-64900 stop loss at 64200, target 66100-68100
South: 68000-68300 stop loss at 68700, target 66200-65700

Kind reminder: The above content is only created by the author's public account. The advertisements at the end of the article and in the comment section are not related to the author. Please discern carefully, thank you for reading.
免责声明:本文章仅代表作者个人观点,不代表本平台的立场和观点。本文章仅供信息分享,不构成对任何人的任何投资建议。用户与作者之间的任何争议,与本平台无关。如网页中刊载的文章或图片涉及侵权,请提供相关的权利证明和身份证明发送邮件到support@aicoin.com,本平台相关工作人员将会进行核查。