This week's market environment is exceptionally complex—The US-Iran agreement exceeded expectations, and the reopening of the Strait of Hormuz triggered a drastic repricing of global assets. The significant fluctuations in sentiment are precisely when structural analysis can showcase its value. The louder the noise, the more important the framework.
This week we focus on two main lines: How will the competition result of BTC confirming a pullback after standing above $65,000 decide its subsequent direction; whether the pressure effect in the $62.5–64.57 area following the four-stage adjustment in HYPE will bring new short-term opportunities.
For complete trend structure analysis, market forecasting, and operational strategies, please refer to the main text.
Summary of core trading views this week:
• Analysis of the hour-level trend structure of BTC. (Details in part one)
• Forecast for BTC trends this week and mid and short-term operational strategies. (Details in part two)
• Analysis of the hour-level trend structure of HYPE. (Details in part three)
• Forecast for HYPE trends this week and short-term operational strategies. (Details in part four)
Validation of last week's trading strategies and core market views:
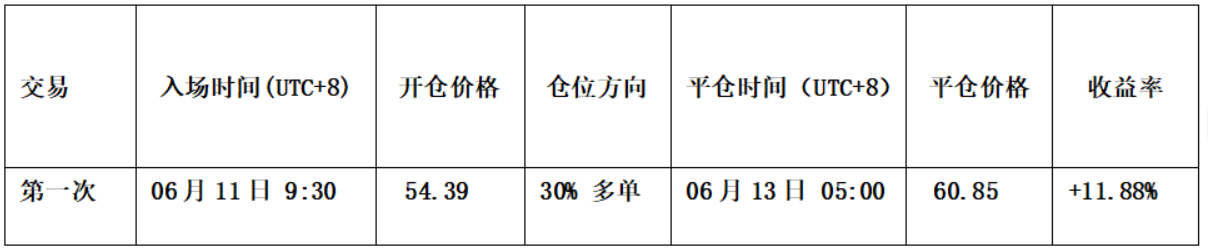
• Short-term trading effectiveness of HYPE: Executed a short-term long position (1x leverage) last week, achieving a return of approximately 11.88%. (Details in Table One)
• Market validation of BTC trend forecast: In last week's article, it was pointed out that after briefly breaking below the $60,000 mark, the price found support and would initiate a short-term rebound to confirm the effectiveness of breaking an important position. The current market trend validated our previous forecast.
• Market validation of HYPE trend forecast: In last week's article, it was noted that when HYPE's price tested the key support area of $55-$57, showing signals of stabilizing and stopping the decline, along with strong bottom signals triggered by two significant models, one could consider lightly going long. The current market trend highly aligns with our forecast view.
1. In-depth analysis of Bitcoin's hour-level trend structure
Bitcoin _4 hour K-line chart
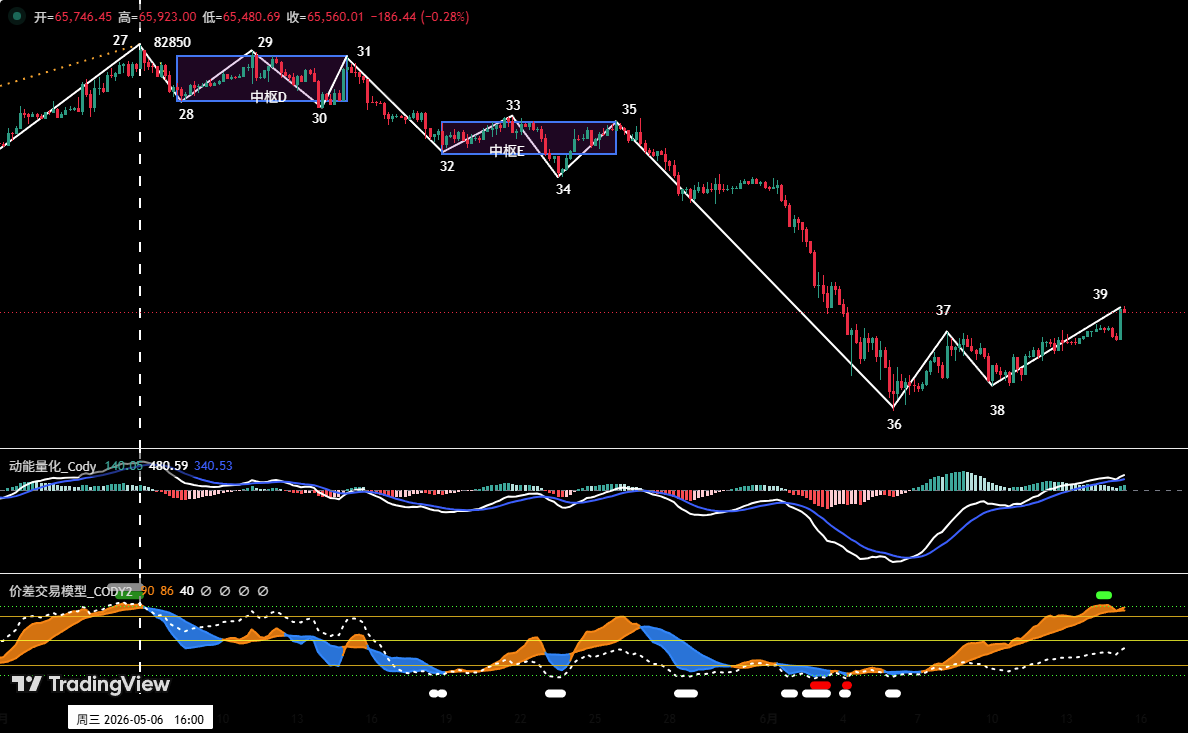
Figure One
① As shown in (Figure One), since the adjustment from the high of $82,850 on May 6, it can be subdivided into a 12-segment adjustment structure on the 4-hour chart. This includes two descending midpoints: midpoint D and midpoint E. The overall structure is clear, presenting a typical complex adjustment format.
② From the 4-hour trend structure, we are currently operating on the 38-39 segment rebound. The current coin price has stood above $65,000. If the subsequent confirmation of the breakout is effective, then the next important resistance level will be in the $69,500–70,500 area.
2. BTC trend forecast and operational strategies for this week
1. BTC trend forecast for this week:
This week's core view: Pay attention to the outcome of the pullback confirmation after the coin price breaks through $65,000.
• If the pullback is lost, the market may retest the core support range of $60,000–$62,000.
• If it stabilizes effectively, it will challenge the core pressure area of $69,500–$70,500. This position will be an important area for planning mid-line short positions.
2. Core pressure levels:
• First pressure area: $69,500–$70,500 (previous heavy transaction area)
• Second pressure area: $72,500–$74,500 (previous heavy transaction area)
3. Core support levels:
• First support level: Around $65,000
• Second support level: $59,000–$60,000 area (previous important support level)
• Third support level: Around $55,000 (previous important support level)
4. Operational strategies for this week (excluding sudden news impacts)
① Mid-line strategy:
Bitcoin _ Daily K-line chart: (Position monitoring model)
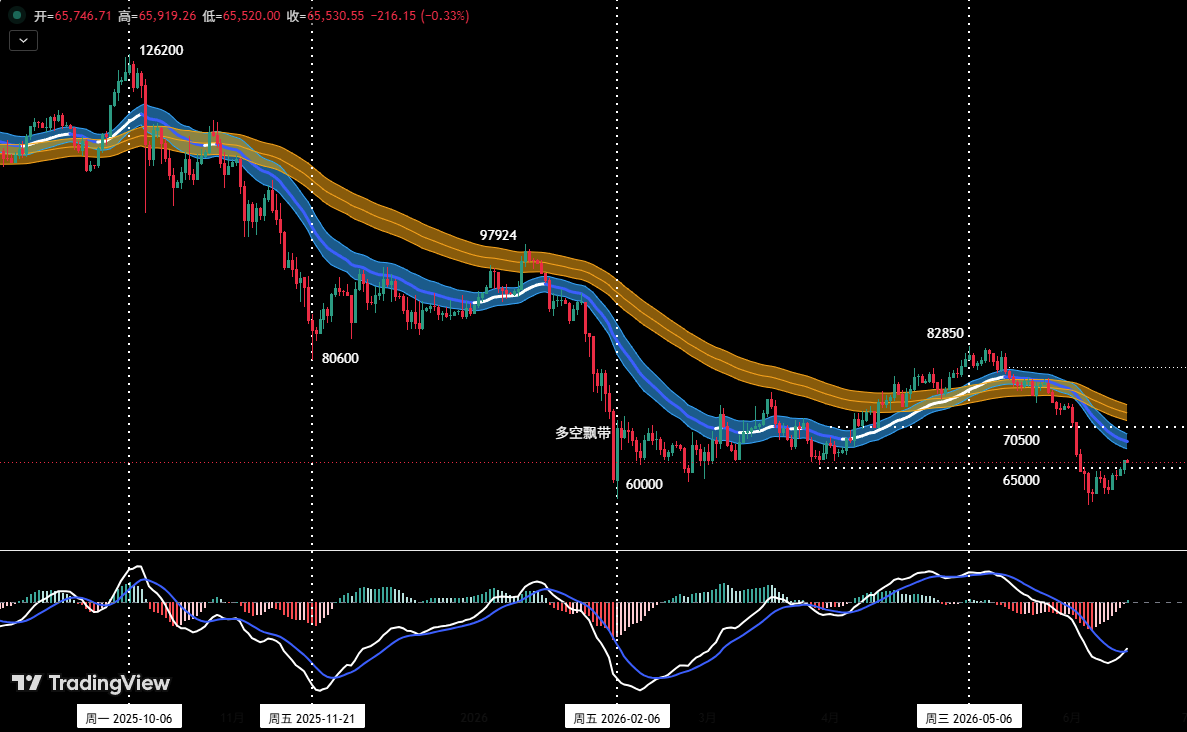
Figure Two
Position monitoring model: As shown in (Figure Two), the current coin price has effectively broken below the "long-short channel," the technical pattern has shifted into a bearish dominant pattern. Last week's market did not meet our planned layout (short position), thus mid-line positions are temporarily kept empty.
This week, based on the outcome of the long-short competition concerning $65,000, positions can be gradually built based on the following three-tier strategies:
•Increase in strong resistance area: If the coin price successfully stabilizes in the $65,000 area, and if a subsequent rebound to the $69,500–$70,500 area shows clear signs of pressure, one may consider mid-line (short position) layout, controlling total positions below 60%.
• Following breakouts to sell short: If the coin price loses $65,000 support and shows effective breakout signals, one may initially establish a 30% mid-line short position.
•Chasing the short upon breakdown: If the coin price loses $65,000 support and effectively breaks below the $59,000–$60,000 support range, additional short positions may be added, controlling total positions below 60%.
② Short-term strategy: Using a 30% position, set stop-loss points, look for "arbitrage" opportunities based on support and resistance levels. (Using 30 minutes/60 minutes as the trading cycle).
③ In short-term operations, to dynamically respond to the complex market evolution, we have prepared two specific operational plans A/B in advance.
•Plan A: Establish positions in strong resistance areas.
• Opening positions: If the coin price successfully stabilizes in the $65,000 area, if a subsequent rebound to the $69,500–$70,500 area shows signs of stagnation, combined with top signals from quantitative models, one may layout short positions below 30%.
• Risk control: Set initial stop-loss levels.
• Closing positions: When it adjusts near important support levels and combines with model signals, one may gradually liquidate for profit-taking.
•Plan B: Effectively breaking below support, short accordingly.
• Opening positions: If the coin price loses $65,000 support and presents effective breakdown signals, one may establish short positions below 30%.
• Risk control: Set initial stop-loss levels.
• Closing positions: When it falls to important support levels and combines with model signals, one may gradually liquidate for profit-taking.
3. HYPE hour-level trend structure analysis
HYPE _4 hour K-line chart
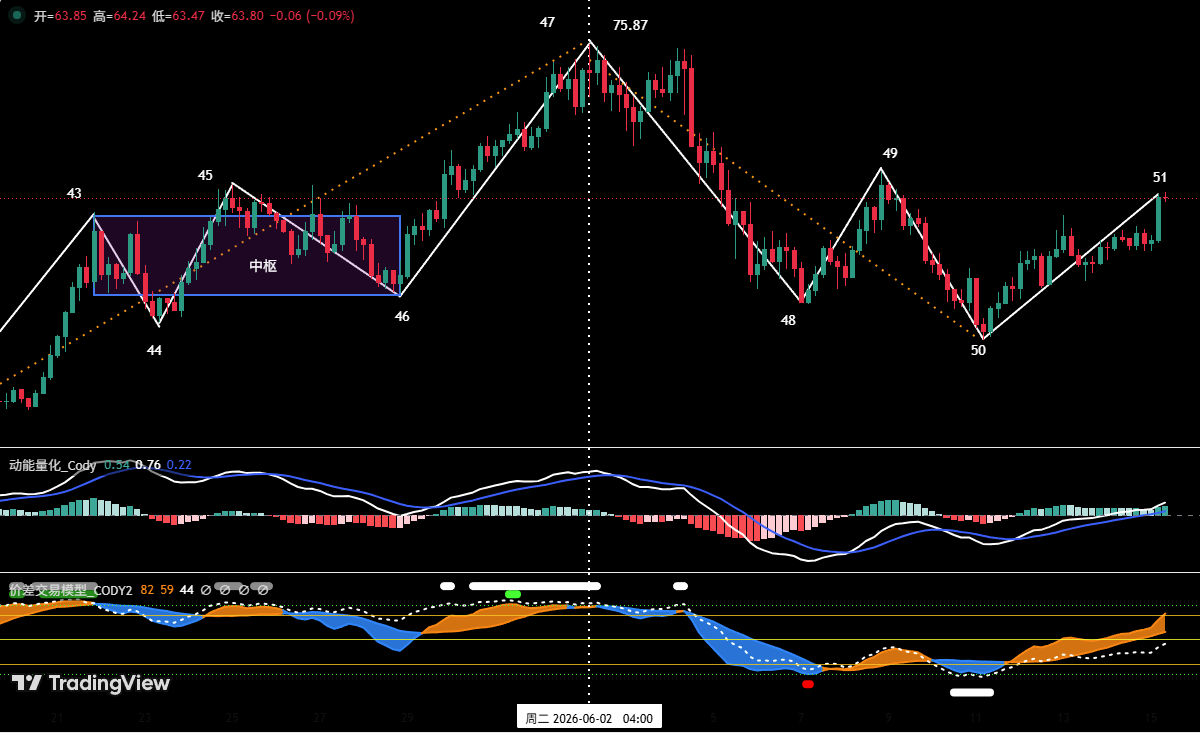
Figure Three
1. As shown in (Figure Three), within the 4-hour cycle, HYPE has been subdivided into a four-stage adjustment structure since the high of $75.87 on June 2. This includes segments (47-48), (48-49), (49-50), (50-51).
2. Currently, the HYPE price is stabilizing and rebounding in the $52 support area, and is in the rebound process of segment (50-51). The pressure above is in the $62.5 to $64.57 area. If a high is formed at this area (the probability of constructing a "descending midpoint" at this location is quite high), the price will continue to search for strong support downward.
4. HYPE trend forecast and short-term operational strategy for this week
1. HYPE trend forecast for this week:
① Core pressure levels:
• First pressure level: $62.5–64.57 area;
• Second pressure level: $68–70 area;
② Core support levels:
• First support level: $52–55.5 area;
• Second support level: $47–49 area;
The core view on HYPE this week:
• Observe the pressure effect in the $62.5–64.57 area and the location of the price peak when "endpoint 51" is formed.
2. HYPE short-term operational strategies for this week: (Go long at support)
This week's HYPE short-term trading should follow the strategy of "layout when low, avoid chasing high."
Short-term strategy: Stabilizing in the support area, try to go long
When the HYPE price tests the key support area of $52–54.5 or deeper at $47–49, and shows stopping decline and stabilizing signals, combined with bottom signals triggered by two major models, one may consider lightly trying to go long, with risk controlling position at 30% or below, strictly adhering to stop-loss discipline.
5. HYPE trading review
1. Review of short-term operations: (See Table One)
We strictly followed the operational plan, and based on self-constructed "arbitrage trading model" and "momentum quantitative model" signals, executed a short-term (long position) operation last week, making a profit of 11.88%.
2. Summary of HYPE short-term trading details: (Leverage * 1 time)
3. Review of short-term trading: (See Figure Four)
① Opening strategy:
• A relatively complete downward adjustment structure had been running earlier;
• The self-constructed "arbitrage trading model" had sent a strong bottom warning signal in advance (red points, white points in the chart);
• The self-constructed "momentum quantitative model" had sent a signal of momentum divergence at the bottom;
Based on these three points, we opened a long position of 30% near $54.39.
② Closing strategy:
• When the price rose to around $62.5 and showed resistance signals;
• The self-constructed "arbitrage trading model" had sent a top warning signal earlier (white point in the chart);
• The self-constructed "momentum quantitative model" had sent a signal of momentum divergence at the top;
Therefore, we liquidated all positions near $60.85.
③ Summary: This trade successfully made a profit of about 11.88%.
HYPE _30 minute K-line chart: (Momentum quantitative model + arbitrage trading model)
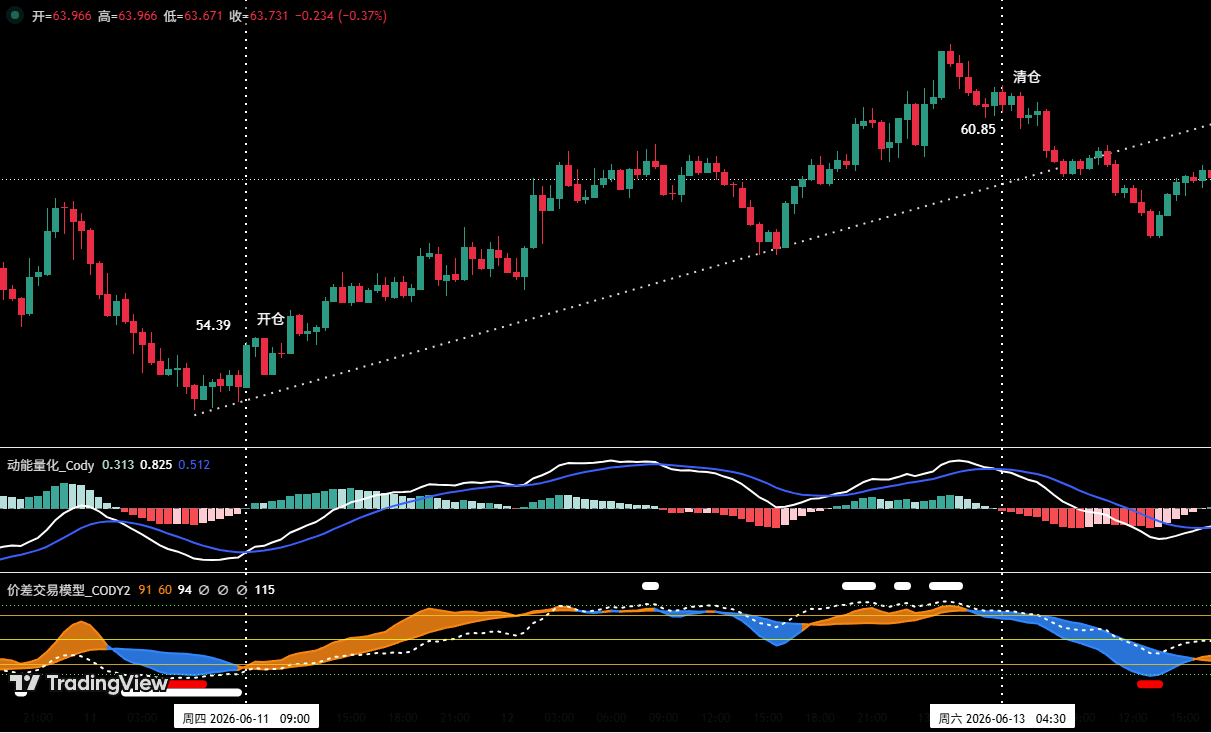
Figure Four (Short-term trading illustration)
6. Special reminder:
1. When opening positions: Immediately set initial stop-loss levels.
2. When profits reach 1%: Move the stop-loss level to the opening cost price (breakeven point) to ensure capital safety.
3. When profits reach 2%: Move the stop-loss level to the position of 1% profit.
4. Continuous tracking: Thereafter, for every additional 1% profit, the stop-loss level will move up by 1% to dynamically protect and lock in profits.
The financial market is ever-changing, and all market analysis and trading strategies need dynamic adjustments. All views, analysis models, and operational strategies discussed in this article are derived from personal technical analysis, intended solely for personal trading logs and should not be construed as investment advice or operational basis. The market has risks, and investments should be made cautiously; please do not make decisions based on this.
免责声明:本文章仅代表作者个人观点,不代表本平台的立场和观点。本文章仅供信息分享,不构成对任何人的任何投资建议。用户与作者之间的任何争议,与本平台无关。如网页中刊载的文章或图片涉及侵权,请提供相关的权利证明和身份证明发送邮件到support@aicoin.com,本平台相关工作人员将会进行核查。


