Cryptocurrency Expert: On June 12, Ethereum's major cycle headed south and firmly controlled the market, with rebounds merely providing shorting opportunities! Latest market analysis and operational suggestions.
The current price of Ethereum is 1650. A small rebound has occurred, and after the correction, the downtrend is likely to continue. When the market is unclear, it's better to stay in cash and observe rather than force oneself into the market to speculate. Especially for retail investors like us, after high-point traders adjust their positions northbound, those who need to exit should do so first. Each pullback provides an opportunity for everyone. The daily and 4-hour dual indicators clearly show a southbound trend, and the rebound space is tightly locked by moving averages and Fibonacci levels, making it difficult to break through the 1730 barrier easily.
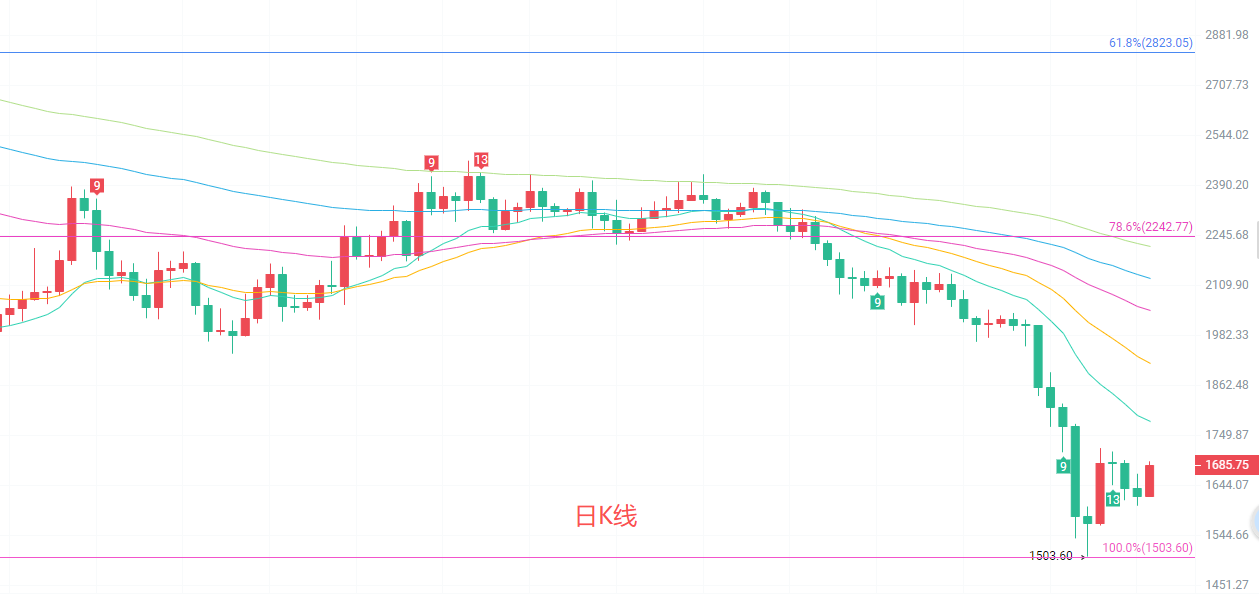
The daily candlestick chart is overall in a major downtrend, with the price far below the 15, 30, 60, 90, and 120 EMA moving averages, indicating strong downward pressure. The complete Fibonacci down wave from the high point of 4957 to the low of 1503 has currently only touched the 0% upper low range, with the 78.6% strong resistance level at 2242 that is fundamentally unlikely to be reached in the short term. The MACD indicator shows a continuing downward green column with no obvious bullish divergence reversal signal. The Bollinger Bands channel continues to narrow down, with the price running close to the lower boundary. The daily rebound is merely a minor correction on the way down, and the major southward trend remains unchanged, with each rise providing a high shorting opportunity.
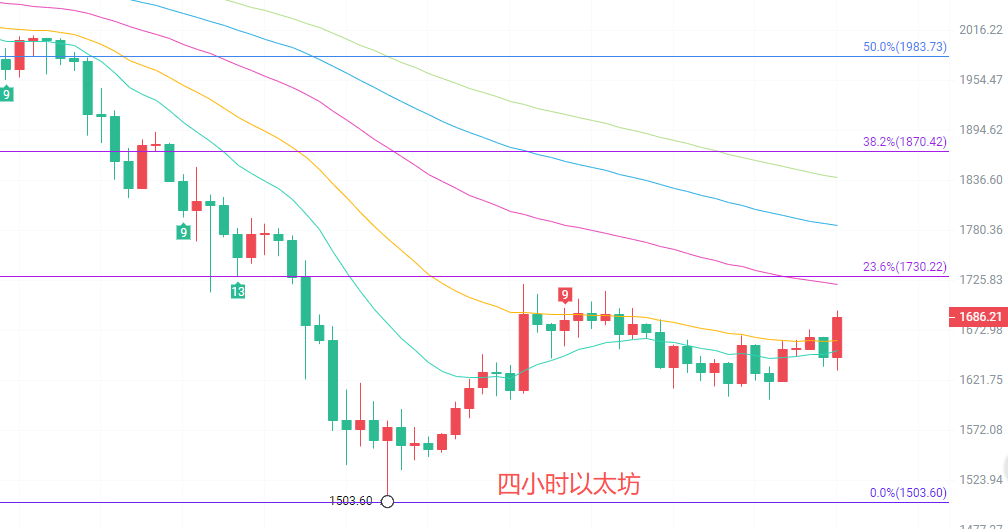
The 4-hour candlestick chart shows that after the previous significant drop to a low of 1503, a wave of corrective rebound has emerged. The price is still under pressure below the EMA 15, 30, 60, 90, and 120 moving averages, all of which are diverging downward, and the medium-term downward structure remains unchanged. The Fibonacci levels from the high point of 2463 to the low point of 1503 show the 23.6% resistance level at 1730 is the first major resistance. The MACD has shown a slight golden cross with increased red columns, indicating a technical rebound after an oversold condition; the Bollinger Bands have narrowed, with the price fluctuating below the middle track. The 4-hour rebound is limited, facing successive resistance from the moving averages above, and there is insufficient northbound momentum to reverse the downward trend. After a rise, further selling pressure will likely return.
Short-term references:
For the upward range of 1720 to 1750, go short with a stop-loss at 1800, targeting 1650 to 1550.
For the downward range of 1600 to 1550, go long with a stop-loss at 1500, targeting 1650 to 1720.
Specific operations should rely on real-time market data. For more details, please consult the author. There may be delays in publishing this article; the advice is for reference only, and risks are to be borne by the reader.

Reminder: The above content is solely created by the author’s official account. Any advertisements at the end of the article or in the comments section are not related to the author; please be cautious in identifying them. Thank you for reading.
免责声明:本文章仅代表作者个人观点,不代表本平台的立场和观点。本文章仅供信息分享,不构成对任何人的任何投资建议。用户与作者之间的任何争议,与本平台无关。如网页中刊载的文章或图片涉及侵权,请提供相关的权利证明和身份证明发送邮件到support@aicoin.com,本平台相关工作人员将会进行核查。