Cryptocurrency Expert: On June 11, Ethereum's MACD and Bollinger Bands resonate downwards, comprehensive analysis of support and resistance for the future market! Latest market analysis and operation suggestions.
Ethereum's current price is 1650, and the daily line is strongly pressing down. Many friends are stuck in long positions, refusing to acknowledge losses, continuously adding positions to average their costs, resulting in their principal being continually consumed like a frog in boiling water. That small short-term rebound cannot change the major downward structure; many people always feel that stopping loss means losing money. In fact, stopping loss is a firewall to protect the principal; holding positions is the bottomless pit. Controlling your hands is much more important than frequent operations, or like me, always short when prices are high, it’s necessary to maintain a stable mindset to survive long in the market.
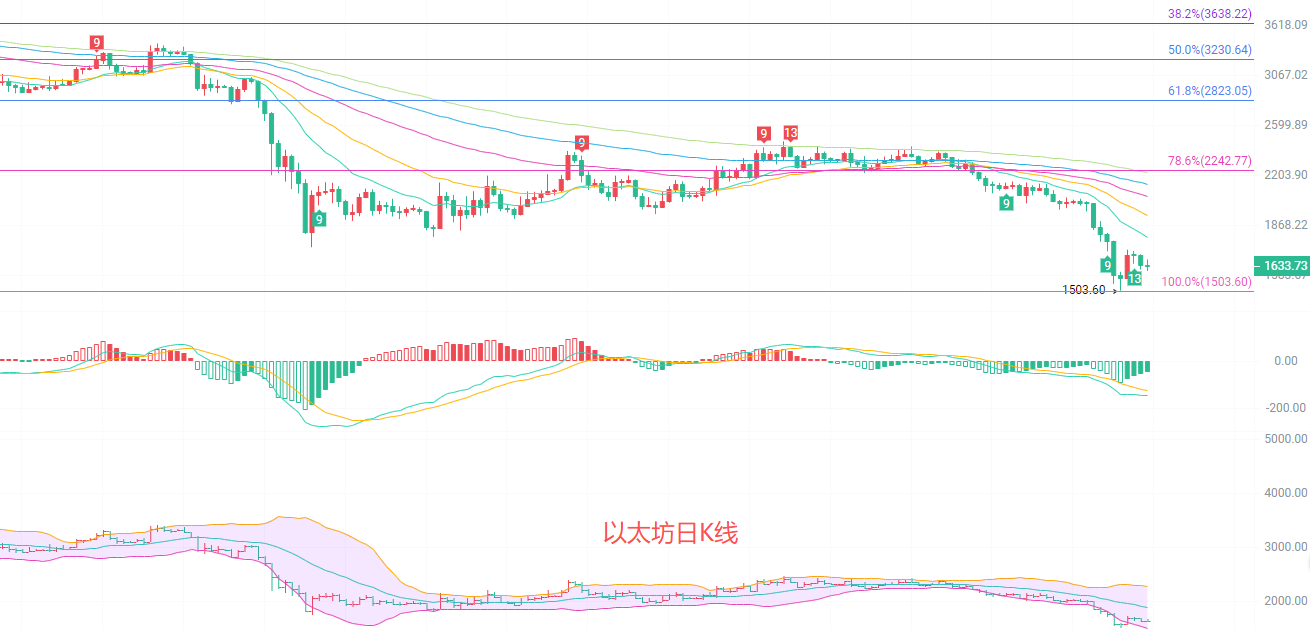
The overall daily K-line is in a deep downward channel. The moving average system is all aligned downwards; the 15, 30, 60, 90, and 120 period EMA layers are pressing down on the price. The first level of resistance above is 1793, with a strong pressure point at 2242. The Fibonacci 100% support is at 1503, and today’s low of 1605 still has some space from the support. The MACD on the daily line maintains green bars with increasing volume; the DIF and DEA double lines continue to move downwards, with no decay in downward momentum. The Bollinger Bands are opening downwards, and the price is running closely to the lower band, with the middle band at 1889 forming strong resistance. There are no signals of a stop or reversal on the daily level; any rebounds can only be defined as minor corrections in the downward process, and the overall trend downwards firmly controls the market.
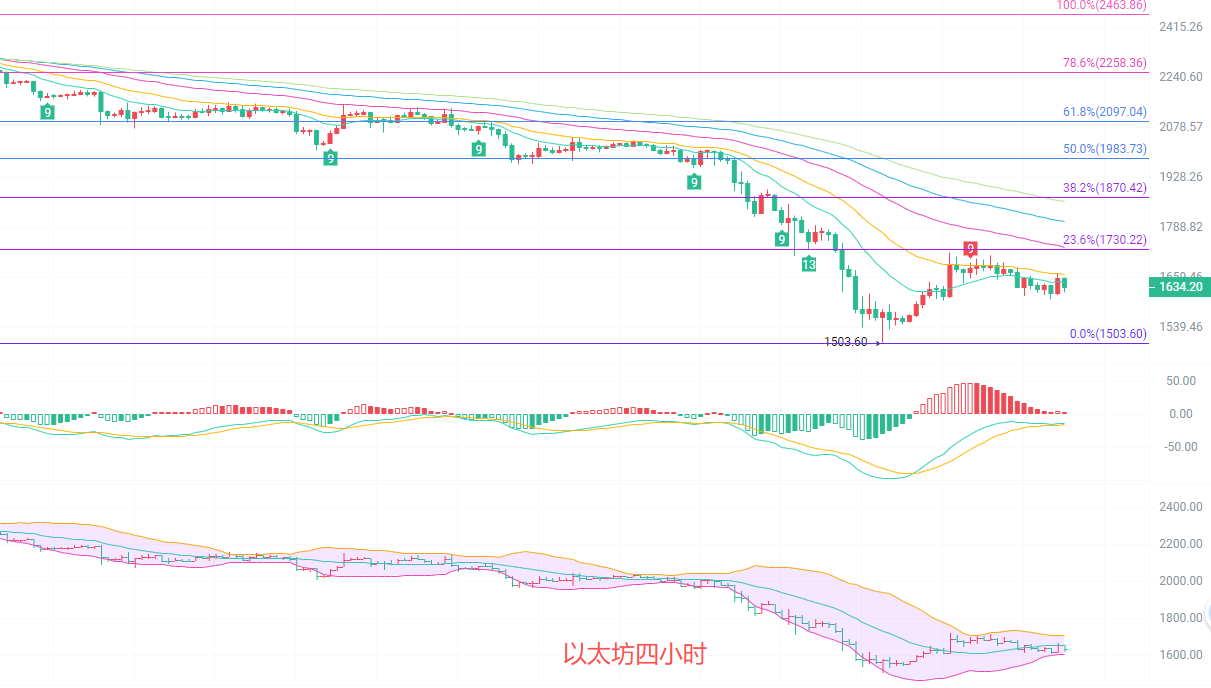
The four-hour K-line trend is also weak, with a current price of 1626. The short-term EMA moving averages show clear downward pressure, with the 15-period moving average at 1660 and the 30 moving average at 1682 firmly capping the rebound space. The Fibonacci 0% low is at 1503, with 23.6% pressure at 1730, making it very difficult for a short-term rebound to break through this level. The MACD on the four-hour chart has a slight golden cross, with weak red bars showing increasing volume, indicating a slight short-term correction is needed, but overall, the double lines remain below the zero axis and are considered a weak rebound in a downward trend. The Bollinger Bands are contracting and leveling off, with prices stuck in the middle-lower band range; the lower band at 1606 is the first short-term support, and once broken, it will directly retest the low of 1503. The strength of the four-hour rebound is limited and does not change the overall bearish structure.
Short-term reference:
Short positions between 1720 and 1750, stop loss at 1800, target looking at 1650 to 1550.
Long positions between 1600 and 1550, stop loss at 1500, target looking at 1650 to 1720.
Specific operations should be based on real-time market data. For more information, you can consult the author. There may be a delay in publication, advice is for reference only and risks are borne by you.

Friendly reminder: The above content is solely created by the author of the public account. Ads at the end of the article and in the comment area are unrelated to the author, please discern carefully. Thank you for reading.
免责声明:本文章仅代表作者个人观点,不代表本平台的立场和观点。本文章仅供信息分享,不构成对任何人的任何投资建议。用户与作者之间的任何争议,与本平台无关。如网页中刊载的文章或图片涉及侵权,请提供相关的权利证明和身份证明发送邮件到support@aicoin.com,本平台相关工作人员将会进行核查。


