Bitcoin has plummeted from the peak of 77398 on May 26, experiencing a sharp decline for two weeks. On June 6, it hit a bottom of 59087 USD, marking its deepest drop since February 2026. This morning at 9 am, Bitcoin was oscillating at a low of 62569, with a 24-hour decline of about 1.21% and a 24-hour trading range between 64200-62408. Ethereum also displayed weakness in sync, with a quote of 1670 at the time of writing, having evaporated over 20% from the May 26 high of 2126, and at one point in the week, it dipped to a low of 1522. Market sentiment has plunged into an ice valley, and rebound momentum remains weak.
This decline is not without signs. Multiple bearish factors have simultaneously triggered the market; since its listing in 2024, the net outflow from the US Bitcoin spot ETF reached up to 3.4 billion USD in just one week last week, setting a historical record. The cumulative outflow has continued for 13 trading days, amounting to 4.33 billion USD, showing clear signs of institutional selling.
The market has continuously revised down its expectations for the Fed's interest rate cuts in 2026, and the tightening liquidity forecast suppresses risk assets. The year-on-year increase of April's CPI reached 3.8%, raising market concerns that if the CPI for May, to be announced on June 10, exceeds expectations again, the Fed's hawkish stance could be further solidified, possibly increasing pressure on the cryptocurrency market. The next key milestone: the FOMC interest rate decision will take place on June 17, and the policy direction will directly affect the subsequent market.
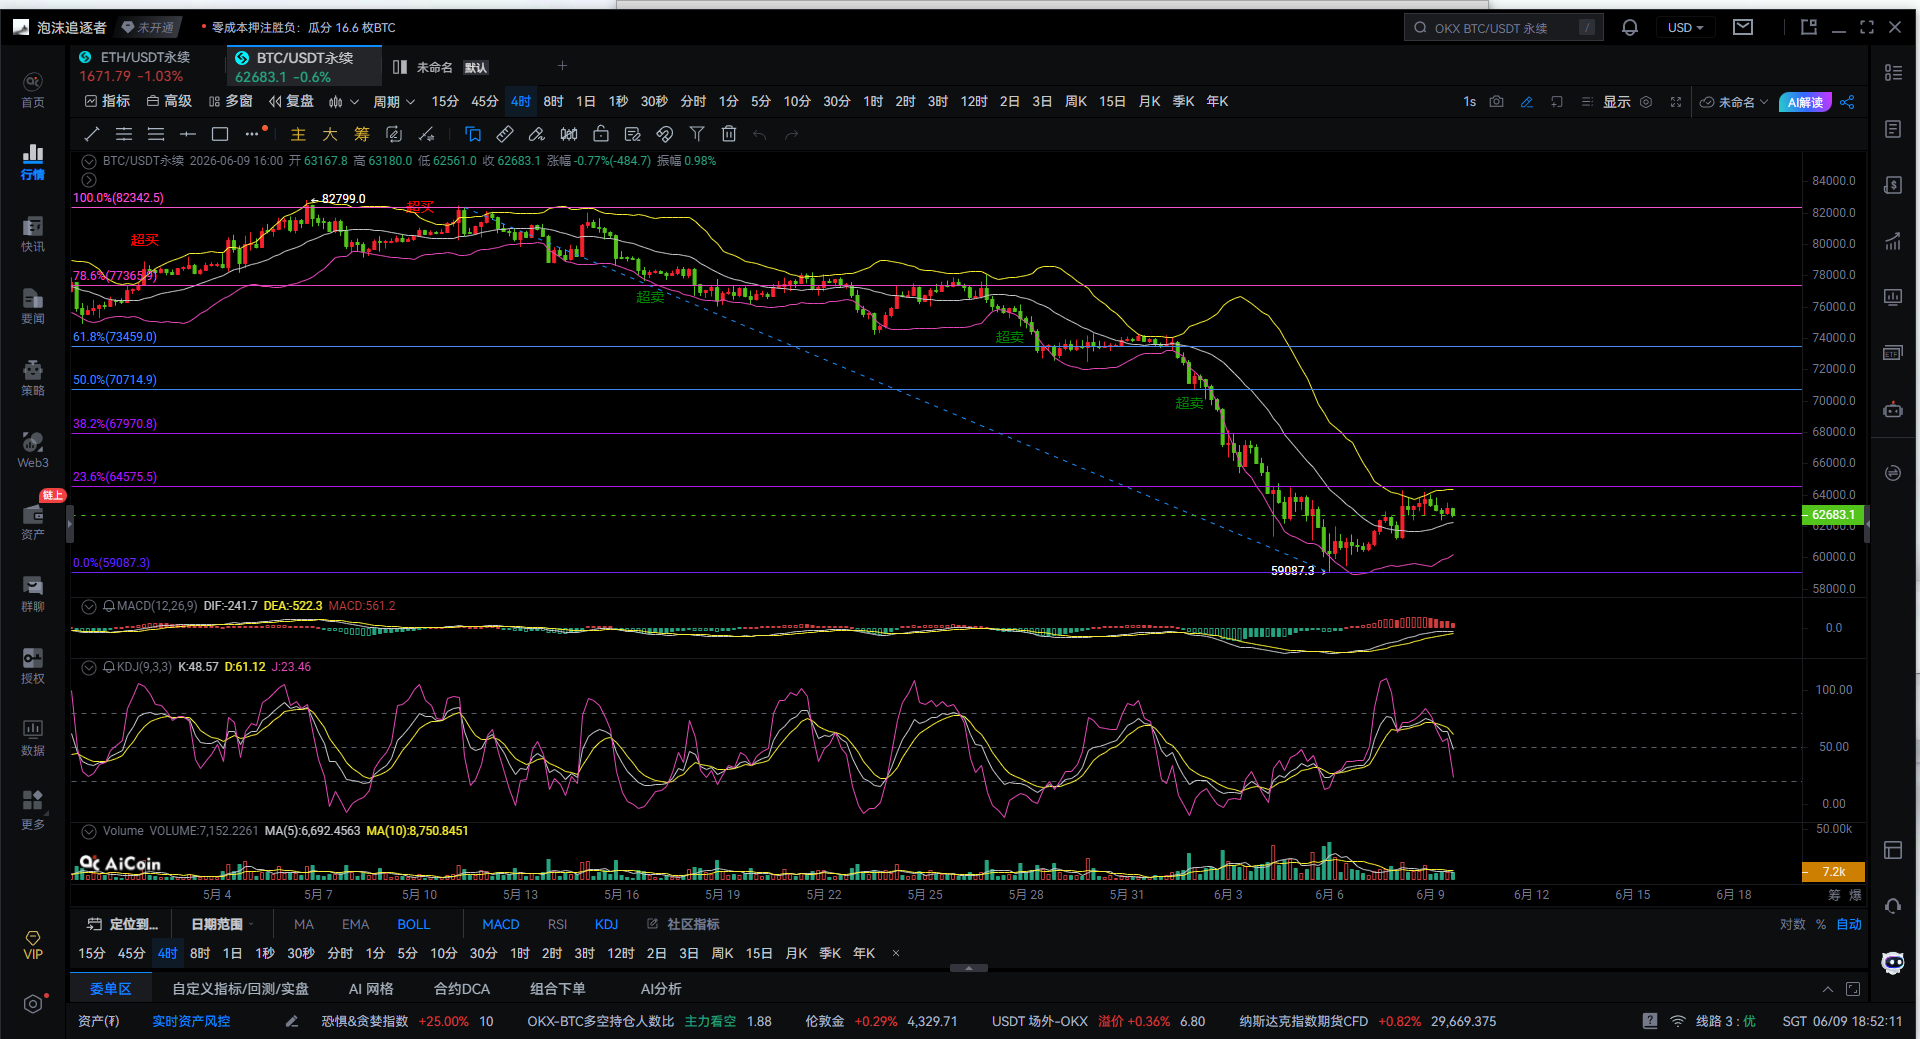
Four-hour chart of Bitcoin
There’s not much to say; in yesterday's article, it was mentioned that if it doesn’t stabilize above 64500, go short. It was also noted that the highest price so far has reached 64200, and I believe those who read the article managed to profit a little from this correction. Today, let’s discuss this briefly.
From the four-hour chart of Bitcoin, the market previously plummeted from a high of 82799 to a low of 59087, followed by a significant oversold rebound, and the price is now hovering around 62600. Our focus now is not on rushing to chase the price up but rather understanding if this rebound is a true reversal or just a minor episode within the downtrend.
First, regarding the MACD, it currently shows several signals: the DIF line is still below the DEA, and even though there are still red momentum bars, they are beginning to shorten. This indicates that the bearish trend hasn’t completely subsided, but the short-term rebound has been ongoing for a while. Typically, this suggests that the first wave of rebound has completed, and the market is about to choose a direction. If the red columns continue to shorten, or a death cross appears, the chances of the rebound ending increase significantly.
Now looking at the KDJ, the K value is 48, the D value is 61, and the J value has dropped to around 23. After previously rallying to a high, it has begun to turn downward, indicating that the short-term bullish momentum is weakening. Based on experience, the next 1 to 3 four-hour candles are particularly critical; if the KDJ continues to move downward, it will likely trigger a pullback.
Looking at the Bollinger Bands, the price has reestablished itself around the upper and lower bands, moving towards the middle band, but the upper band is clearly moving downward. This indicates that it is merely a corrective action within a downtrend. To truly reverse and gain strength, it has to first stabilize above 64000 and wait for the middle band to turn upwards, and for the upper band to reopen. Until then, I prefer to view the current situation as a rebound market.
Next, let's look at the Fibonacci levels. From 82799 to 59087, the key pressure points for the rebound are 23.6% at 64575, 38.2% at 67971, 50% at 70715, and 61.8% at 73459. The current price is 62683, very close to the first resistance at 64575.
The author believes there are a few possible price movements ahead. First, it’s likely that it will encounter resistance near 64500 (which has already been tested yesterday) and then pull back to 62000 or 61000 for a secondary confirmation, after which we can consider if it can push towards 68000. Second, if it breaks through 64575 and maintains a four-hour closing above it, it will open up space to 68000 or even 70700, signifying that the market has genuinely entered a mid-term recovery phase. Third, if it falls below 61000, it would indicate that this wave of rebound has ended, and we will need to reassess the former low at 59087, or even lower.
The author predicts that Bitcoin's four-hour chart is currently in a technical rebound after an oversold condition but has entered the first resistance zone, with 64575 being the dividing line for short-term bulls and bears. The MACD rebound momentum is weakening, the KDJ shows signs of a downward turn, and the Bollinger middle band is clearly exerting pressure, so it is not appropriate to blindly chase long positions now. The focus going forward should be on whether the upper 64575 can be broken and whether the lower 61000 can hold. Breaking 64575 gives the chance to reach 68000; dropping below 61000 will likely lead to a retest of the 59000 area. The current phase seems more about waiting for a pullback to find opportunities rather than chasing high positions.

As for the operational thoughts, there’s no need to elaborate; just refer to yesterday’s article. PS: I forgot to change the time of writing yesterday; please forgive me!!!
Rather than giving you a hundred percent accurate advice, it's better to provide you with a correct mindset and trend. Teaching a person to fish is better than giving them fish. Advice allows for short-term gains, but learning the right approach gives lifelong benefits!
Time of writing: (2026-06-09, 18:50)
(Written by - Author Says Currency) hereby states: The online publication may have delays; the above advice is for reference only. Investment carries risks, and one should proceed with caution when entering the market!
免责声明:本文章仅代表作者个人观点,不代表本平台的立场和观点。本文章仅供信息分享,不构成对任何人的任何投资建议。用户与作者之间的任何争议,与本平台无关。如网页中刊载的文章或图片涉及侵权,请提供相关的权利证明和身份证明发送邮件到support@aicoin.com,本平台相关工作人员将会进行核查。