Cryptocurrency Expert: Is the 6.9 Ethereum Oversold Rebound Just a Buffer? The Daily Downward Structure is Locked! Latest Market Analysis and Trading Suggestions
Ethereum is currently priced at 1630, and the daily chart shows a significant downward trend ahead, so do not harbor fantasies about a major bottom. The short-term rebound looks promising, but in reality, it is just to provide better entry points for further declines. Those holding spot positions should maintain a calm mindset; the bottom consolidation needs time, so invest gradually; those trading contracts must remember that stop-loss is a lifeline; small losses and big gains are the logic for long-term profitability. The market is not short of opportunities; what it lacks are those who can uphold discipline, see trends clearly, and patiently wait for the best entry points, which is much more reliable than frequently making trades.
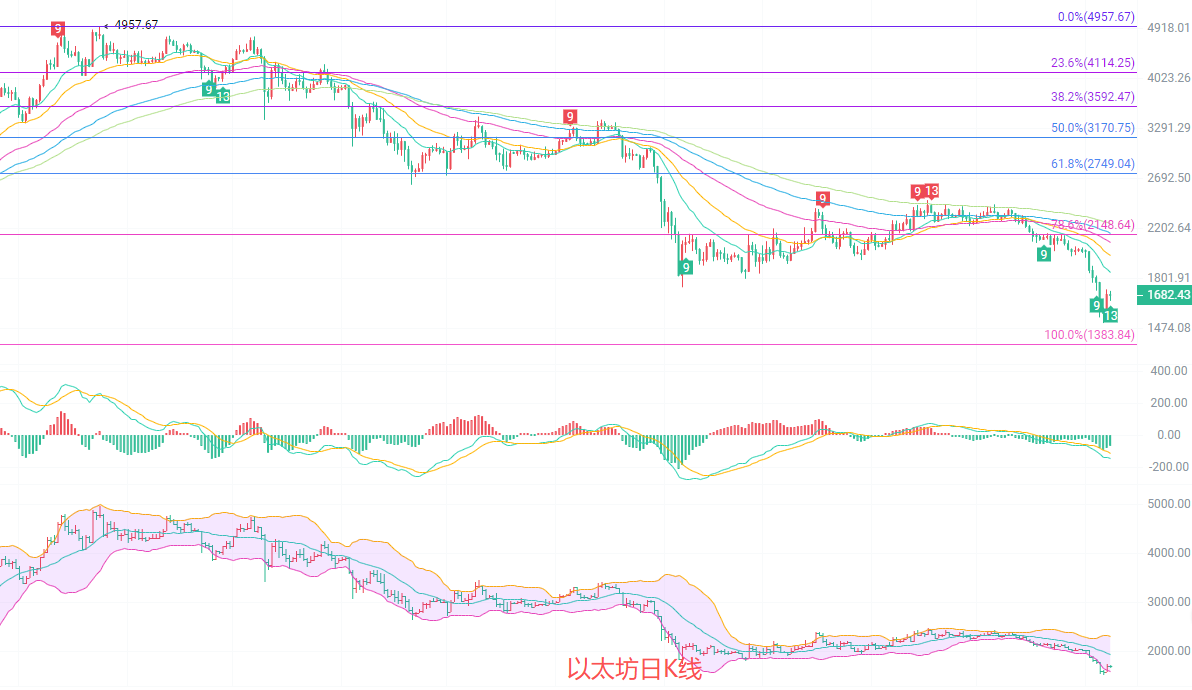
The daily K-line is overall in a deep downward trend, with the price firmly under pressure from all moving averages. The 15/30/60-day moving averages are all diverging downwards, forming a strong resistance zone. The Fibonacci full segment has completed a 100% drop to find support above 1383, with the first resistance above at the 78.6% level of 2148. The daily MACD maintains a death cross, with both DIF and DEA lines continuously moving downwards, and there is no significant decrease in downward volume; the Bollinger Bands are opening downwards, and the price is running closely along the lower Bollinger band. The larger cycle downward trend shows no signs of reversing, and any rebound at this stage can only be defined as a correction in the process of decline, with the main downward direction remaining unchanged.
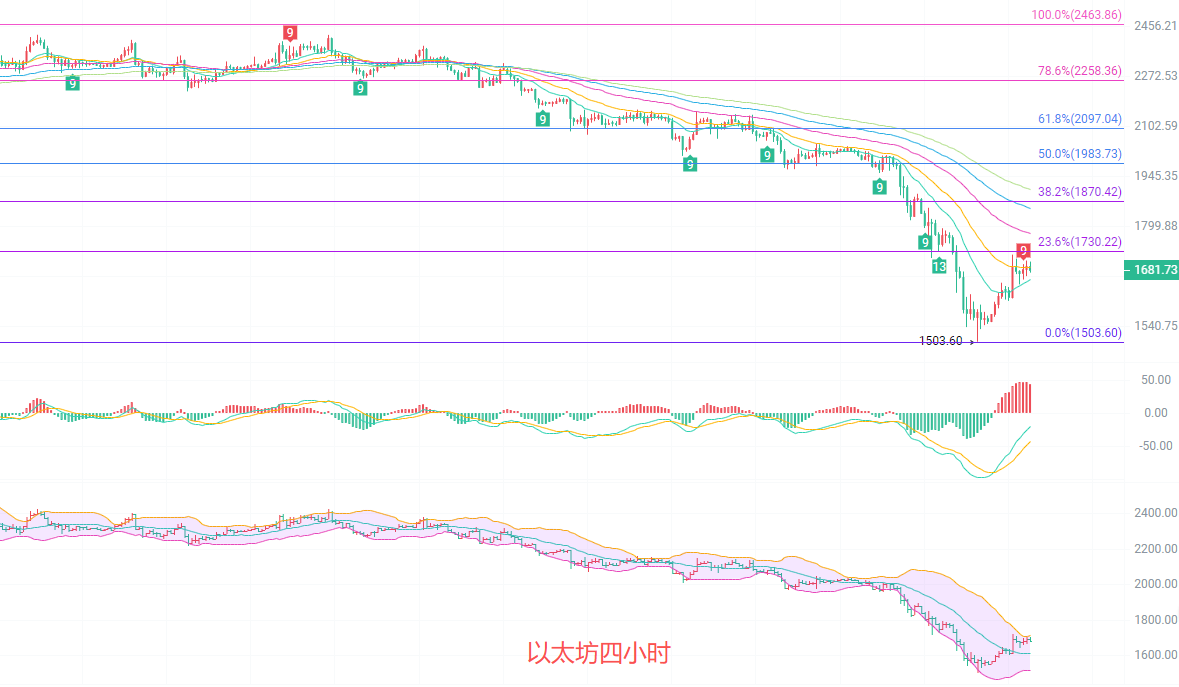
The four-hour K-line has seen a slight rebound recovery from the recent low of 1503, with the price standing above the 15-day moving average at 1656. However, the 30/60/90-day long-term moving averages still press down, and the rebound space is limited layer by layer. The Fibonacci 0%-23.6% resistance level at 1730 is the first hurdle, and only by breaking through can one see resistance near 1870. The 4-hour MACD has formed a golden cross, with red upward bars increasing in volume, indicating short-term rebound momentum; the Bollinger Bands are closing, and the price is fluctuating below the middle line, belonging to a technical rebound after an oversold condition, not a trend reversal. Once the rebound touches the upper moving average pressure, the downward selling pressure can easily push the price back down.
Short-term Reference:
When the price is between 1720 and 1750, enter short, stop loss at 1800, target 1650 to 1550
When the price is between 1600 and 1550, enter long, stop loss at 1500, target 1650 to 1720
Specific operations should be based on real-time market data; for more information, you can consult the author. There may be delays in the publication of this article; it is suggested for reference only, and risks are to be borne by the individuals.

Warm Reminder: The above content is solely created by the author on Weibo. The ads at the end of the article and in the comments section are not related to the author. Please discern cautiously, thank you for reading.
免责声明:本文章仅代表作者个人观点,不代表本平台的立场和观点。本文章仅供信息分享,不构成对任何人的任何投资建议。用户与作者之间的任何争议,与本平台无关。如网页中刊载的文章或图片涉及侵权,请提供相关的权利证明和身份证明发送邮件到support@aicoin.com,本平台相关工作人员将会进行核查。