Last week we clearly pointed out in the weekly report that $60,000 is a relay node in this round of adjustment rather than the bottom - this judgment was directly validated by the market on June 5: the coin price dropped below this level, hitting a low of $59,100. Thus, the monthly level a-b-c three-wave adjustment structure established since the high of $126,200 in October 2025 has been fully confirmed, and it is currently in the down phase of wave c, with the cumulative adjustment time being less than 35 days, and the structure is far from complete.
This week we will focus on tracking the height of the rebound and the performance under pressure: The two major pressure zones at $65,000 and $69,500–70,500 will be the core observation windows to judge the subsequent trend.
In terms of HYPE, last week’s warning of a top signal was also validated, with the price retreating up to 27% from $75.87. This week enters the short-term layout phase in the support area. From a strategic perspective, we maintain a bearish outlook for the medium term, waiting for a suitable window to add positions after the rebound is complete.
This week's core trading viewpoints summary:
• BTC multi-cycle trend structure analysis (detailed explanation in the first part)
• BTC trend prediction and medium, short-term trading strategies for this week (detailed explanation in the second part)
• HYPE hourly level trend structure analysis (detailed explanation in the third part)
• HYPE trend prediction and short-term trading strategies for this week (detailed explanation in the fourth part)
Last week's trading strategy and core viewpoints market validation:
• BTC market trend prediction validation: In last week's article, we pointed out that Bitcoin would maintain a weak rebound and continue to decline, with the short-term strategy centered on “shorting on highs.” The current market trend has validated our previous viewpoint.
• HYPE market trend prediction validation: In last week's article, we pointed out that HYPE faces multiple resistances around $75.87, where the probability of forming a short-term top is high. The current market trend closely aligns with our predicted viewpoint.
1. Bitcoin Multi-Cycle Trend Structure Analysis
BTC Daily Level Trend Structure Analysis: (Based on the market after the low on February 6, 2026)
Bitcoin _ Daily K-line Chart: 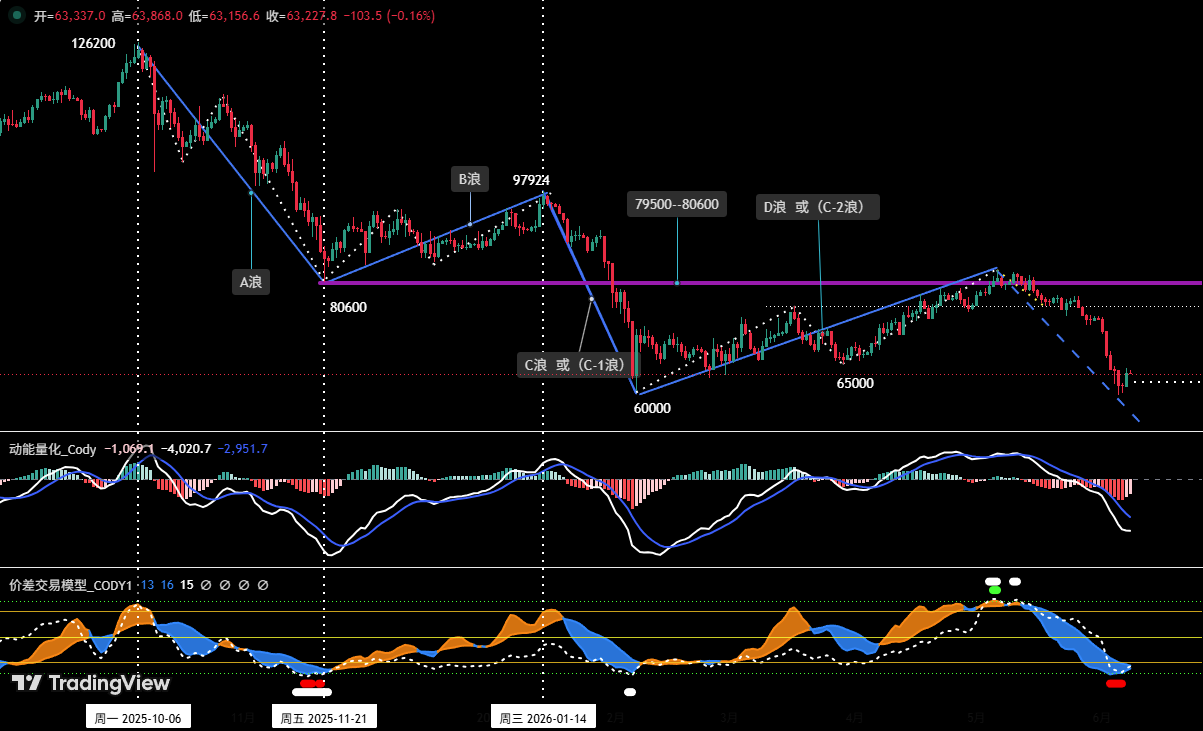
Figure One
1. Dynamic analysis of Bitcoin market structure based on wave theory: (Re-examining key turning points since the adjustment from the October 2025 high)
As shown in (Figure One), after reaching a historic high of approximately $126,200 in October 2025, the Bitcoin market entered a deep adjustment phase. By early February 2026, after reaching a low of $60,000 on February 6, the price subsequently entered a rebound phase lasting about 90 days. During this period, there was intense discussion in the market about whether "$60,000 is the end of this adjustment or a relay low." Our analysis has consistently favored the latter, determining it as a temporary low rather than an endpoint, since the rise starting on February 6 belongs to a rebound within a large adjustment structure, rather than a trend reversal, and subsequent adjustments are expected to drop below the $60,000 mark.
Below is a review of the evolution based on technical analysis frameworks:
① Initial qualification (mid-February): Corrective rebound in wave C (i.e., C-2 rebound wave)
In the analysis from the week of February 16, we clearly pointed out that the bullish trend initiated from the low on February 6 is essentially a “C wave” internal “C-2 wave” oversold rebound, followed by a “C-3 wave” adjustment trend where breaking below $60,000 would be highly probable.
② Mid-term adjustment (late April): Reevaluation of wave structure
In the analysis from the week of April 20, we stated: as the time and space of the rebound extended, by April 19, this round of increase had lasted about 73 days, its rebound period far exceeding the “B wave” rebound of 54 days. Therefore, we redefined this round of bullish trend as a large-scale “D wave rebound.” A subsequent “E wave” adjustment is expected, with a high possibility of breaking below the $60,000 support.
③ Late upgrade (mid-May): Re-examining the adjustment level
In the analysis from the week of May 18, we emphasized again: by May 17, this rebound had been running for about 100 days, its time span is close to the cycle (about 122 days) used to adjust from $126,200 to $60,000. This leads us to judge that the entire adjustment pattern is very likely to upgrade to a monthly level adjustment. Therefore, we redefined the wave structure.
④ Summary: The entire analysis process is a dynamic tracking of the evolution of market structures. During this time, we have consistently held the view that $60,000 is an important relay point in the large-scale adjustment process, rather than the final bottom of this bearish market cycle. As of now, since the price broke below the key support of $60,000 on June 5, reaching a low near $59,100, the overall market trend has validated our earlier judgment about the price breaking below this level.
2. BTC Wave Structure Division Based on Monthly Level Trend
Bitcoin _ Monthly K-line Chart: 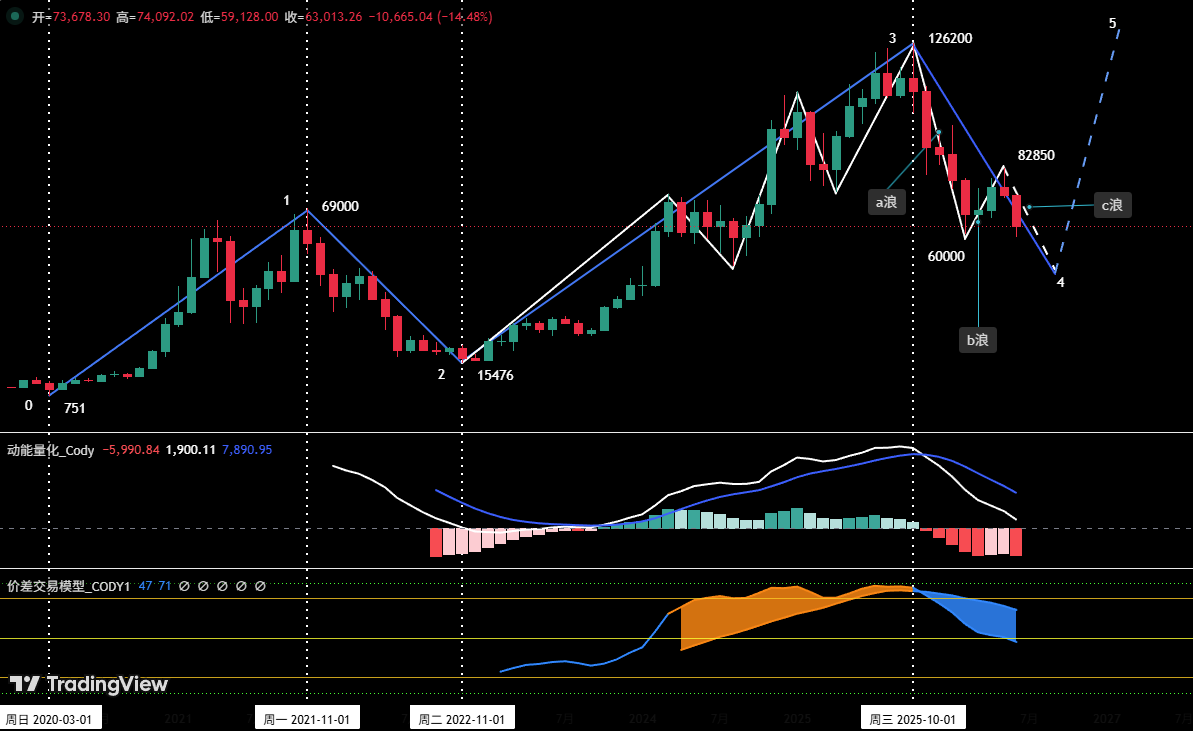
Figure Two
① The Bitcoin monthly chart shows: From January 1, 2017, to now (only capturing this complete trading data segment), it can currently be subdivided into four段式结构;
• Segment 0-1 (upward cycle): From $751 (2017-01-01) to $69,000 (2021-11-10), lasting about 59 months (approximately 1774 days).
• Segment 1-2 (adjustment cycle): From $69,000 (2021-11-10) to $15,476 (2022-11-21), lasting about 13 months (approximately 376 days). The maximum decline during this period was approximately 77.57%.
• Segment 2-3 (upward cycle): From $15,476 (2022-11-21) to $126,200 (2025-10-06), lasting about 35 months (1050 days). This created a historic new high with a primary upward wave, with a maximum increase of approximately 715.46% during this period.
• Segment 3-4 (adjustment cycle): From $126,200 (2025-10-06) to now, it has run for about 8 months (approximately 243 days), with a maximum decline of 53.17% during this period.
② As shown in (Figure Two), the adjustment trend that began from the previous high of $126,200 (i.e., Segment 3-4) can initially be determined as a monthly-level a-b-c three-wave adjustment structure, and the current market is running in the down phase of wave c.
• Wave a (downward wave): From $126,200 (2025-10-06) to $60,000 (2026-02-06), lasting about 4 months (approximately 122 days), with a maximum decline of about 52.5% during this period.
• Wave b (rebound wave): From $60,000 (2026-02-06) to $82,850 (2026-05-06), lasting about 3 months (approximately 90 days), with a maximum increase of about 38.1% during this period.
• Wave c (downward wave): From $82,850 (2026-05-06) to now, it has run for 33 days. During this period, on June 5, the coin price dropped below the $60,000 support, hitting a low near $59,100. This breakdown confirmed the establishment of wave c (downward wave).
BTC Hourly Level Trend Structure In-depth Analysis: (Using 4 hours as the analysis period)
Bitcoin _ 4 Hour K-line Chart 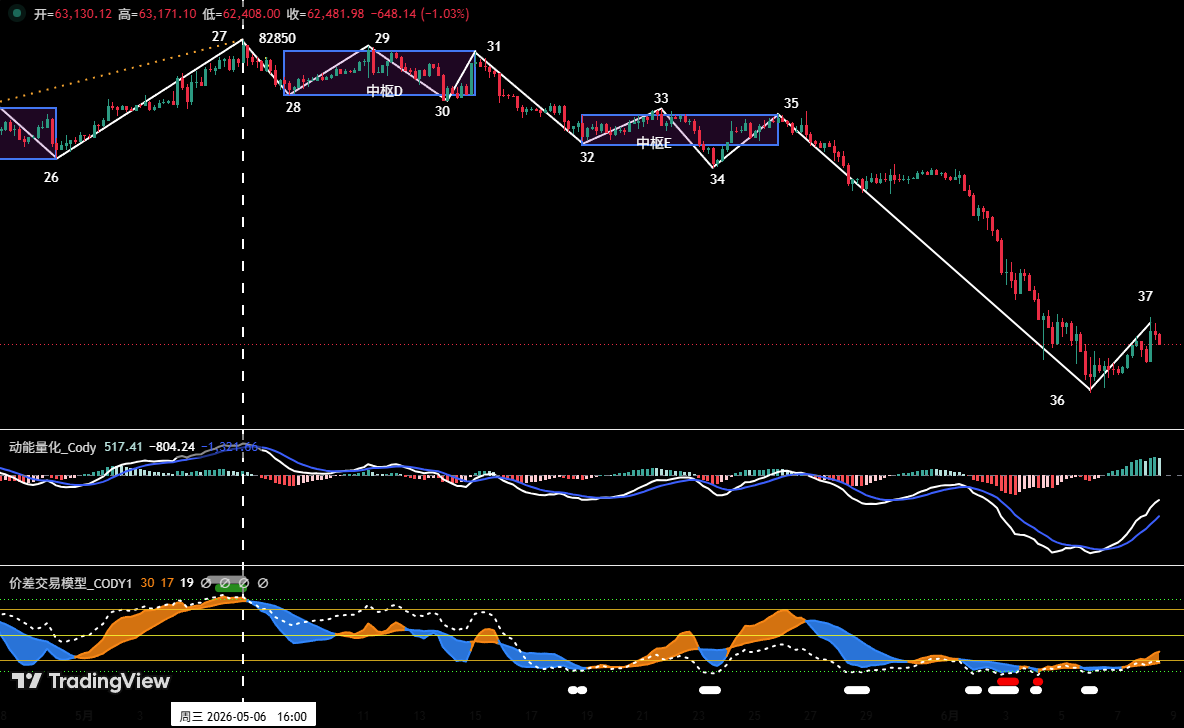
Figure Three
① As shown in (Figure Three), the adjustment since the high of $82,850 on May 6 can be subdivided into a ten-segment adjustment structure in the 4-hour chart. It includes two descending central pivots: Central D and Central E. The overall structure is clear, presenting a typical complex adjustment form.
② From the 4-hour trend structure, it is currently running in segments 36-37 rebounding. The first resistance above is near $65,000; the important resistance is in the $69,500–70,500 range.
2. Current Operational Judgments for Bitcoin
1. BTC trend prediction for this week:
This week’s core viewpoints:
• Pay attention to the testing results of both bulls and bears near the $65,000 and $69,500–70,500 resistance zones.
• Also, pay attention to the support effect when the price returns to the $59,000–60,000 zone.
2. Core pressure levels:
• First pressure zone: near $65,000 (previous important low)
• Second pressure zone: $69,500–70,500 (previous concentrated trading area)
3. Core support levels:
• First support level: $59,000–60,000 (previous important support level)
• Second support level: near $55,000 (previous important support level)
4. This week’s operational strategy (excluding the impact of sudden news)
① Medium-term strategy:
Bitcoin _ Daily K-line Chart: (Position monitoring model) 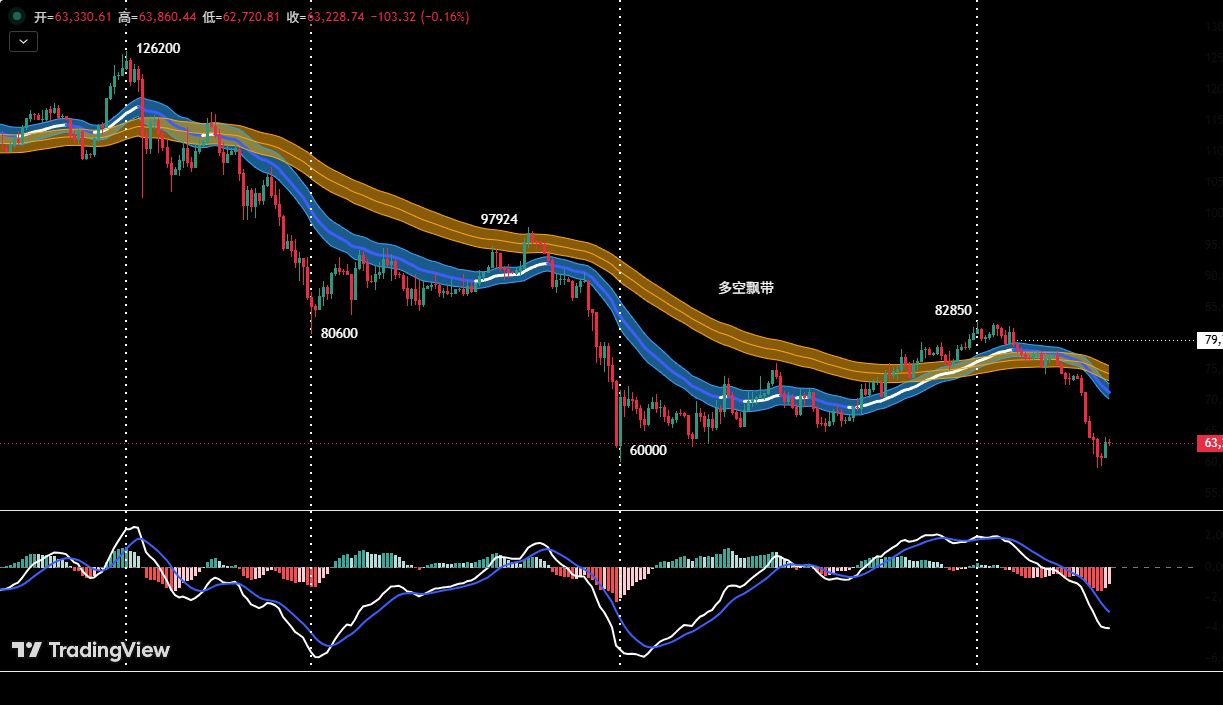
Figure Four
Position monitoring model: As shown in (Figure Four), the current coin price has effectively broken below the "bull-bear channel," confirming a shift into a bearish dominated pattern. Last week, the market showed a one-sided sharp drop without resistance, with insufficient momentum during intraday rebounds. Such market conditions do not align with our established medium-term trend-following position building principles, hence we maintain a medium-term bearish wait-and-see approach.
If a technical rebound occurs this week, positions can be gradually built based on the following three-level strategy:
• Weak rebound shorting: If the price rebounds to near $65,000 and shows stagnation signals, a preliminary 20% medium-term short position can be established.
• Adding to the strong resistance zone: If the price further rebounds to the $69,500–70,500 zone and shows clear signs of pressure, the medium-term short position can be increased to 60%.
• Breakout trailing shorts: If the price rebounds fails near $65,000 and subsequently falls, effectively breaking below the $59,000–60,000 support range, the short position can be added to 60%.
② Short-term strategy: Utilize 30% of positions, set stop-loss points, based on support and resistance levels, searching for arbitrage opportunities. (Using 30 minutes/60 minutes as the operating period).
③ In short-term operations, to dynamically respond to complex market evolutions, we proactively draft two specific operational plans A/B.
• Plan A: Rebound under pressure, short on highs.
• Opening position: If the price rebounds to near $65,000 and shows stagnation signals, combined with quantitative model top signals, a 15% short position can be established.
• Risk control: Set initial stop-loss level.
• Closing position: When adjusting near important support levels and in conjunction with model signals, positions can be gradually liquidated for profit-taking.
• Plan B: Add to the strong resistance zone.
• Adding positions: If the price further rebounds to the $69,500–70,500 zone and shows stagnation signals, combined with quantitative model top signals, the short position can be increased to 30%.
• Risk control: Set initial stop-loss level.
• Closing position: When adjusting near important support levels and in conjunction with model signals, positions can be gradually liquidated for profit-taking.
• Plan C: Effective break below support, short on trend.
• Opening position: If the price rebounds fails near $65,000 and falls back, effectively breaking below the $59,000–60,000 support range, combined with model top signals, the short position can be increased to 30%.
• Risk control: Set initial stop-loss level.
• Closing position: When the price falls to important support levels and in conjunction with model signals, positions can be gradually liquidated for profit-taking.
3. HYPE Hourly Level Trend Structure Analysis:
HYPE_4 Hour K-line Chart 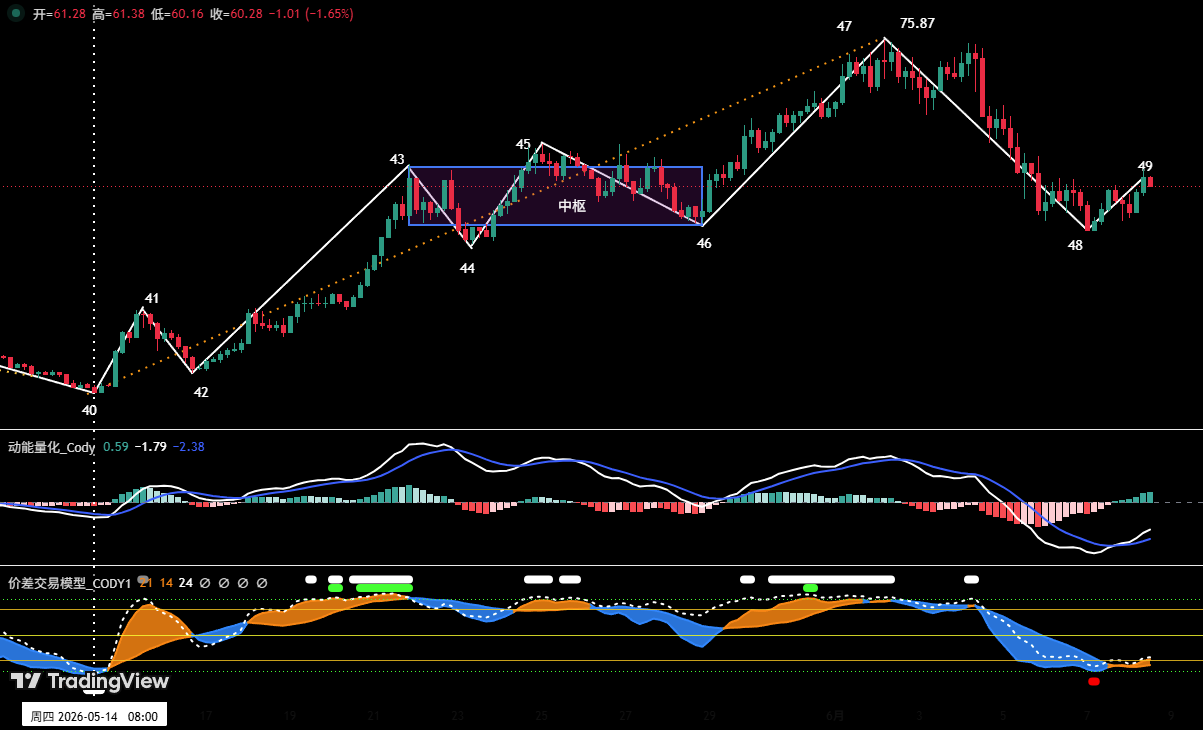
Figure Five
1. As shown in (Figure Five), in the 4-hour cycle, HYPE rose from the low of $38.14 on May 14 to the high of $75.87 on June 2, clearly forming a seven-segment structure that includes an “upward central pivot.”
2. In last week’s weekly review, it was indicated: that the position of “endpoint 47” has shown divergence in momentum, coupled with the top warning signal from the “arbitrage trading model,” both resonating. Thus, the probability of forming a short-term high here is large. The market trend confirmed this judgment: the price adjusted from “endpoint 47” ($75.87) down to “endpoint 48” ($55.47), with a maximum decline of 26.89%.
3. Currently, the HYPE price has stabilized and risen in the $55 support area, and is in the rebound process of 48-49, with pressure above located in the $62.5 to $64.57 range. If the price rebounds to this level and finds pressure and falls back, it will continue to look for strong support downwards.
4. HYPE Prediction and Short-Term Trading Strategies for This Week: (06.08–06.14)
1. HYPE Trend Prediction for This Week:
① Core pressure levels:
• First pressure level: $62.5–64.57;
• Second pressure level: $68–70;
② Core support levels:
• First support level: $55–57;
• Second support level: $47–49;
This week’s core viewpoints for HYPE:
• Observe the results of price tests against pressure and support levels.
2. HYPE Short-Term Trading Strategy for This Week: (Buy on Support)
This week’s HYPE short-term trading should follow the strategy “build on dips, avoid chasing highs”.
Short-term strategy: Stabilize in the support area and try going long.
When the HYPE price tests the $55–57 or deeper $47–49 key support areas, appears to stop falling and show stabilization signals, and triggers the bottom signals from two major models simultaneously, consider lightly trying long positions, keeping the position controlled below 30%, and strictly observing stop-loss discipline.
5. Special Reminders:
1. When opening positions: immediately set the initial stop-loss level.
2. When profit reaches 1%: move the stop-loss level to the opening cost price (break-even point) to ensure capital safety.
3. When profit reaches 2%: move the stop-loss level to the position of 1% profit.
4. Continuous tracking: thereafter, every time the coin price profits by another 1%, the stop-loss level will move synchronously by 1% to dynamically protect and lock in profits.
The financial market is ever-changing, and all market analyses and trading strategies must be dynamically adjusted. All viewpoints, analysis models, and operational strategies contained in this article stem from personal technical analysis, solely for personal trading logs, and do not constitute any investment advice or operational basis. The market carries risks, and investments should be cautious, please do not make decisions based on this.
免责声明:本文章仅代表作者个人观点,不代表本平台的立场和观点。本文章仅供信息分享,不构成对任何人的任何投资建议。用户与作者之间的任何争议,与本平台无关。如网页中刊载的文章或图片涉及侵权,请提供相关的权利证明和身份证明发送邮件到support@aicoin.com,本平台相关工作人员将会进行核查。


