Cryptocurrency Scholar: The 6.6 Bitcoin Daily Bearish Pattern is Established! Is the Pressure for a Bitcoin Rebound Clear? Latest Market Analysis and Trading Suggestions
The current price of Bitcoin is 59,700. The short-term market is fluctuating, and as soon as there is a rebound, some people immediately shout that the bull market has returned, only to quickly turn around and panic sell when there is a sharp drop. Currently, the price level of 59,700 is at the dividing line of bullish and bearish sentiment. Short-term long positions are only suitable for small accounts with quick in-and-out trades, definitely not for holding long term. Many people lose money due to greed—after reaching their target price, they are unwilling to leave the market, and ultimately their profits turn into losses. Position sizes in contract trading must be strictly controlled; if the preset entry point is not reached, firm observation is required. It’s better to miss out on a wave of price movement than to blindly enter the market and fall into traps. Making small profits in the short term relies on discipline, while large losses are mostly due to a mindset of luck.
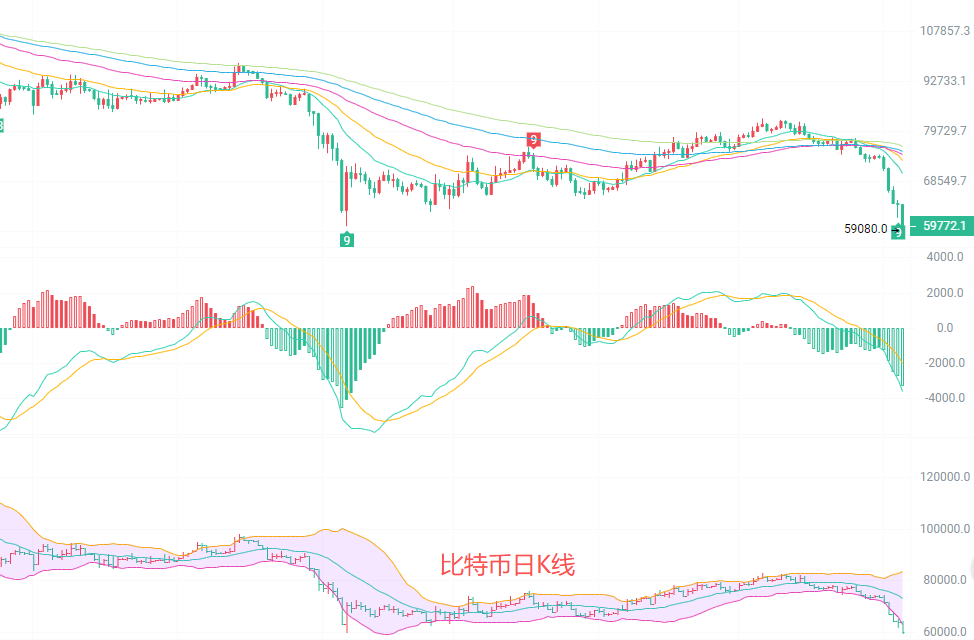
The daily candlestick chart shows a single-day drop of 6.44%, with a low point of 59,080. The price has fallen below the EMA15/30/60 full-period moving averages, all moving averages are turning downwards, forming a downward pressure zone. The short-term pressure zones are located between 70,222 and 73,144. The Bollinger Bands are opening downward, with the current price breaking through the lower Bollinger band at 62,807, operating in the oversold area below the band. The daily MACD is below the zero axis, with the DIF and DEA lines both sloping downwards, and the downward green bars continue to increase in volume, indicating a clear downward trend on a larger time frame. There are no signs of stabilization or a halt in the decline; the larger timeframe downward structure firmly dominates, and even if a rebound occurs in the short term, it is likely to be a technical correction that is difficult to directly reverse the downward structure.
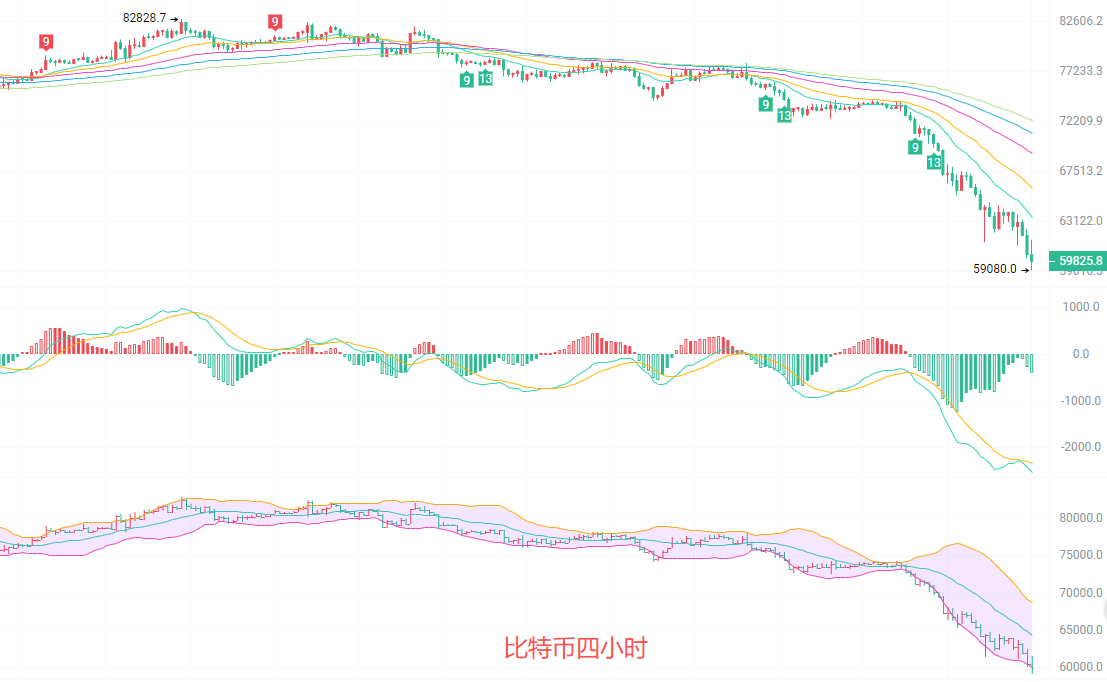
The four-hour candlestick chart is firmly under pressure from all EMA moving averages, with 15/30 short-term moving averages at 63,468 and 65,999 becoming strong short-term resistance levels. The Bollinger Bands are opening significantly downward, with the current price running near the lower Bollinger band around 59,929, and indicators are entering an extreme oversold range. The 4-hour MACD maintains a dead cross below the zero axis; although the green bars have slightly reduced in volume, both fast and slow lines continue to diverge downward. Downward momentum may have slowed but has not reversed. From the arrangement of candlesticks, after a series of large bearish candles, there is slight sideways movement at a low level. There is a demand for a rebound from overselling in the short term, but the southward arrangement of moving averages limits the height of the rebound, which will primarily serve as a corrective recovery, unable to change the medium-term downward trend.
Short-term trading ideas: Follow the larger cycle trend, with small stop losses and quick in-and-out trades.
For the lower range from 59,000 to 58,500 going upward, set a stop loss at 58,000, with targets looking at 60,000 to 61,500.
For the upper range from 63,000 to 63,500 going downward, set a stop loss at 64,000, with targets looking at 61,500 to 60,000.
Specific operations should be based on real-time market data. For more information details, you can consult the author. The article publication may have delays; it is suggested for reference only, risks are to be borne by oneself.

Kind reminder: The above content is solely created by the author’s public account. The advertisements at the end of the article and in the comment section are unrelated to the author. Please identify them with caution. Thank you for reading.
免责声明:本文章仅代表作者个人观点,不代表本平台的立场和观点。本文章仅供信息分享,不构成对任何人的任何投资建议。用户与作者之间的任何争议,与本平台无关。如网页中刊载的文章或图片涉及侵权,请提供相关的权利证明和身份证明发送邮件到support@aicoin.com,本平台相关工作人员将会进行核查。