The latest fall in Bitcoin further confirms the view that the market remains fragile, with profitability, investor behavior, ETF holdings, and demand in the spot market all showing signs of weakness.
Written by: Glassnode
Translated by: AididiaoJP, Foresight News
Bitcoin fell 13% this week, with profitability collapsing significantly, realized losses surging, and spot sellers regaining control. US spot ETF investors fell back into unrealized losses after facing resistance near their cost price, while the options market continues to price risk at a high level.
Summary
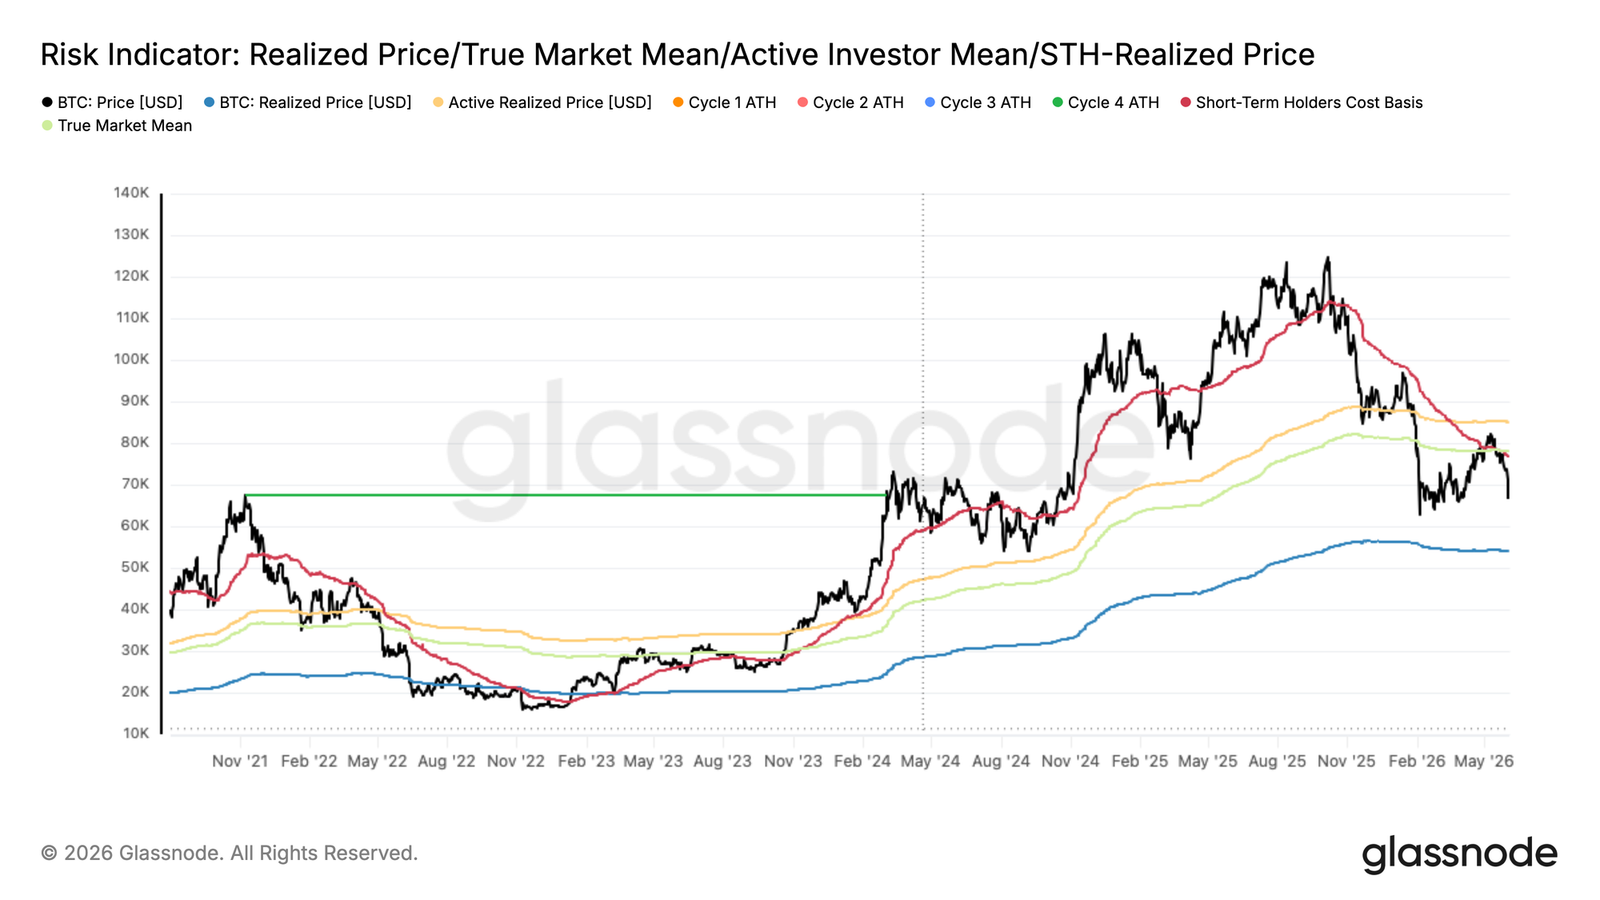
- Bitcoin has dropped 13% in the past 7 days, pulling the price back to the midpoint between the realized price and the real market average. The cost basis for short-term holders has dropped below the real market average for the first time since January 2022, confirming late-stage bear market characteristics.
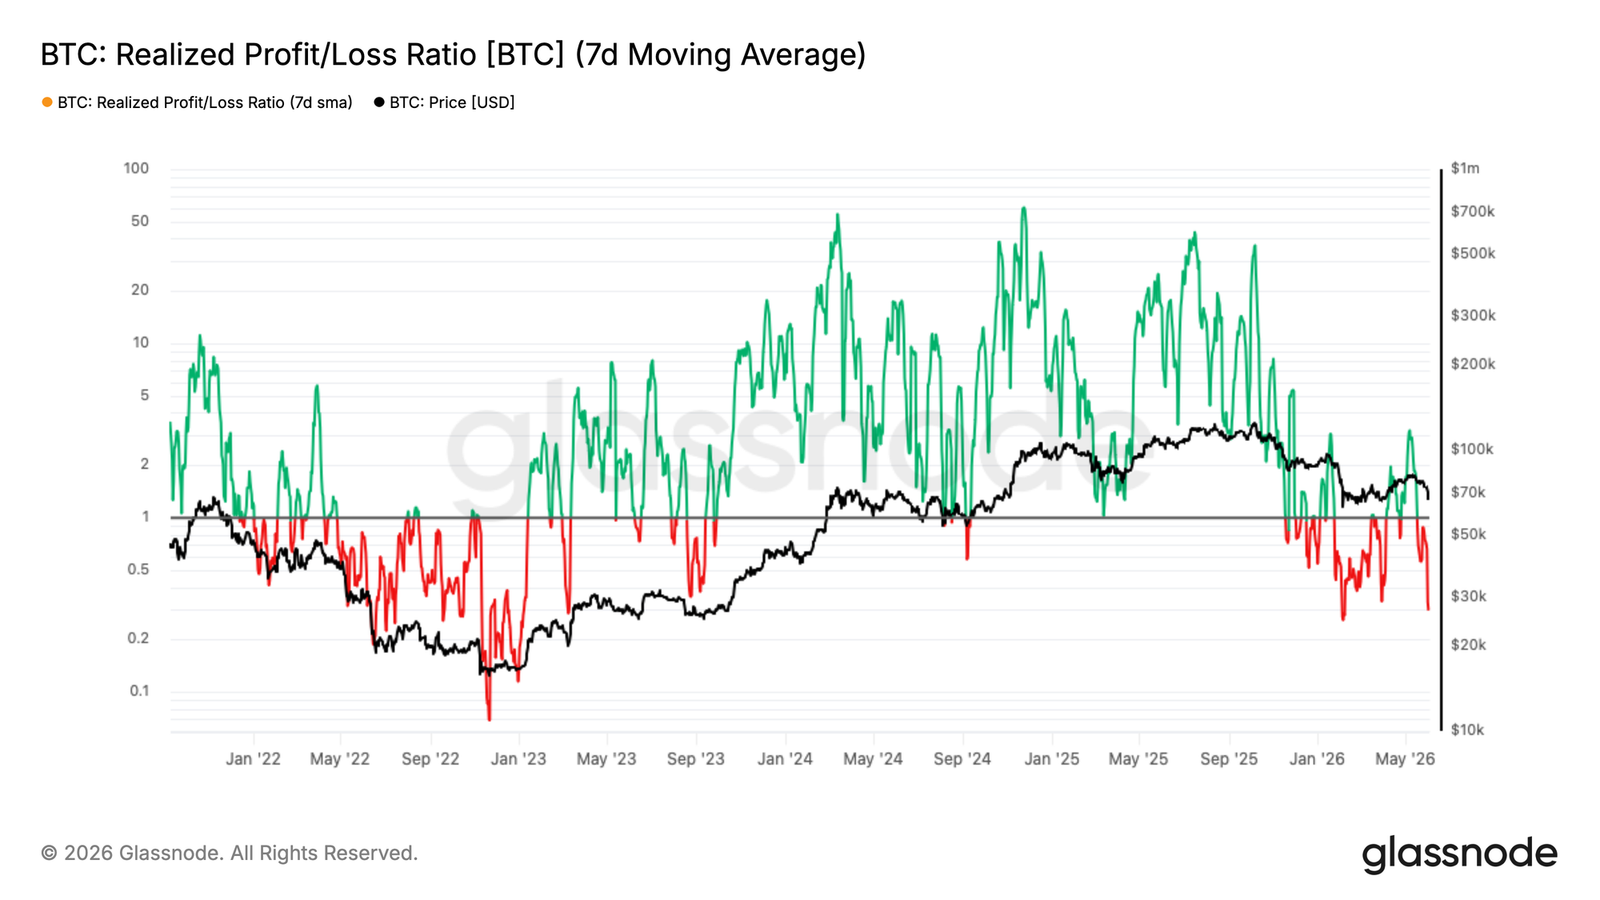
- The 7-day moving average of the realized profit and loss ratio plummeted from a local high of 3.16 to 0.29, almost matching the panic segment in February; the 90-day moving average has consistently failed to break through the threshold of 2, confirming the $82k rebound is just a bear market rally, not a structural reversal.
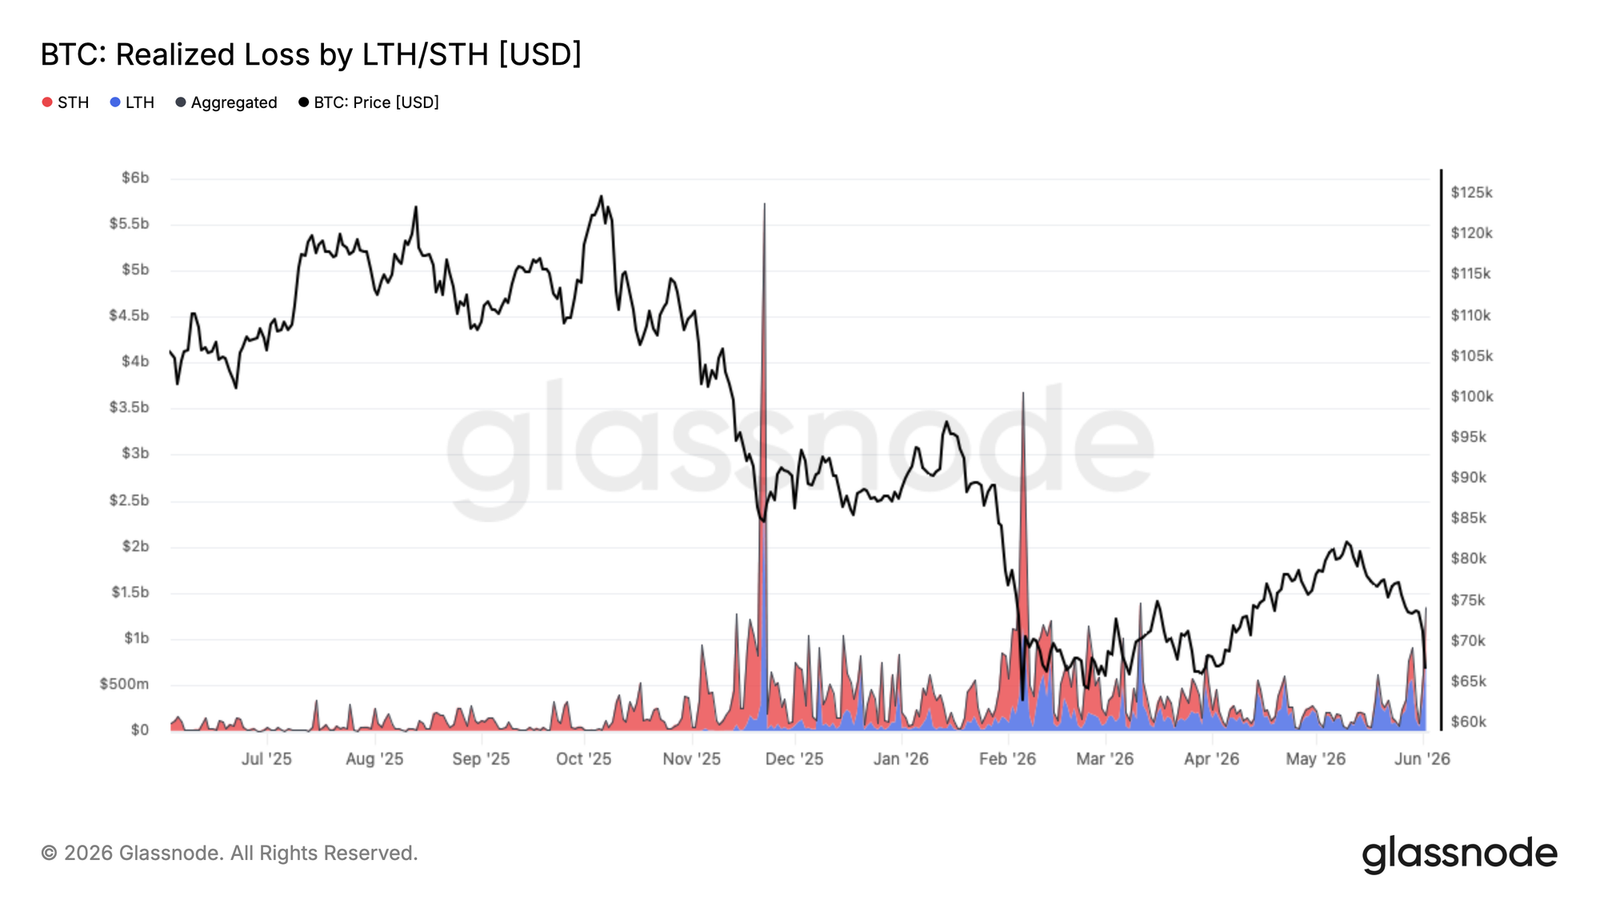
- The daily total of realized losses surged to $1.35 billion, with $770 million coming from long-term holders cutting losses at the cycle's peak, indicating that the process of supply redistribution is accelerating but is not yet complete.
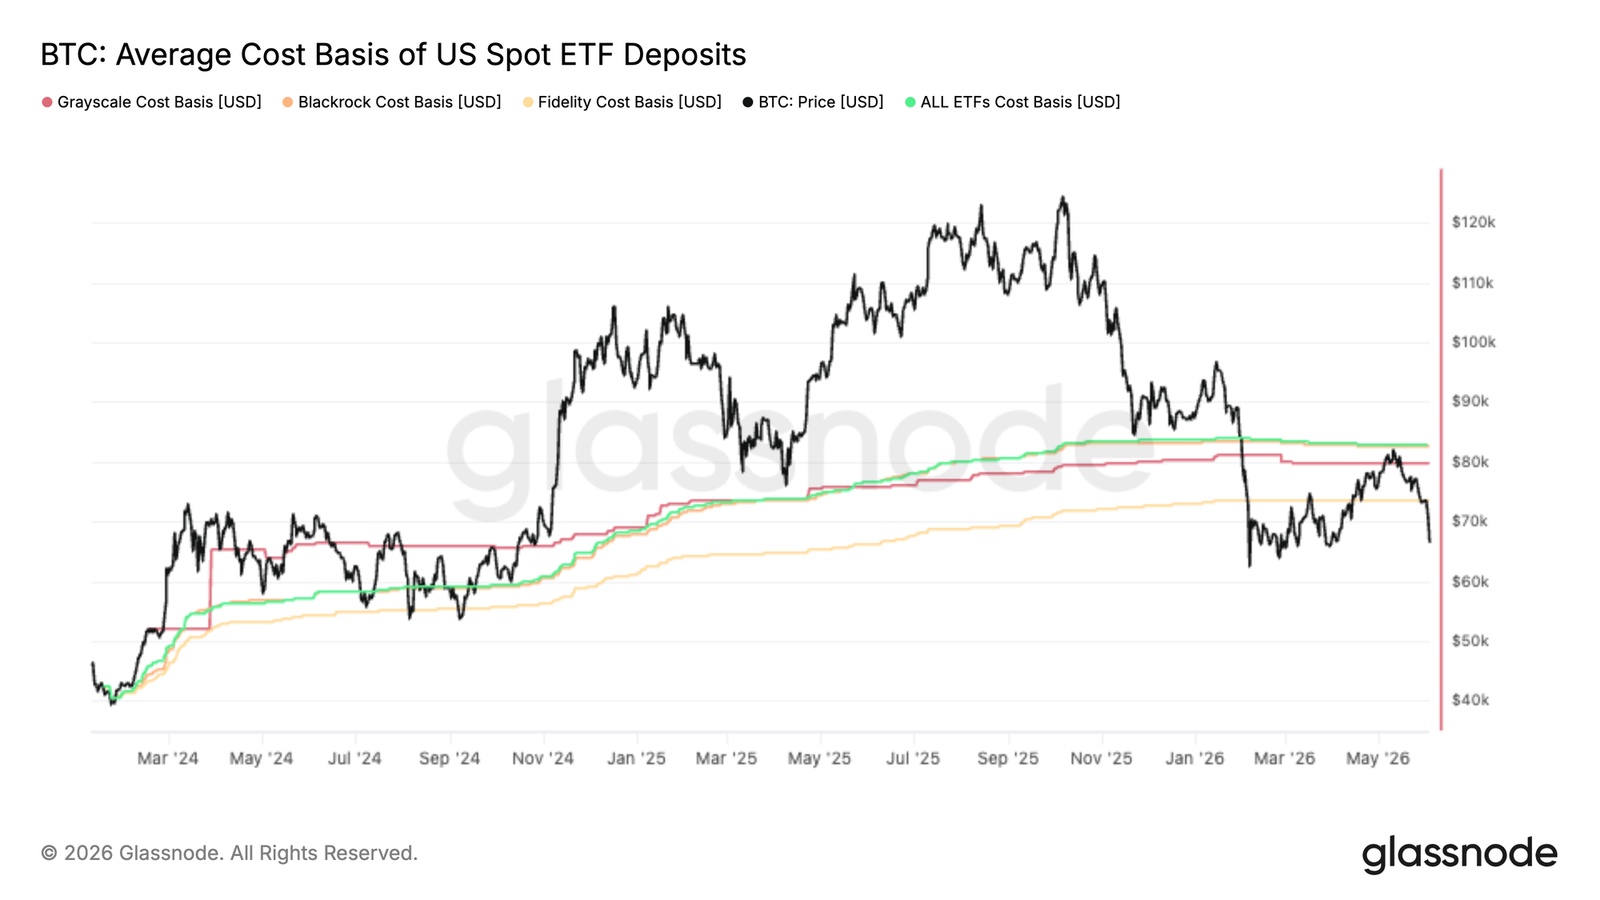
- Bitcoin was nearly exactly rejected near the aggregate cost price of the US spot ETF at $83k, causing ETF average investors to return to unrealized losses, with this price level reinforced as important resistance above.
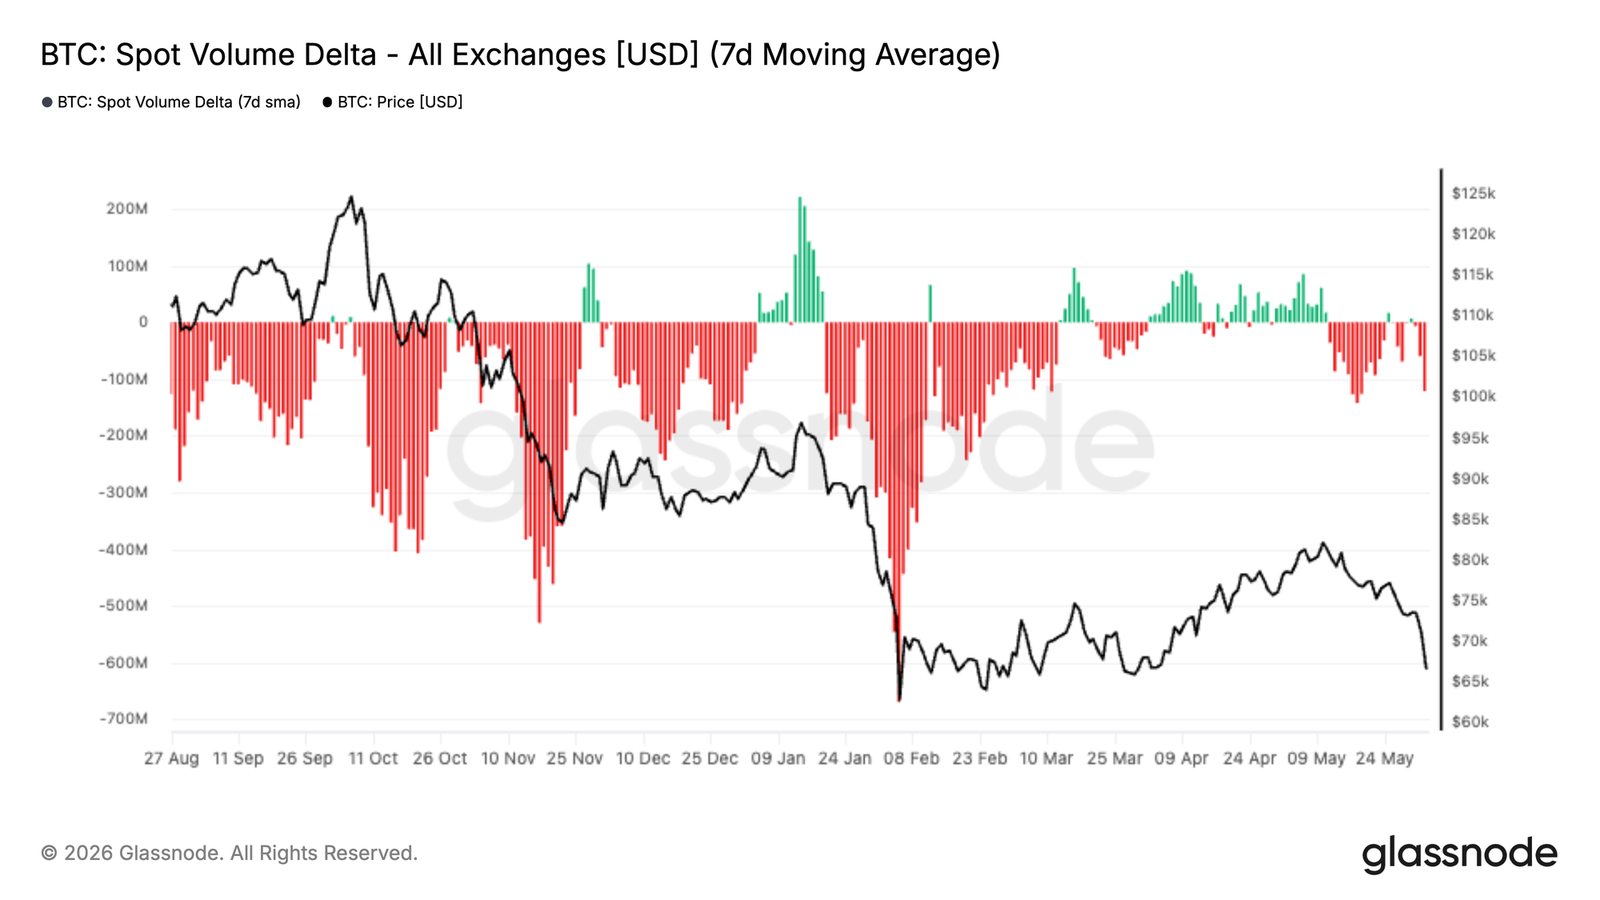
- Spot market selling pressure intensified, with the 7-day spot trading volume Delta turning to significantly negative values, reaching the weakest level since February, indicating that despite the pullback, sellers still dominate the order book.
- Implied volatility continues to compress, while the volatility risk premium widens, with the options market pricing future volatility higher than recent actual market performance.
- Skew remains in the area of bearish option premiums, but recent selling has not triggered a noticeable increase in downward hedging demand.
- Market maker positions are concentrated around current spot prices, with Bitcoin at its maximum negative gamma region, with funds continuing to favor protective demand.
Macroeconomic Insights
US job vacancies in April rose to 7.62 million, the highest in nearly two years, exceeding market expectations by 750,000. The yield on 10-year US Treasury bonds rebounded above 4.45%, with the market pricing more than a 50% probability of the Federal Reserve raising rates by the end of the year, and no expectations of rate cuts for the year. The US dollar index remains above 99. Financial conditions are marginally tightening rather than loosening.
Bitcoin has absorbed this shift more strongly than any other risk asset, falling 13% in the past week to around $67,000. US spot ETFs saw an outflow of $4.21 billion over the last three weeks, the largest institutional redemption wave since 2026. Institutions are going to risk ahead of price declines, rather than reacting afterward. Friday's non-farm payroll data is a key observation point. Strong data will continue the current distribution pressure; weak data may provide the first reset conditions.
On-Chain Insights
Back to Bear Market Range
The aforementioned macro headwinds have directly translated into the deterioration of on-chain structures. The 13% drop in the past week has pulled prices back from the real market average of $77.8k, which tracks the cost basis of actively traded supply and has historically marked the boundary between bull and bear markets. Currently, the price of $67k is positioned at the midpoint of this range, failing to hold above the real market average, confirming that the continuation of the bear market remains the dominant pattern.
Notably, the cost basis for short-term holders has now dropped to $76.4k, falling below the real market average, a structure last seen in January 2022. This configuration indicates that new buyers are accumulating below the critical average market valuation, which is characteristic of late-stage bear markets: the time dimension of the pullback begins to pressure investor beliefs, historically leading to structural failures or large-scale liquidation at this stage.
Profitability Bias Collapsing in the Downtrend
Based on the aforementioned structural deterioration, the short-term cash flow environment has sharply shifted due to the recent price drop. The 7-day moving average of the realized profit and loss ratio has contracted to 0.29, indicating that realized losses are significantly dominating on-chain spending behavior. This is almost identical to the panic phase of early February. On May 7th, the 7-day average soared to 3.16 as investors realized profits in the $82k rebound, but the 90-day average has consistently failed to break the threshold of 2, corresponding to genuine bull market cash flows. This divergence between short-term and medium-to-long-term readings is a clear signal of a lack of structural confidence in the rebound, aligning with the formation of a local top in the bear market, rather than a credible structural shift. The subsequent drop back to 0.29 further confirms this assessment.
New Buyers Under Pressure
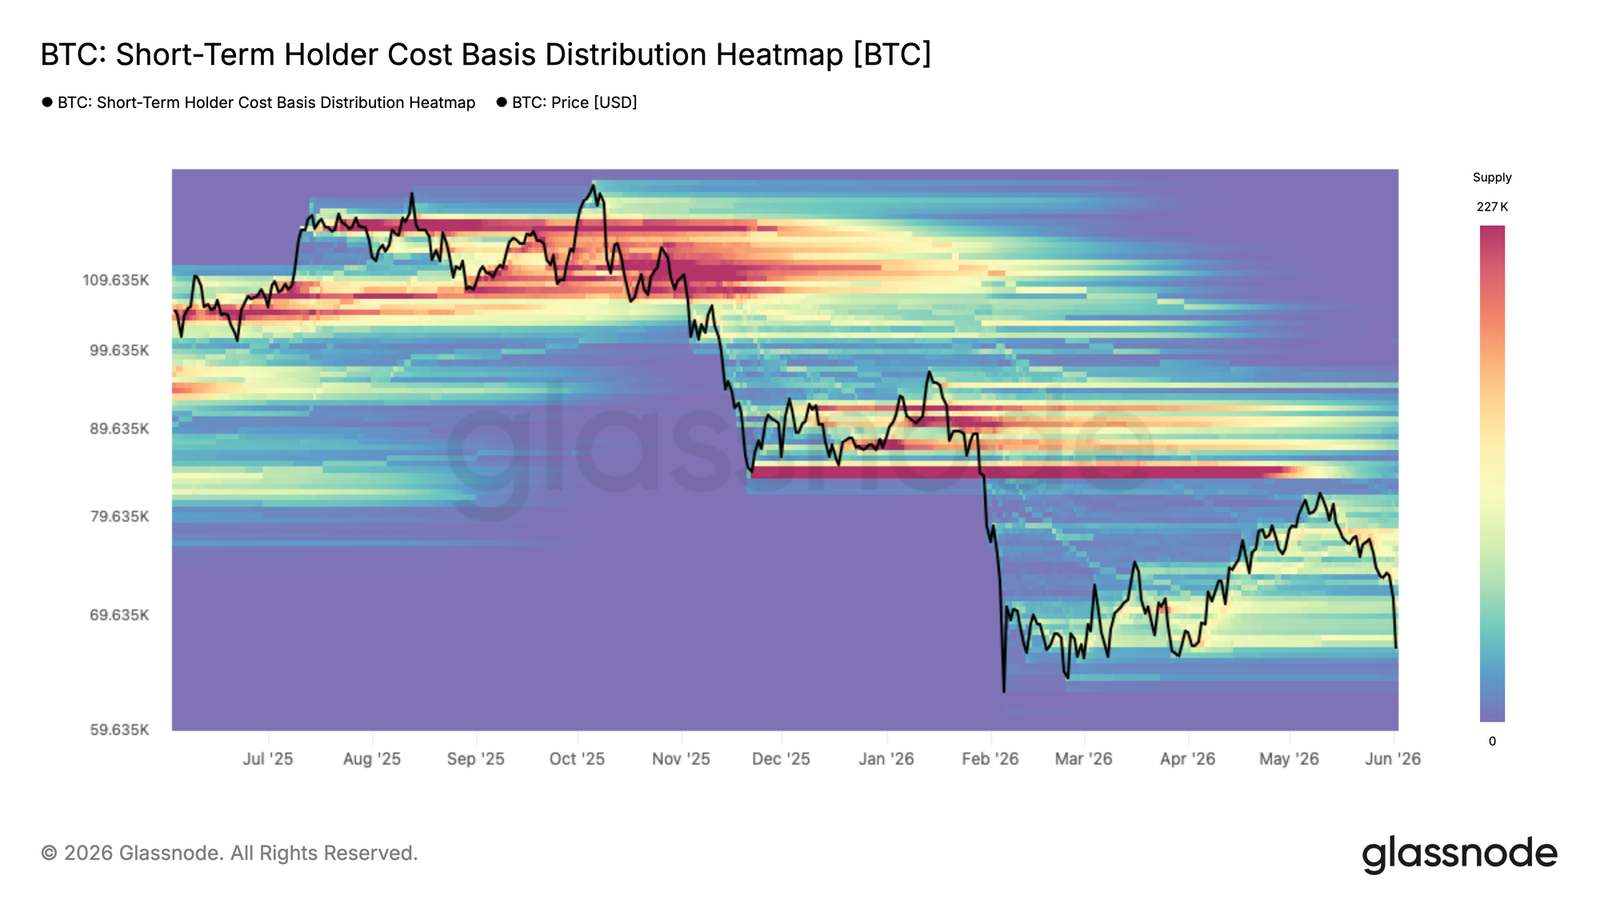
From the resistance at the bear market top range, the recently accumulated supply is now directly exposed to the loss line. The cost basis distribution heatmap for short-term holders shows the density of supply from recent buyers at different price ranges, revealing where the cost basis for short-term holders is concentrated, which is also the area most likely to experience behavioral pressure.
As the price retreats to around $67k, it is approaching the lower edge of the supply cluster accumulated since February. In this area, many short-term holders are seeing their unrealized gains compressed to breakeven or even turn into losses. Those who accumulated near the local top in the $78k-$82k range are facing the most direct pressure, and their choice to hold or liquidate will determine whether the current price can absorb selling pressure or yield to a deeper decline.
Realization of Losses Accelerating Across Groups
As recent buyers are pushed back to the lower edge of the three-month range, the pressure of realized losses has expanded beyond the latest accumulated supply. The retreat to $67k has pushed the daily total of realized losses to $1.35 billion, significantly accelerating from the baseline level during the previous consolidation period.
Of this, daily losses of $770 million were realized by long-term holders who bought before January 2026, reflecting that as the bear market drags on, buyers from the top of the cycle are continuously liquidating. The remaining portion comes from recent buyers who accumulated in the $67k-$82k range in 2026 and are forced to incur losses as prices fall below their cost basis.
As the bear market matures, this pattern of long-term holders cutting losses and passing their supply to new buyers at lower prices is a recurring and necessary feature in the bottoming process of the cycle. However, the current pace of realizing losses indicates that this process is still not complete.
Off-Chain Insights
Falling Below ETF Cost Basis
Bitcoin's latest rebound has nearly stopped just shy of the aggregate US spot ETF cost price of $83k, transforming the previously supportive price level into a clear resistance. This indicates that many ETF investors who were previously at unrealized losses utilized the rebound opportunity to reduce their positions or exit at breakeven.
This rejection is particularly noteworthy because ETF capital flows have been one of the dominant demand sources in this cycle. When prices struggle to reclaim the average holder's cost basis, it often signals that the supply from trapped investors is exceeding new demand, forming resistance above.
Looking ahead, the aggregate ETF cost basis remains a critical observation level. A decisive reclaim would return ETF average investors to a profitable state and potentially improve the overall sentiment of this group. Until then, failing to hold above this level indicates that ETF holdings are still a headwind, and investors continue to reduce risk rather than accumulate in strength.
Spot Buying Disappearing
Spot market flows have sharply deteriorated over the past two weeks, with the 7-day spot trading volume turning negative and reaching the weakest level since the February sell-off. This indicates that aggressive sellers are again dominating the spot order book, further exacerbating the recent weakness in price trends.
What is particularly striking about the current trend is that it is occurring after a sustained spot-led accumulation in April and early May. During that surge, buyers continuously lifted sell orders, pushing spot trading volume into positive territory and helping Bitcoin rebound from the mid-$60k range to $80k. That demand pulse has now dissipated, and as prices failed to break higher, sellers regained control.
Persistently negative spot trading volume Delta is typically accompanied by either capitulation events or early stages of broader trend reversals. As it stands, this suggests that the market is still in a distribution phase, with spot participants using rebounds to sell rather than accumulate. Significant improvement in spot demand remains one of the key signals supporting a sustainable recovery.
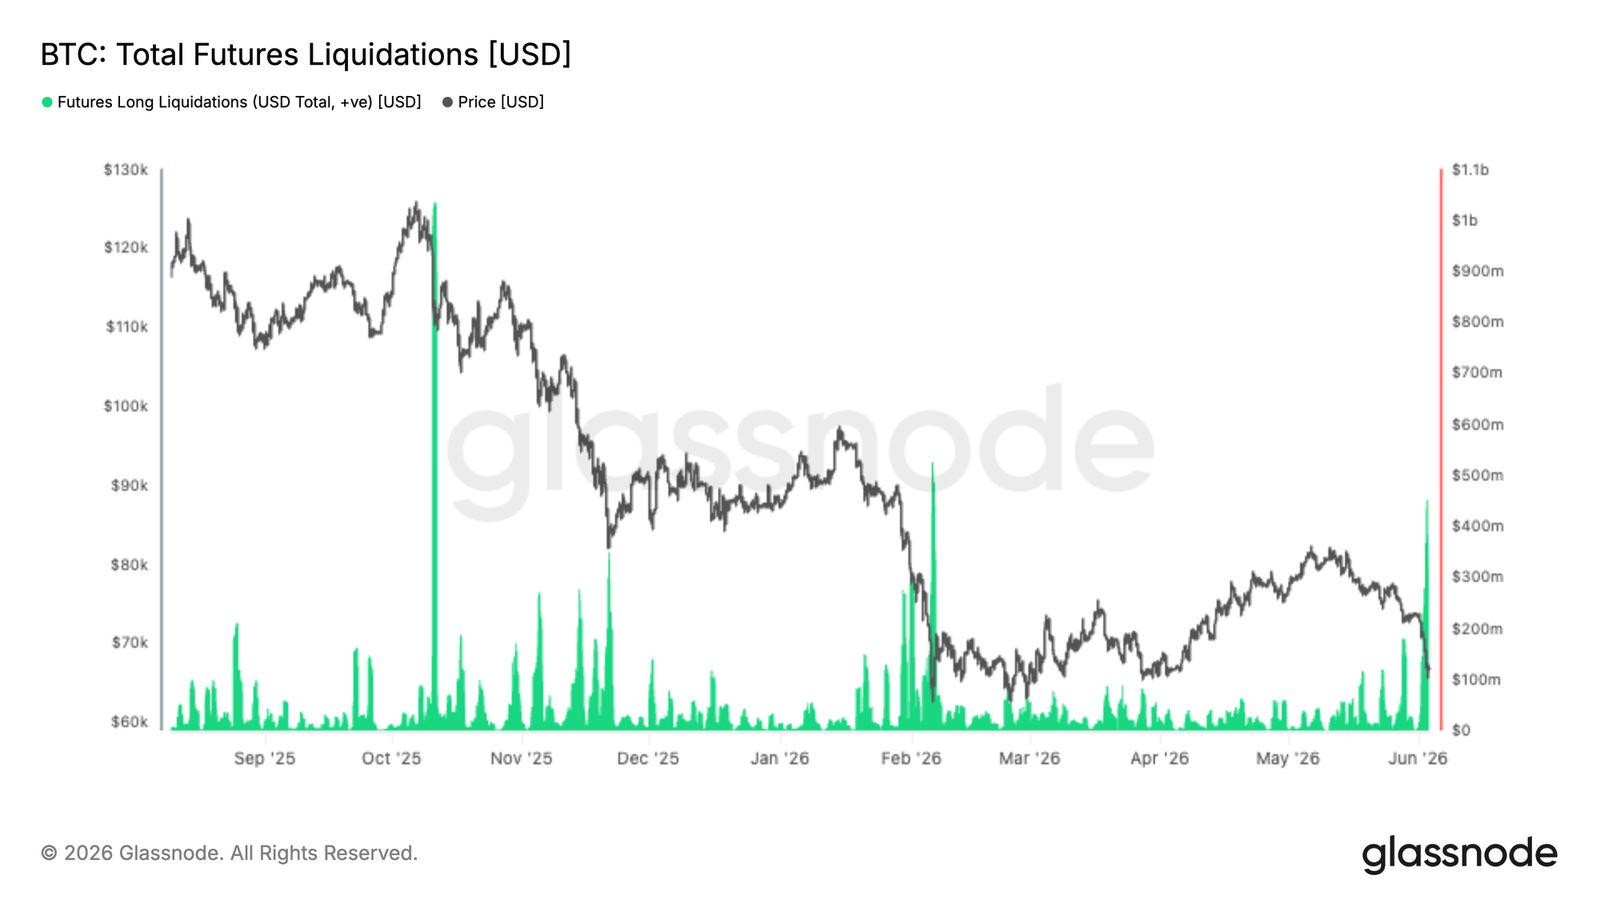
Futures Liquidations
The latest market correction triggered one of the largest liquidation events of this cycle, with more than $400 million in leveraged long positions forcibly closed as Bitcoin fell below $70k. While painful for late entrants, such events often serve to clear excess leverage from the system and reset market positions.
It is worth noting that the scale of this liquidation remains lower than during the corrections of October 2025 and February 2026, indicating that leverage had not been excessively stretched before this decline. Historically, large-scale long liquidations often coincide with local exhaustion points, as forced selling cascades through the derivatives markets and clears weak hands.
The key question moving forward is whether spot demand can intervene to absorb the supply. If selling pressure driven by liquidations begins to subside, while spot buyers return, the market may have a cleaner position background and lower leverage overhead, creating conditions for a more sustainable recovery.
Implied Volatility Continued to Decline
In terms of implied volatility, despite the spot break, the dominant trend remains a compression across the entire term curve. 1-month tenor has dropped from around 38% to 34%, while 3-month and 6-month tenors also compressed by about 3 volatility points in the past two weeks.
This trend reflects that even after Bitcoin broke below the recent lower range, the market remains unwilling to pay a premium for options. While front-end volatility briefly reacted to sharp spot fluctuations, these were quickly sold off, maintaining a broader downtrend.
The term structure remains in a premium state, with longer-term volatility still trading at a premium over the front end. This indicates that traders continue to view the recent price weakness as a localized event, rather than a catalyst triggering a broader repricing of volatility.
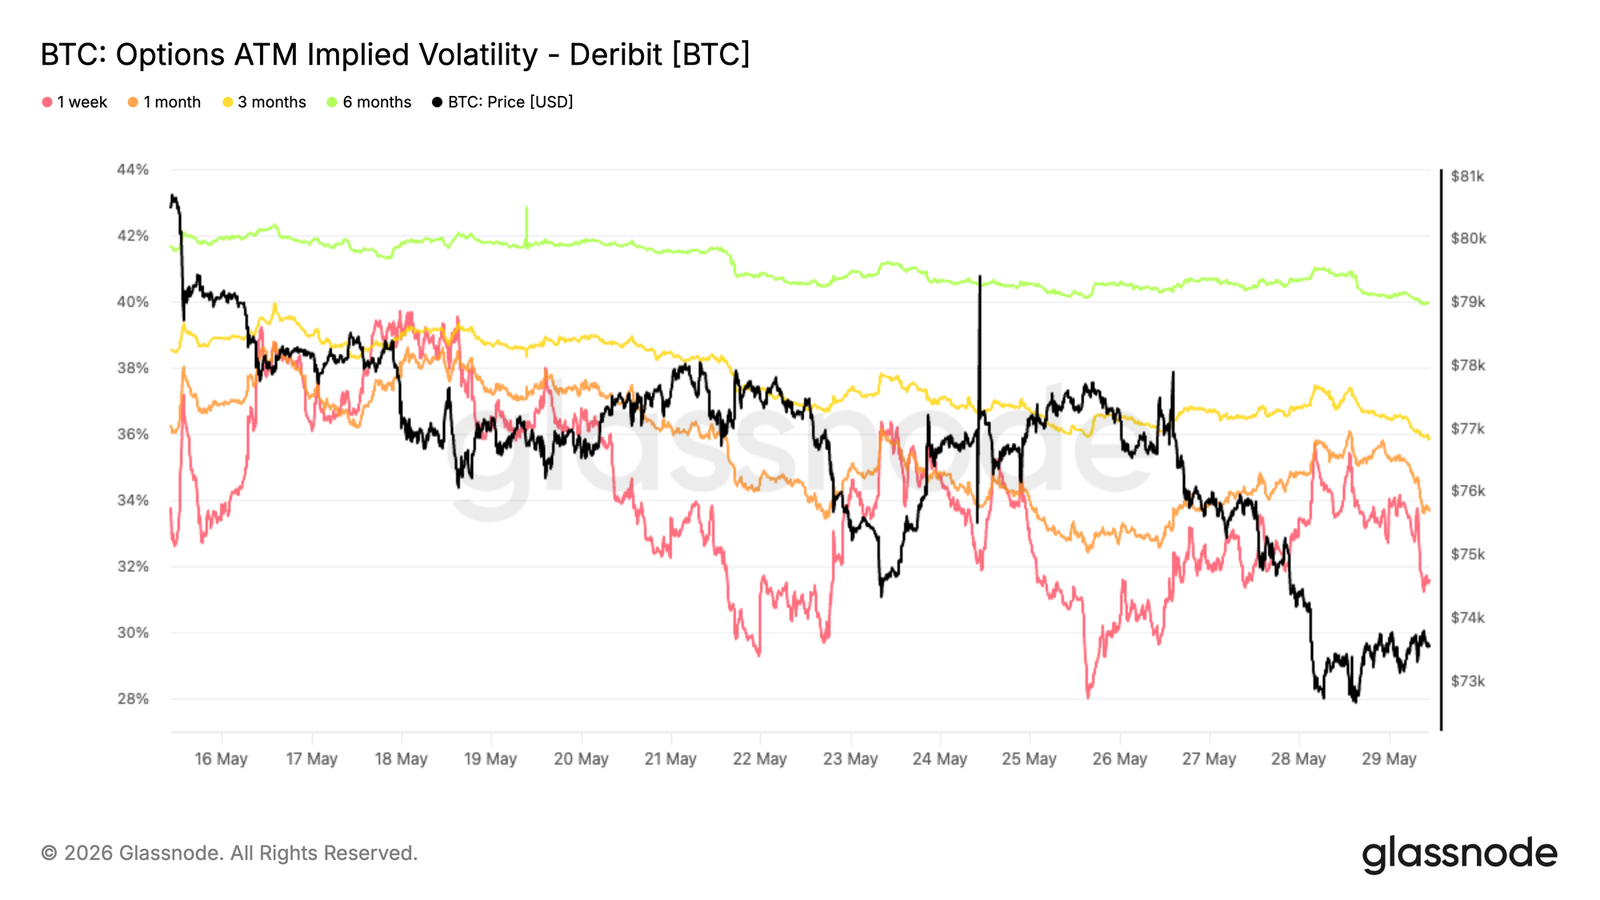
Volatility sellers still dominate, but despite the price weakening, the demand for protection has not accelerated.
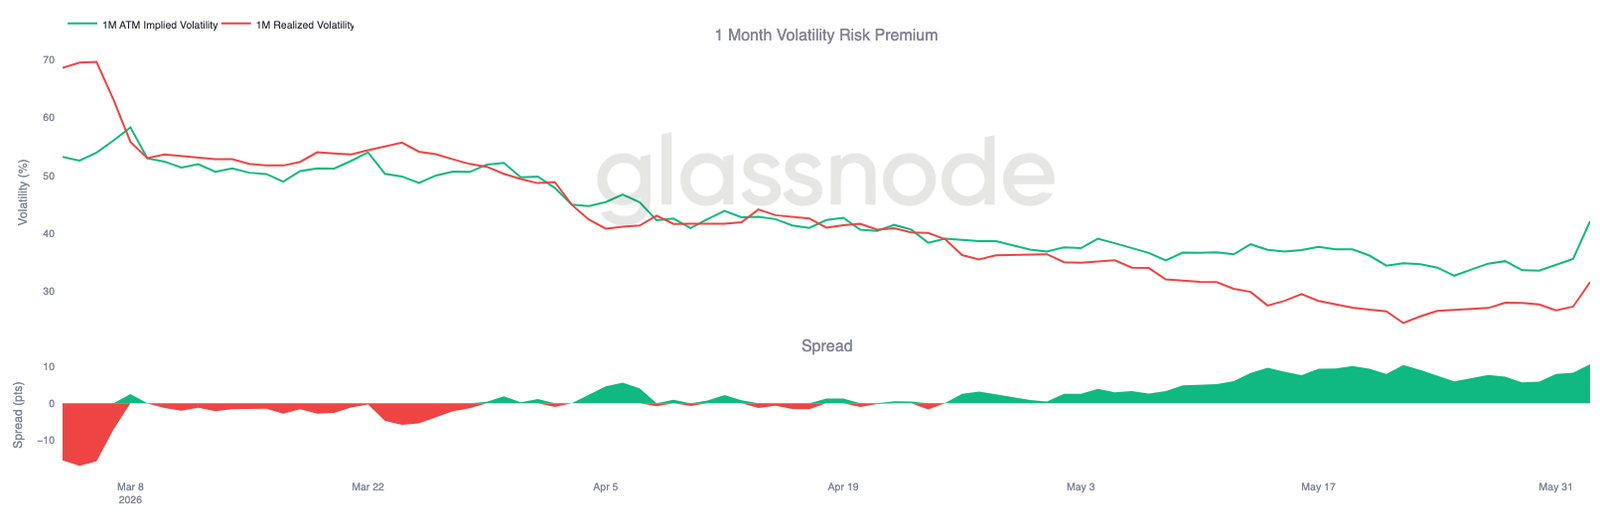
Volatility Risk Premium Approaching Three-Month Highs
As implied volatility declines, the relationship between implied and realized volatility tells a different story. Despite Bitcoin experiencing a period of volatility, the options market continues to price future volatility significantly higher than the recent realized market volatility.
1-month implied volatility has rebounded to about 42%, while realized volatility remains close to 32%. As a result, the volatility risk premium has widened to the highest levels seen in the past three months.
This change has been particularly pronounced during the recent sell-off. While realized volatility rose slightly when the spot broke important support, implied volatility surged even faster, reflecting new demand for options and protection.
The options market continues to assign a higher probability to future volatility than what recent price action alone indicates, keeping the volatility premium at significantly high levels.
Put Option Premiums Remain High
As the volatility risk premium expands, skew indicates where traders continue to concentrate their demand for options. Despite the spot breaking lower, put options continue to be more expensive than call options across the entire term curve.
Conclusion
The latest fall in Bitcoin further confirms the view that the market remains fragile, with profitability, investor behavior, ETF holdings, and demand in the spot market showing signs of weakness. The total cost price of the ETF is blocked around $83,000, indicating that many investors are still trapped above the current price, leading to high-level selling and continuously suppressing Bitcoin's rebound.
Meanwhile, realized losses are accelerating, long-term holders are starting to liquidate on a large scale, and the spot order flow has clearly shifted to sellers. Although recent liquidation events help clear leverage from the system, there is currently little evidence of a persistent demand response capable of absorbing the resulting supply.
The same applies to the options market. Traders are still buying protection against downside risks and future volatility, but there is no sign of the panic typically accompanying significant declines. Until spot demand strengthens, ETF investors regain profitability, and selling pressure begins to ease, the market may continue to face the risk of further declines and persist in a broader bear market structure.
免责声明:本文章仅代表作者个人观点,不代表本平台的立场和观点。本文章仅供信息分享,不构成对任何人的任何投资建议。用户与作者之间的任何争议,与本平台无关。如网页中刊载的文章或图片涉及侵权,请提供相关的权利证明和身份证明发送邮件到support@aicoin.com,本平台相关工作人员将会进行核查。


