1. Market Overview: Systematic Sell-off, Narrative Collapse
Today is June 5, 2026, Friday.
The current cryptocurrency market is experiencing the most severe systematic sell-off since February 2024, presenting a threefold negative feedback structure of "capital flight, leverage liquidation, narrative vacuum."
Core Data: Bitcoin's weekly decline reaches 13%, Ethereum falls below $1800, and the DeFi sector drops 9.16% in 24 hours. The market is rapidly switching from "regulatory dividend" expectations to a defensive mode of "capital outflow + macro pressure."
2. Bitcoin (BTC): Institutional Withdrawal and Bottom Play
1. Capital Situation: Historic Outflow from ETFs
The U.S. spot Bitcoin ETF has seen a net outflow for 13 consecutive trading days, losing over $4 billion in total, setting the record for the longest outflow since the product's launch. Citigroup's analysis shows that ETF inflows and outflows can explain about 45% of BTC price fluctuations and is a core variable for observing institutional sentiment.
2. Leverage Structure: Double Damage for Bulls and Bears
In the past 24 hours, total liquidations across the network amounted to $637 million, with long positions liquidated at $387 million and short positions at $251 million, demonstrating a typical double damage pattern for bulls and bears. Notably, BTC short position liquidations ($151 million) slightly exceeded long position liquidations ($110 million), indicating that capital for bottom fishing is still being liquidated during the downturn.
3. Divergent Institutional Views
Bearish: BTC may test the support range of $55,000 to $57,000 again, returning to 2024 levels.
bullish: Standard Chartered maintains a year-end target price of $100,000, believing the current position is the "buying zone everyone wants." Grayscale anticipates a recovery period in the coming months but emphasizes that a sustainable bottom requires new buying pressure.
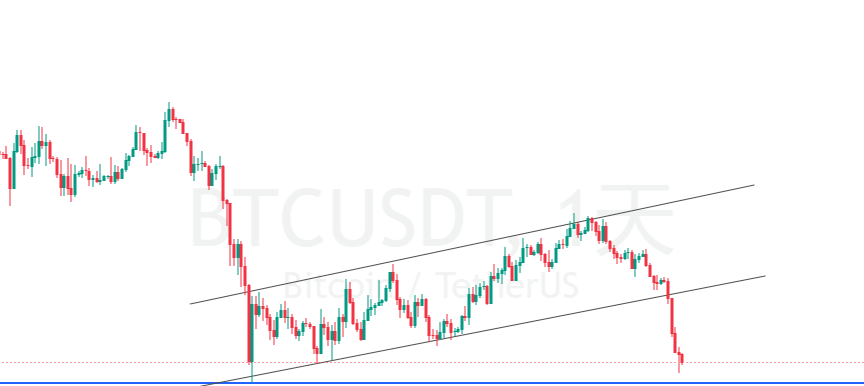
4. Technical Position
BTC is currently near the 200-week moving average, a position historically marking the bottom of bear markets. Standard Chartered points out three major risk variables: ① Whether ETF outflows continue to accelerate; ② Whether the Federal Reserve releases hawkish signals at the June/July meeting; ③ Whether BTC's market share falls below the range of 52-54% (currently about 60%).
3. Ethereum (ETH): Continued Hemorrhage
ETH has fallen below $1800, continuing to decline by 0.92% in 24 hours, underperforming BTC. In the context of overall pressure on DeFi and a decrease in on-chain activity, ETH lacks independent narrative support.
4. Policy Aspects: Dual-Track Evolution
1. Negative: Sudden Drop in Clarity Act Expectations
The core reason that supported the market bull cycle—the U.S. Digital Asset Market Clarity Act—has seen its passage probability continuously decline. Senator Lummis warns that if it cannot be advanced this year, the bill may not be seriously reconsidered until after 2030.
2. Positive: Accelerated Advancement of Tax Framework
The House Ways and Means Committee is preparing legislation to establish a crypto tax structure, set to release as early as Friday, covering: the taxation timing for staked tokens, tax exemptions for stablecoin transactions, and expanding wash sale rules to digital assets among seven other proposals. This marks a significant process in regulatory framework evolution from "existence" to "perfection."
3. Sentiment Disturbance
Strategy (formerly MicroStrategy) reduced its holdings by 32 BTC, although the scale is tiny, this rare selling behavior from the largest holding institution severely undermined market confidence.
5. Summary and Outlook
The current core contradiction: AI narrative’s siphoning of liquidity + disillusionment with regulatory dividends + continuous ETF outflows
Key Support Levels: BTC $55,000-$57,000 (Bitget), ETH $1,500
Bottom Signal Monitoring: If BTC's market share falls below 54%, it may trigger panic selling across the market.
Rebound Catalysts: Federal Reserve interest rate cut signals, unexpected breakthroughs of the Clarity Act, ETF outflow reversal
Chu Yuechen: 6.5 Bitcoin ETH contract trading reference
The market is currently in the stage of "narrative vacuum" and "capital clearing," with no signals yet appearing on the right side. In terms of spot trading, everyone should be prepared with bullets; once BTC drops below $60,000, phase-in buying is recommended. For ETH, as long as the price reaches $1,500, feel free to go for it.
In terms of contracts, although there was a quick rise yesterday morning, it still failed to stand above $65,000. My explanation is that profit-taking from high-level short positions caused the price increase, rather than active buying from below. After this week's crash, the price may oscillate between $62,000 and $65,000 for a while.
The upper pressure at $64,500-$65,000 suggests that we should still consider establishing short positions in this range, with a stop loss at $65,500 and a target of $63,000-$62,000. We directly set a short position at $64,500 yesterday, and the profit was quite good.
For long position opportunities, consider lightly entering around $62,000 with a small stop loss, and exit decisively if it declines.
In this market situation, definitely do not fight for long positions, as once it drops below $60,000, it is very likely to accelerate downward.
There is no need to trade ETH contracts, as liquidity is poor, volatility is small, and the price points are not referable; contracts should primarily focus on Bitcoin. In the spot market, pay attention to bottom-fishing opportunities at $1,500-$1,300.
If you want to discuss trades together, feel free to message me privately, and I will provide timely strategic layouts and actionable insights.

免责声明:本文章仅代表作者个人观点,不代表本平台的立场和观点。本文章仅供信息分享,不构成对任何人的任何投资建议。用户与作者之间的任何争议,与本平台无关。如网页中刊载的文章或图片涉及侵权,请提供相关的权利证明和身份证明发送邮件到support@aicoin.com,本平台相关工作人员将会进行核查。