Dear friends, I am Qinglan. This morning, the market was hit hard by two major pieces of news. First, BTC plummeted by 7.1%, directly falling below the critical support level of 62000 USDT, with a shocking decline over the past 24 hours. Shortly after, BlackRock deposited 5212 BTC and 20000 ETH into Coinbase, with a total value as high as 360 million USD, which is usually interpreted as a potential sell signal. Additionally, the CEO of CME warned that the risk of new perpetual contracts is too high, and regulatory concerns are rising, making the overall market sentiment extremely weak. The Fear and Greed Index has dropped to 12, indicating an extreme fear environment. In such a scenario, we need to calmly analyze the data rather than being driven by panic emotions.
Current Price and Time
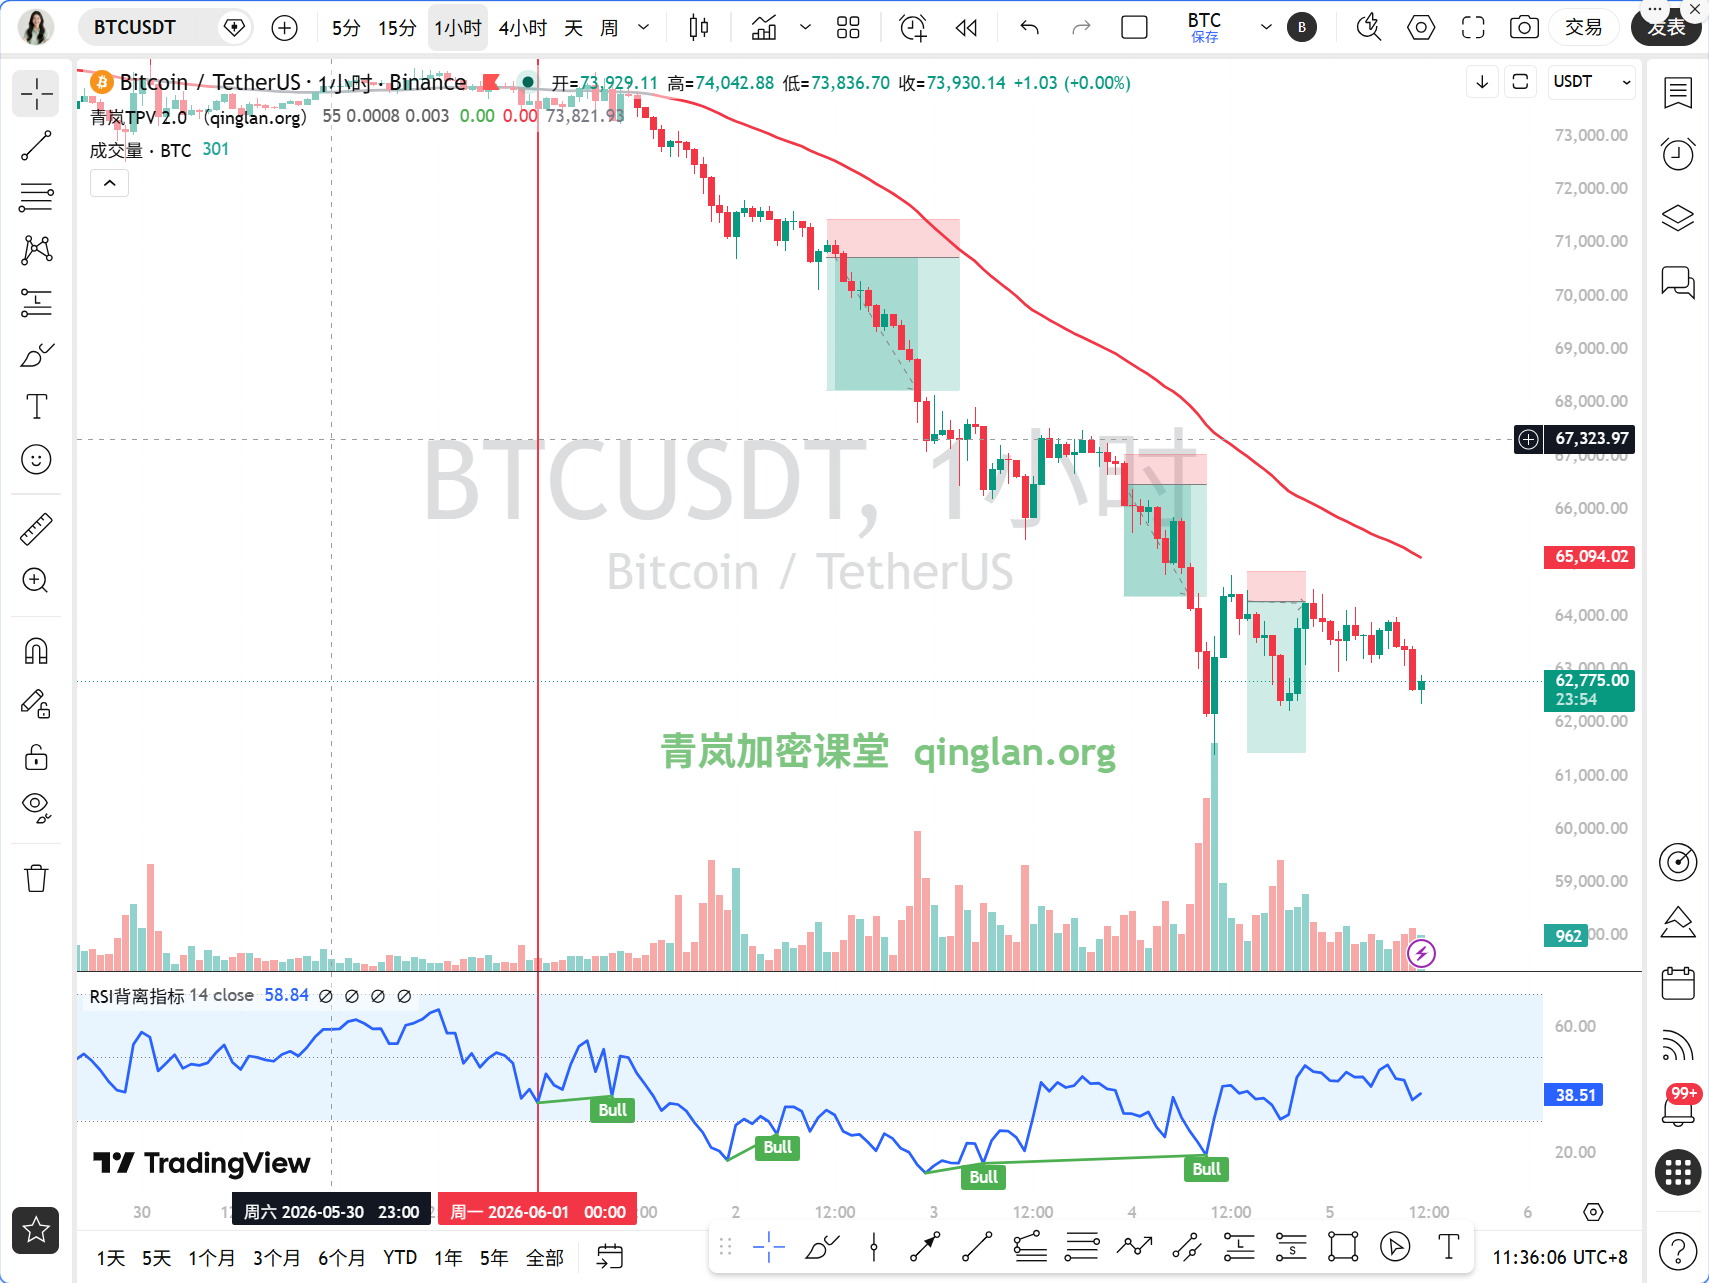
The current time is June 5th, 11:23 AM, and BTC is quoted at 62681 USDT. The price has just rebounded slightly from around 62000, but overall it remains in a weak zone. The 24-hour decline is about 1%, with short-term fluctuations being intense.
Multi Cycle Overview
First, let's look at the daily level. The daily MA5 is at 65774, MA10 at 69796, MA30 at 75667, with all moving averages diverging downwards, and the bearish arrangement is very obvious. The MACD's DIF is -3368.93, DEA is -1946.56, and the histogram is -1422.38, indicating that bearish momentum is continuing to expand. The RSI has dropped to 12.77, a typical oversold area, but oversold does not mean an immediate reversal, it only indicates that the price has been excessively suppressed.
The 4-hour level is similarly grim. MA5 is at 63327, MA10 at 64028, MA30 at 68474, with the price operating below the moving averages. MACD's DIF is -2334.86, DEA is -2243.07, and the histogram is -91.79, showing a slight weakening of bearish momentum but no golden cross formed yet. The RSI is at 28.99, falling within the weak zone.
The 1-hour level is the focus for today. MA5 is at 63197, MA10 at 63409, MA30 at 63569, with the price struggling below the moving averages. EMA55 is at 65000.52, and the current price of 62681 is far below this critical boundary. The MACD's DIF is -446.67, DEA is -455.12, and the histogram is 8.45, showing a weak golden cross signal, but with very low strength. The RSI is at 27.55, also in the oversold zone.
The 15-minute level shows short-term rebound signs. MA5 is at 62625, MA10 at 62982, and MA30 at 63374, with the price just above MA5 but still below MA10 and MA30. MACD's DIF is -256.64, DEA is -150.84, and the histogram is -105.80, and bearish momentum still exists. RSI is at 26.51, in an oversold state.
Overall, from the daily to the 15-minute level, all cycles are in a bearish trend, with only the 1-hour MACD showing slight golden cross signs, but insufficient to change the overall situation.
TPV Signal Verification
According to the Qinglan TPV system, we take the 1-hour EMA55 as the boundary between long and short. The current price of 62681 is far below the EMA55's 65000.52, so the trend is determined to be a bearish trend.
First, let's look at the short-selling conditions. First, the price is under pressure below the 1-hour EMA55, with two consecutive 1-hour candlesticks closing below EMA55, which completely meets this condition. The closing prices of the past 8 1-hour candlesticks are all below EMA55, with crossover times of 0, indicating that the bears are firmly in control. Second, there is pressure encountering resistance, we need to see long upper shadows or top formations. During the decline, the price rebounded near 62000, but the rebound high is around 63000, forming an obvious resistance zone, which can be regarded as an effective high point pullback. Third, the rebound is weak, MACD bars have shortened for 2 consecutive periods, and currently the 1-hour MACD bar has turned from negative to positive, but the amplitude is small. RSI has climbed from 27.55 but remains low, without forming an effective bullish engulfing pattern, indicating insufficient rebound strength. In summary, the conditions for short selling are basically met.
Now let's look at the long conditions. First, the price needs to stabilize above the 1-hour EMA55, but this condition is completely unmet, as the price is still 3.57% away from EMA55. Second, support needs to stabilize, and a long lower shadow has appeared near 62000, but we need confirmation of whether an effective low point has formed. Third, the bearish momentum needs to exhaust; although the MACD bars have shortened, the RSI remains low without a significant rebound. Long conditions are not met.
Regarding oscillation conditions, the past 8 1-hour candlestick closing prices greater than EMA55 are 0, with crossover times of 0. The price is 3.57% away from EMA55, which is far greater than the 0.3% threshold, so it is not an oscillating market, but a one-sided bearish trend.
On-chain Funding Status
On-chain data shows that the Fear and Greed Index is only 12, belonging to extreme fear. Historically, this level often corresponds to a phase bottom, but requires time for verification. BTC's market share is 55.74%, indicating that funds are still seeking refuge in Bitcoin, but overall liquidity is tightening. A new wave of redemptions in U.S. private credit may trigger broader market panic. Grayscale Research points out that strategy selling Bitcoin has caused volatility, and leveraged models are under pressure, suggesting that more selling may still be on the way. The BTC and ETH deposited by BlackRock into exchanges, if sold, would further suppress prices.
Key Defense and Attack Levels
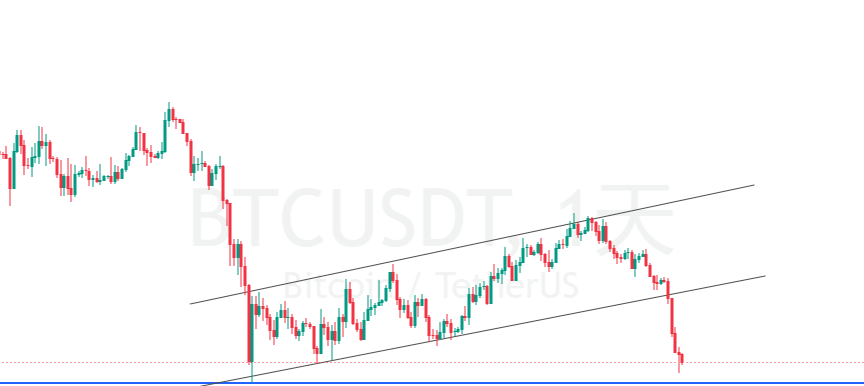
The current most critical support level is 62000, which is the low point of yesterday's sharp drop and also a psychological barrier. If it falls below 62000, the next support is at the integer level of 60000, and further down is around 58000. The upper resistance level is first at 63000, which is the resistance for a short-term rebound, then at 64000, and above that is EMA55 at 65000, which is the dividing line between long and short. Only by regaining above 65000 could the bearish trend potentially reverse.
Trading Thoughts
Based on the Qinglan TPV system, we are currently in a bearish trend, focusing on short selling, but we need to wait for an entry opportunity after a rebound instead of pursuing short positions.
Direction: Short.
Entry Conditions: Wait for the price to rebound to the 63000-63200 area, showing a long upper shadow or top formation at the 15-minute level, while MACD bars start to shorten, and RSI rises from the oversold area to around 40 before turning down again. If the price directly breaks below 62000, a light short position can be pursued, but the risk is considerable.
Stop Loss Level: Set above 64000. If the price exceeds 64000, the bearish logic may fail.
Target Levels: First target at 62000, second target at 60000, and third target at 58000. If there are clear support stabilization signals near 62000, partial profit taking can be considered.
If the price unexpectedly rebounds to around 65000 and stabilizes above EMA55, the bearish trend may end, requiring a reassessment.
Risk Warning
The current market is experiencing intense volatility and insufficient liquidity. Any trading must strictly control position sizes, with single transaction risk not exceeding 2% of total funds.
Follow Qinglan Crypto Classroom to seize more trading opportunities! Welcome to visit the official website www.qinglan.org
📊 Qinglan TPV Trading Strategy Backtest Reference
🕒 Last Backtest Time 06-05 07:00:02
Total Analysis: 2029 Backtests: 1655 Accuracy: 68% (1125/1655)
免责声明:本文章仅代表作者个人观点,不代表本平台的立场和观点。本文章仅供信息分享,不构成对任何人的任何投资建议。用户与作者之间的任何争议,与本平台无关。如网页中刊载的文章或图片涉及侵权,请提供相关的权利证明和身份证明发送邮件到support@aicoin.com,本平台相关工作人员将会进行核查。