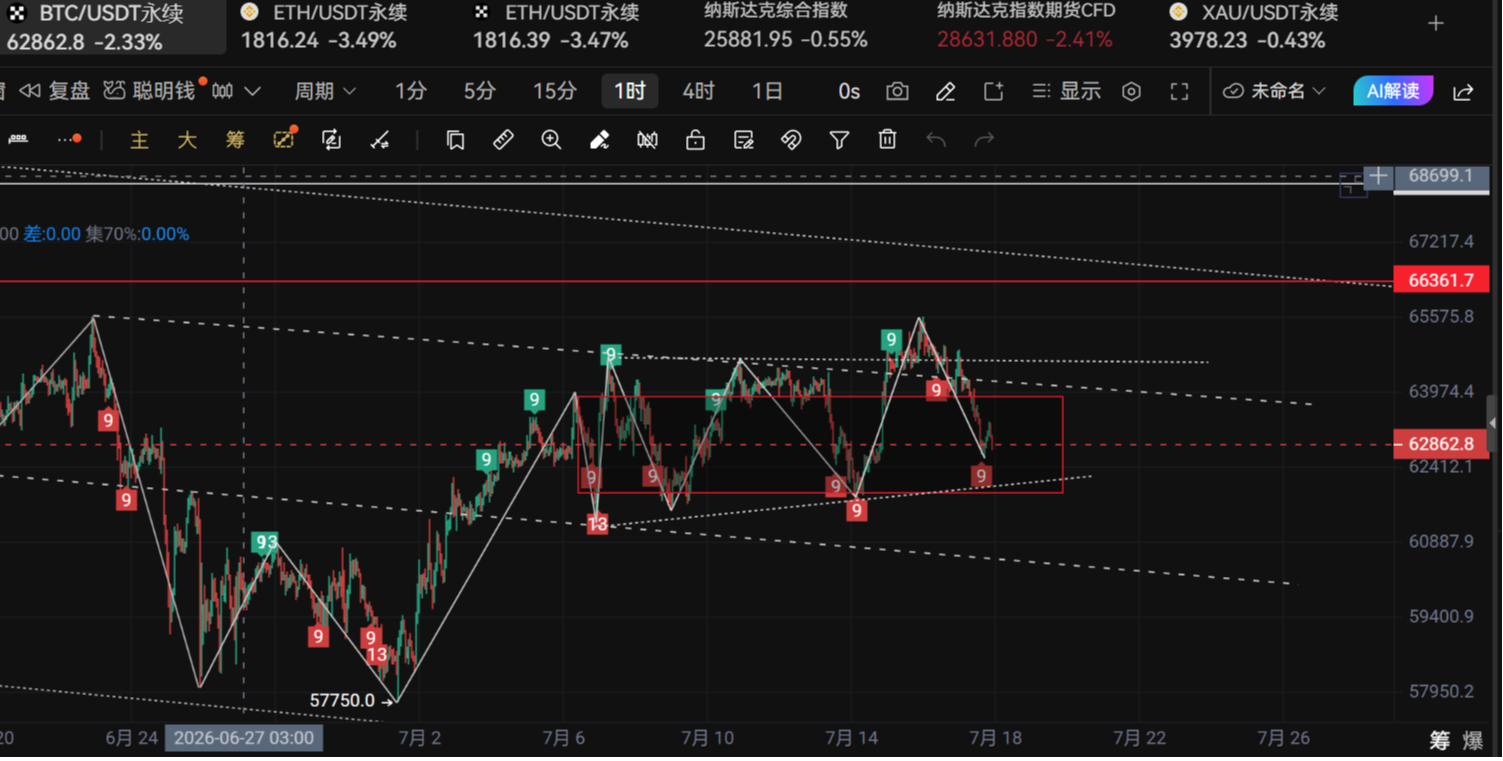
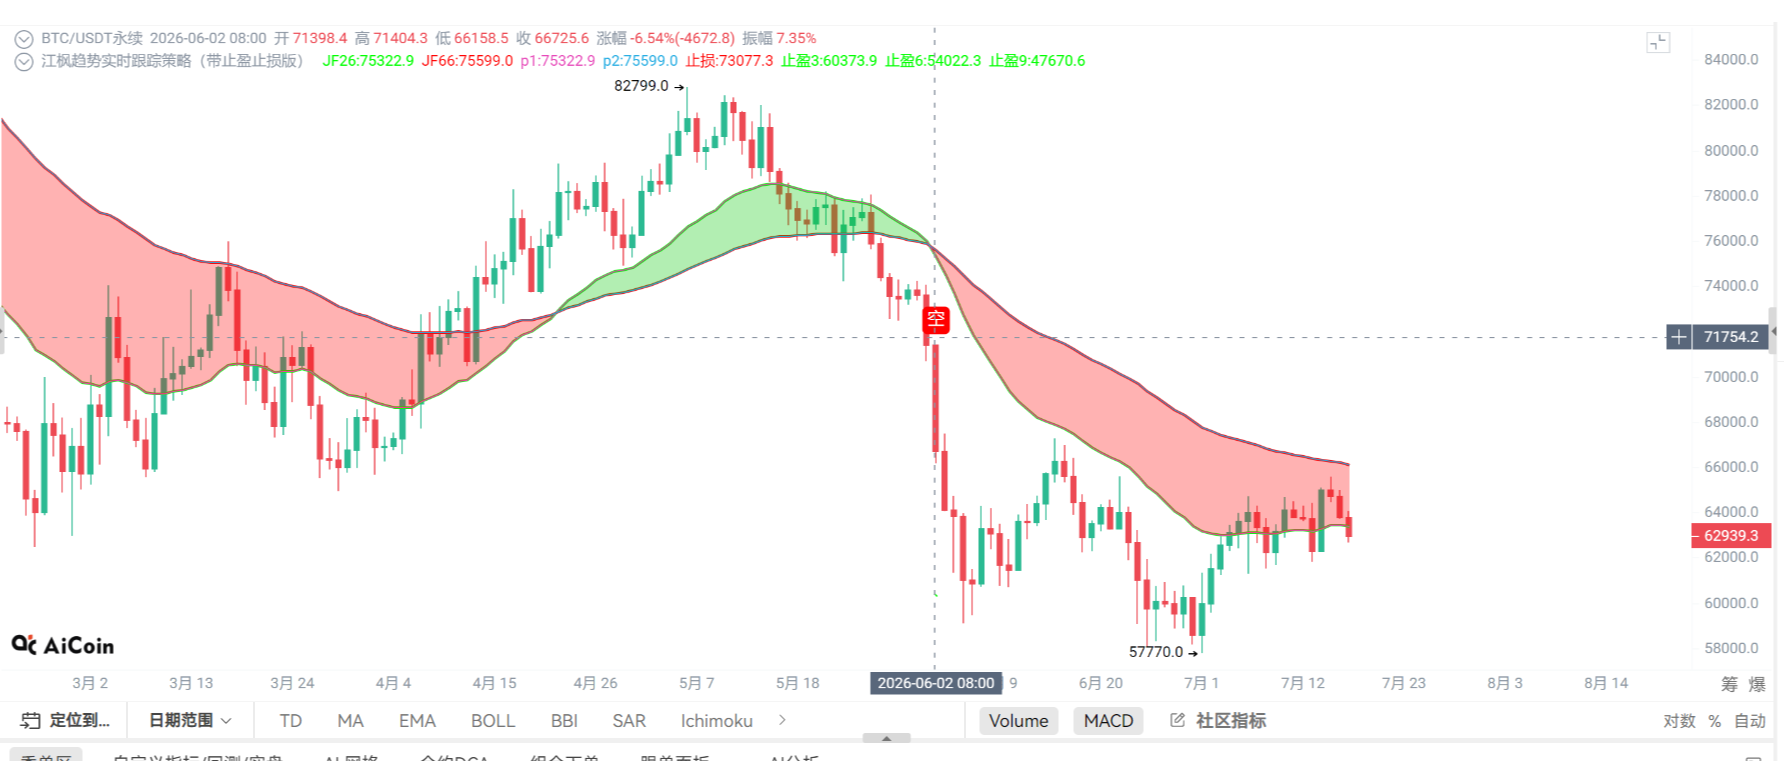
Good evening everyone, I am Xinya. Did you all happily experience the two rebounds at 1975 and 72800 yesterday? Stayed up especially late last night.
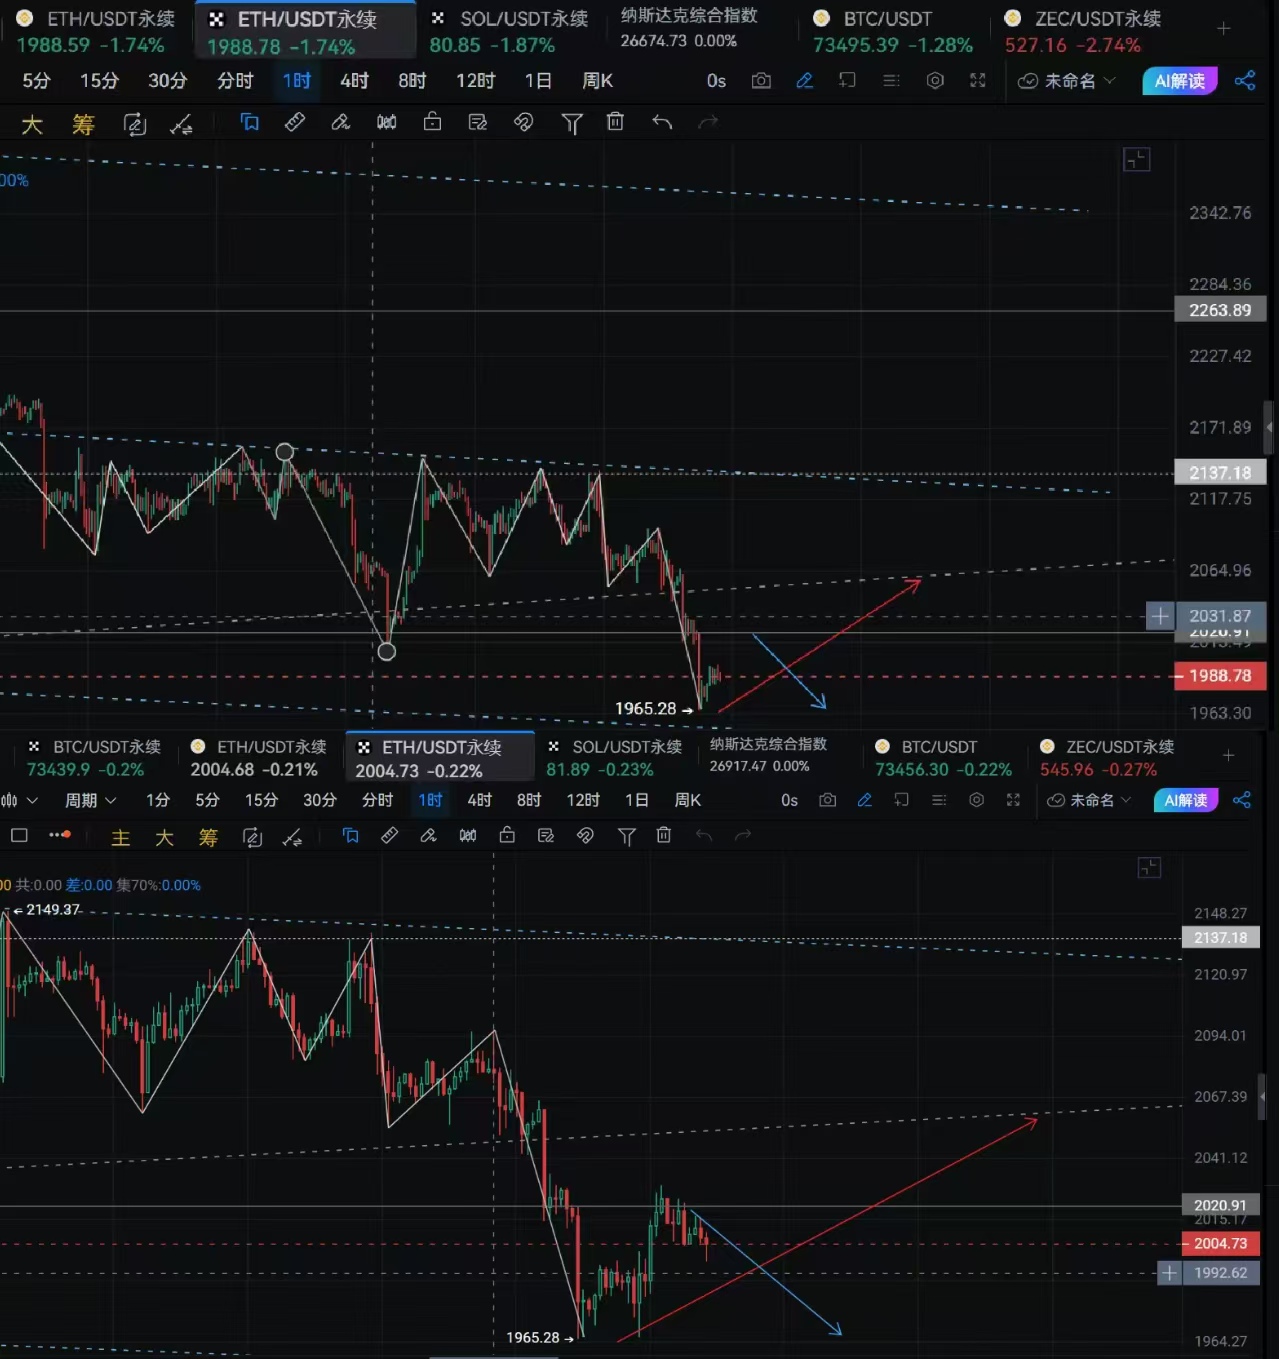
Today's update is very simple. I don't want to say too much; many experiences and methods have been shared in the messages at the bottom. The possibilities for the market are shown in the chart. The projections for the 72800 and 1975 rebounds were verified, but today's market continuation is particularly weak.
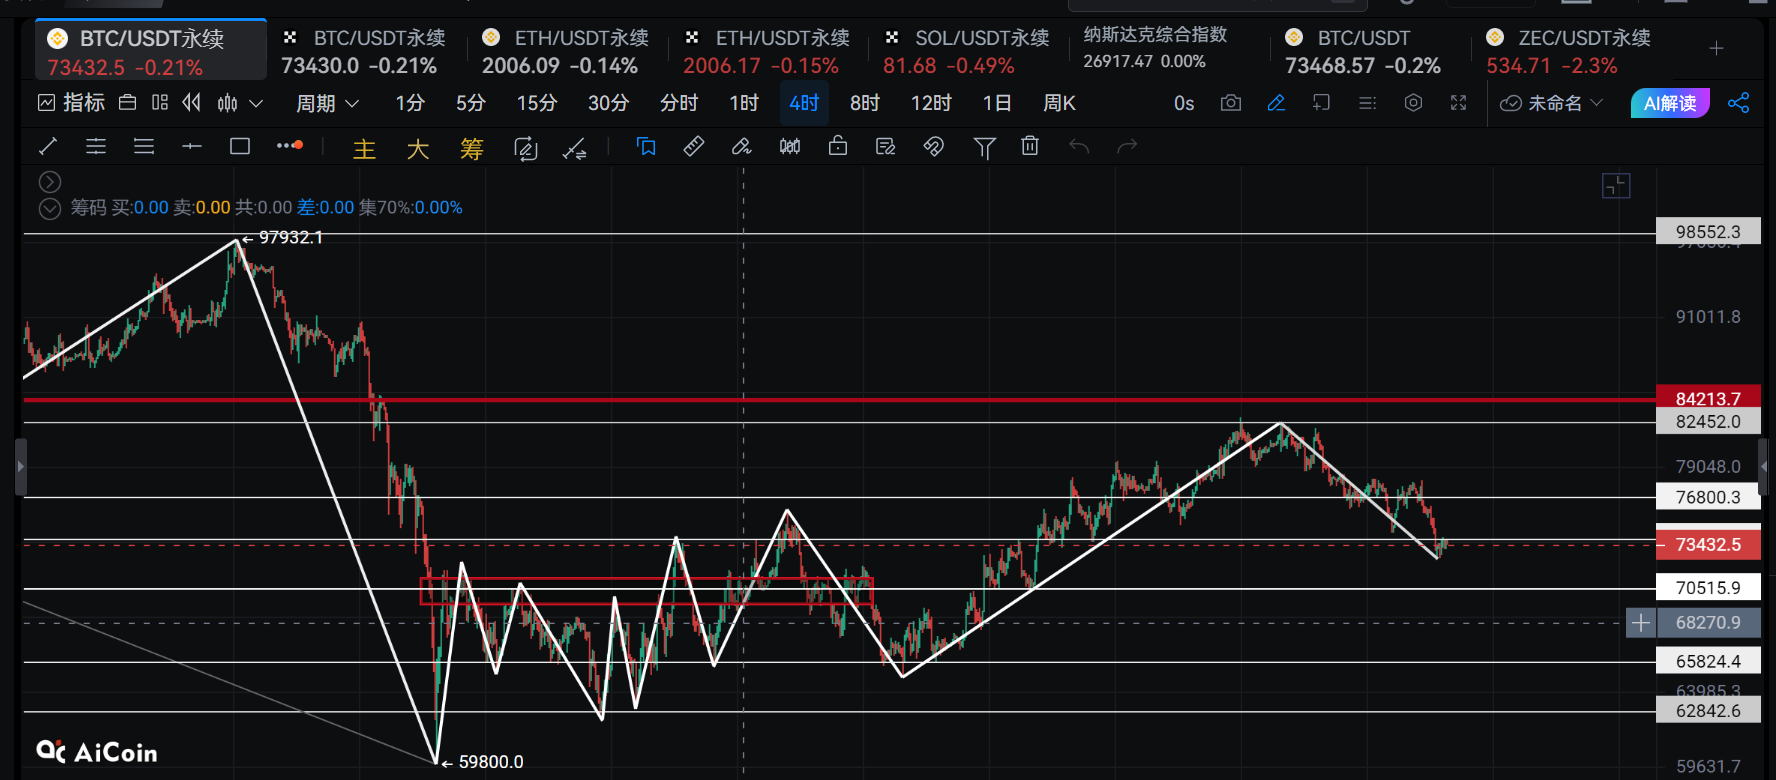
For Bitcoin, pay attention to 73800, 74200, 74500 above
and 72800, 71800, 71200 below.
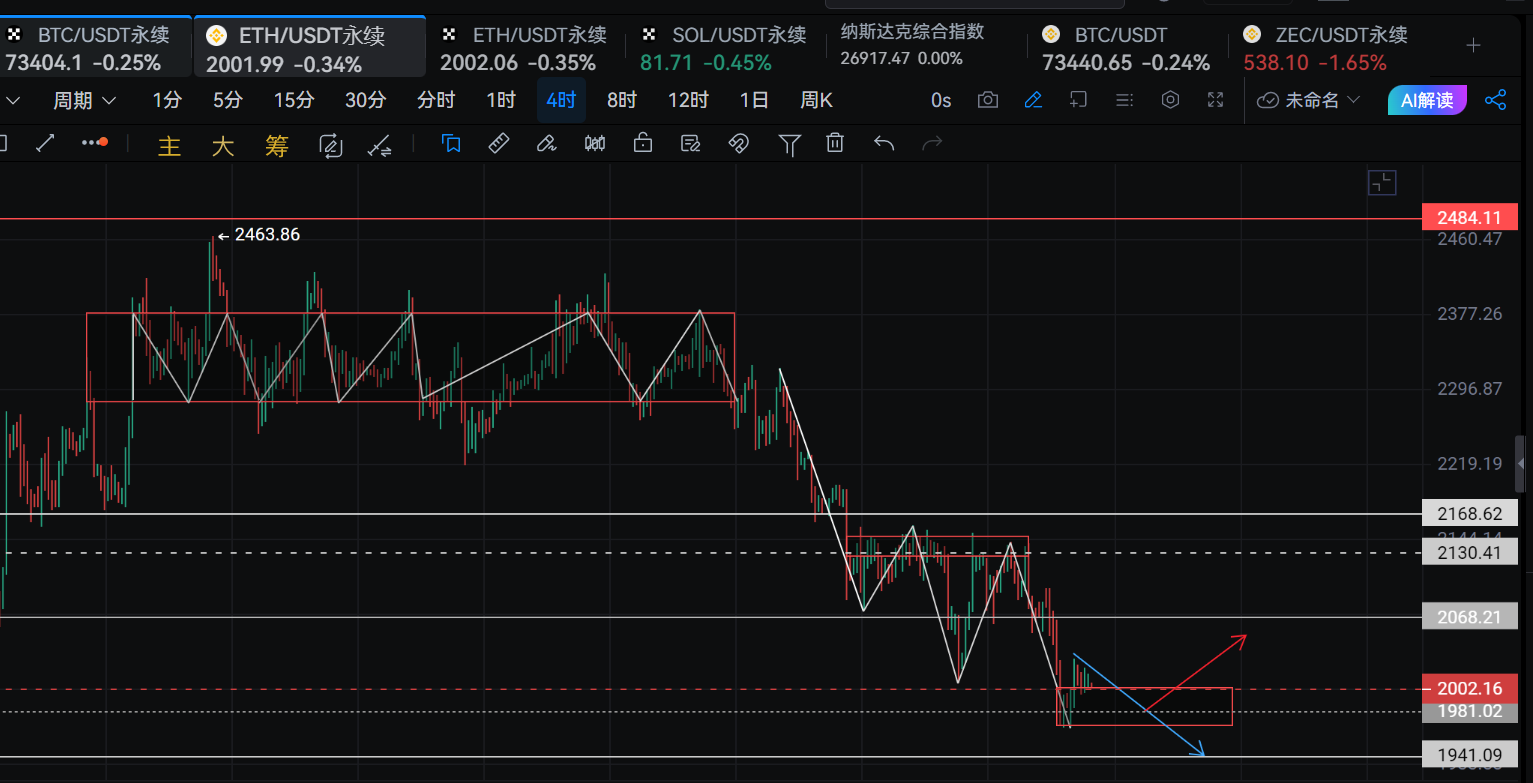
For Ethereum, pay attention to 2020, 2058 above
and 1986, 1968, 1940 below. The potential structural possibilities for the future are as follows:
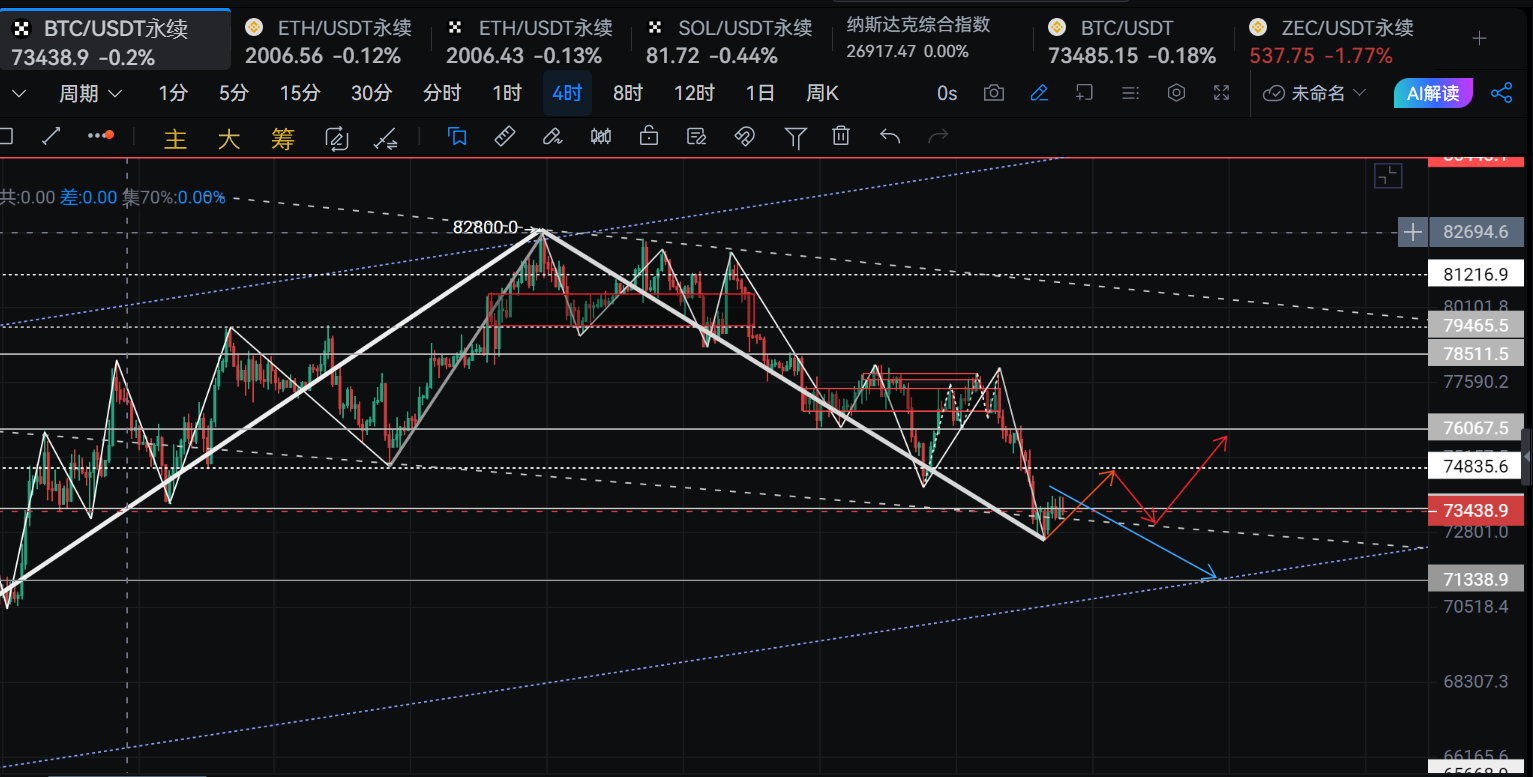
The first possibility is simply to find support and rise with the rebound, first touching 74800, then falling back to 73800, and testing 75200 again, aiming for 76000. However, today’s rebound did not hold above 74200, which is too weak, so the probability is low.
The second possibility involves pressing down from 73800 for a while, then finding support to rebound and retest. If weak, it retests 73500; if strong, retests 74200; subsequently moving to test the lower trend channel from February, around 71200-71500. It could stop at 71800.
Because on a larger scale, we can see that Bitcoin seems to not have finished falling, looking for a level to build a bottom before starting a main upward wave. However, at this position, even if it rebounds, it is difficult to stabilize; pulling back the fist and then swinging out again is most powerful. The continuous falling process has people trying to catch the bottom, and the collision of cycles leads to a very torturous market.
There are two possibilities for Ethereum, but they are prone to change.
The first possibility is a downward movement, starting around 1965 with a central oscillation expanding into a new center, not breaking below 1940. The oscillation core area is expected to range from 1968 to 2006, with structural expansion to 1932-2040. This process can directly encounter resistance at the potential center, leading to a decent rebound that tests around 2050-2068.
The second possibility is to penetrate the potential center and test the lowest level around 1936 at the end of March. After a consolidation in the market, a new round of movements may begin.
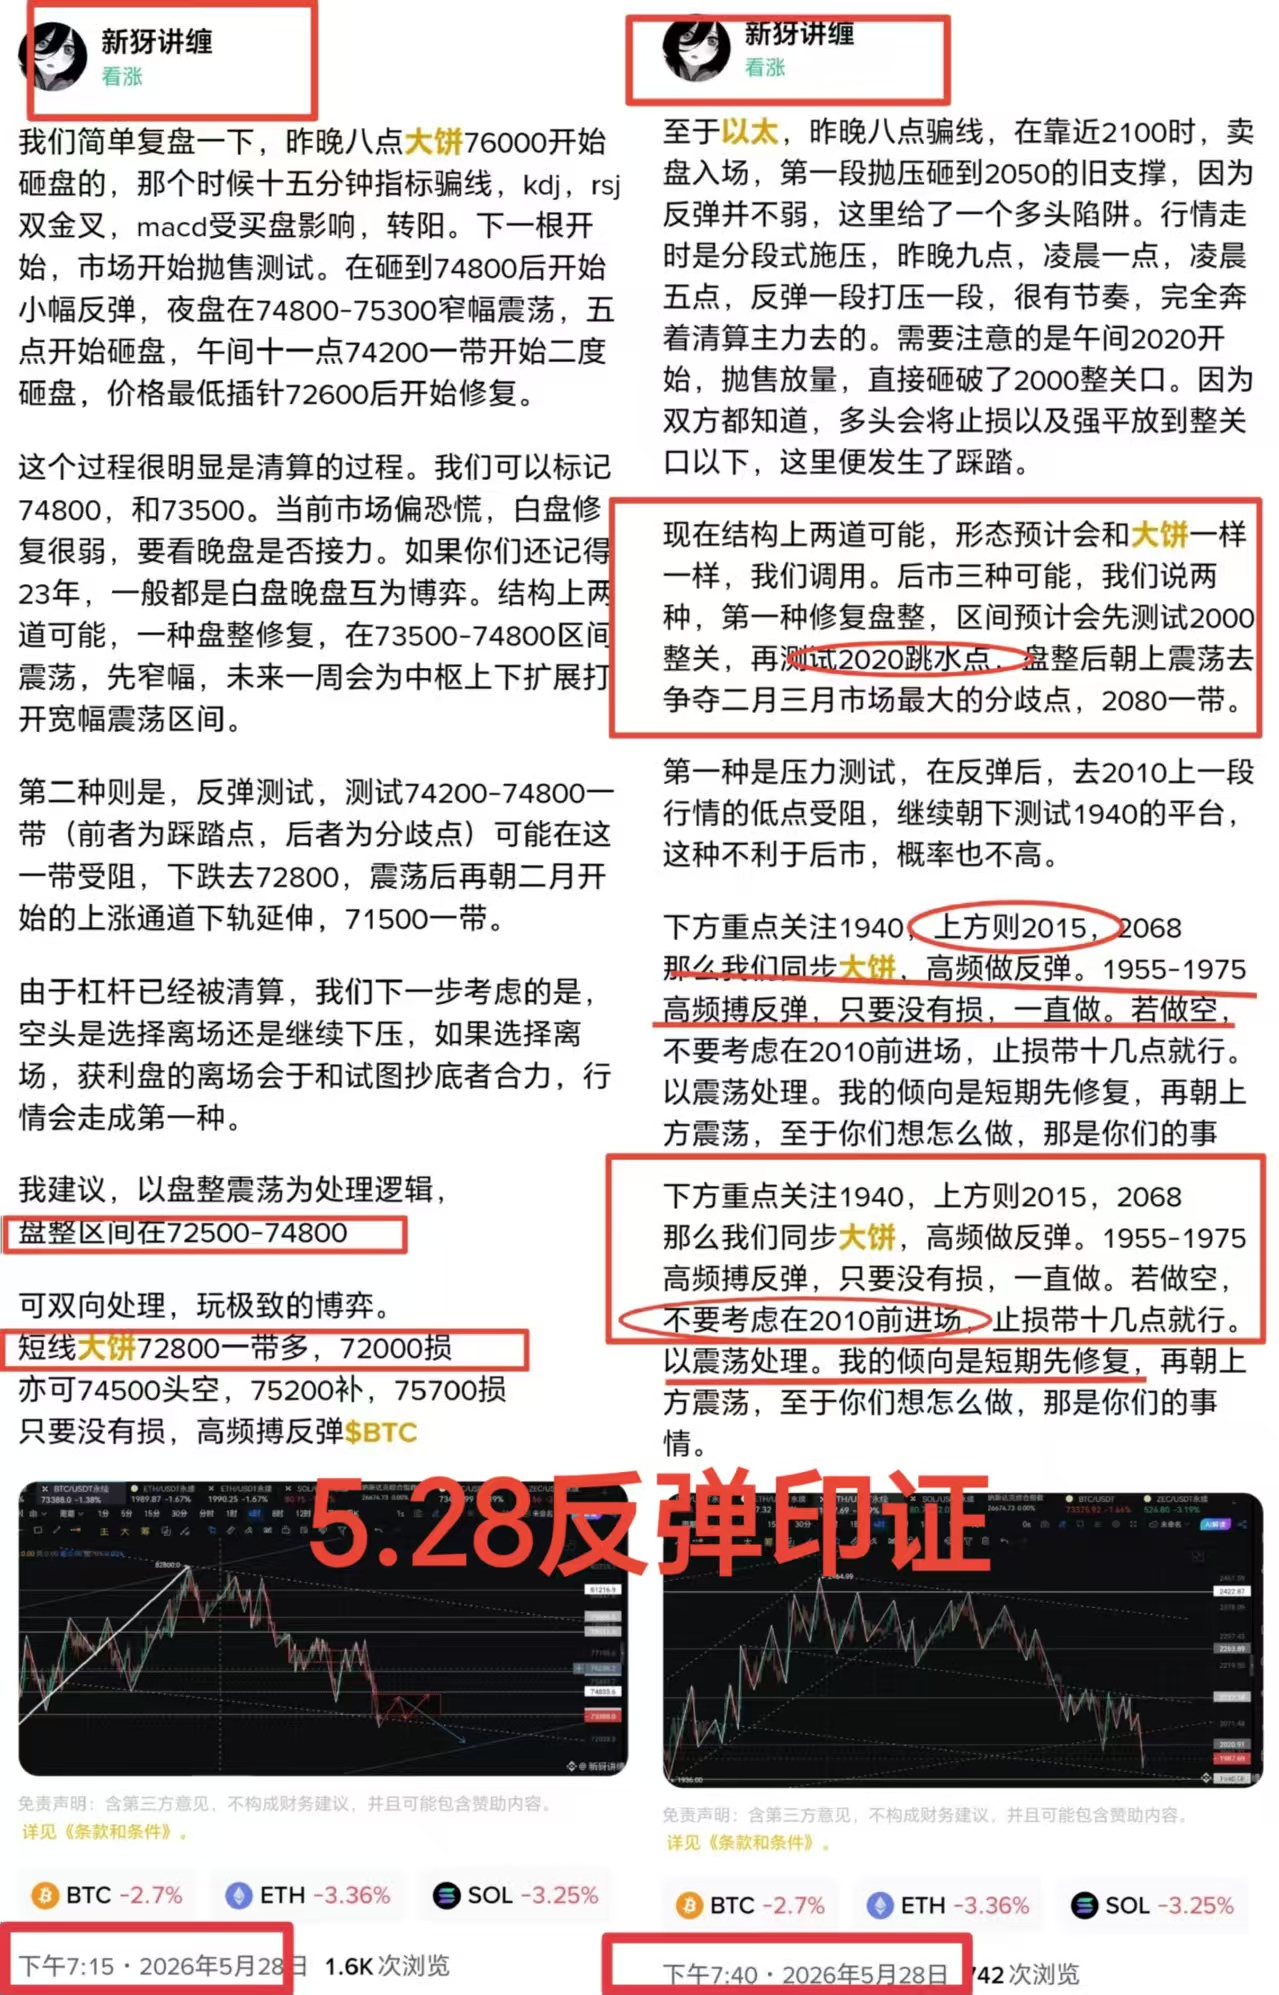
Currently, we have short positions at Bitcoin 73800 and an average price of 2015. I have mentioned this during noon and the afternoon. The future market is expected to oscillate with a bearish tendency; the structure is too prone to change, so please consider each position I’ve given and handle it on your own. Leave a range for averaging down that allows for easy withdrawal. Carry a stop-loss that is acceptable. If entering at a divergence point, the stop-loss can be lighter.
Follow me for synchronized entry and exit information: Xinya Talks About Trading

免责声明:本文章仅代表作者个人观点,不代表本平台的立场和观点。本文章仅供信息分享,不构成对任何人的任何投资建议。用户与作者之间的任何争议,与本平台无关。如网页中刊载的文章或图片涉及侵权,请提供相关的权利证明和身份证明发送邮件到support@aicoin.com,本平台相关工作人员将会进行核查。