Many people often feel that writing indicators is a task for programmers; in fact, there is no need to be afraid. As long as you follow the steps, even with zero basics, you can write your own trading indicators by hand and turn your trading logic into tools for automatic reminders and execution.
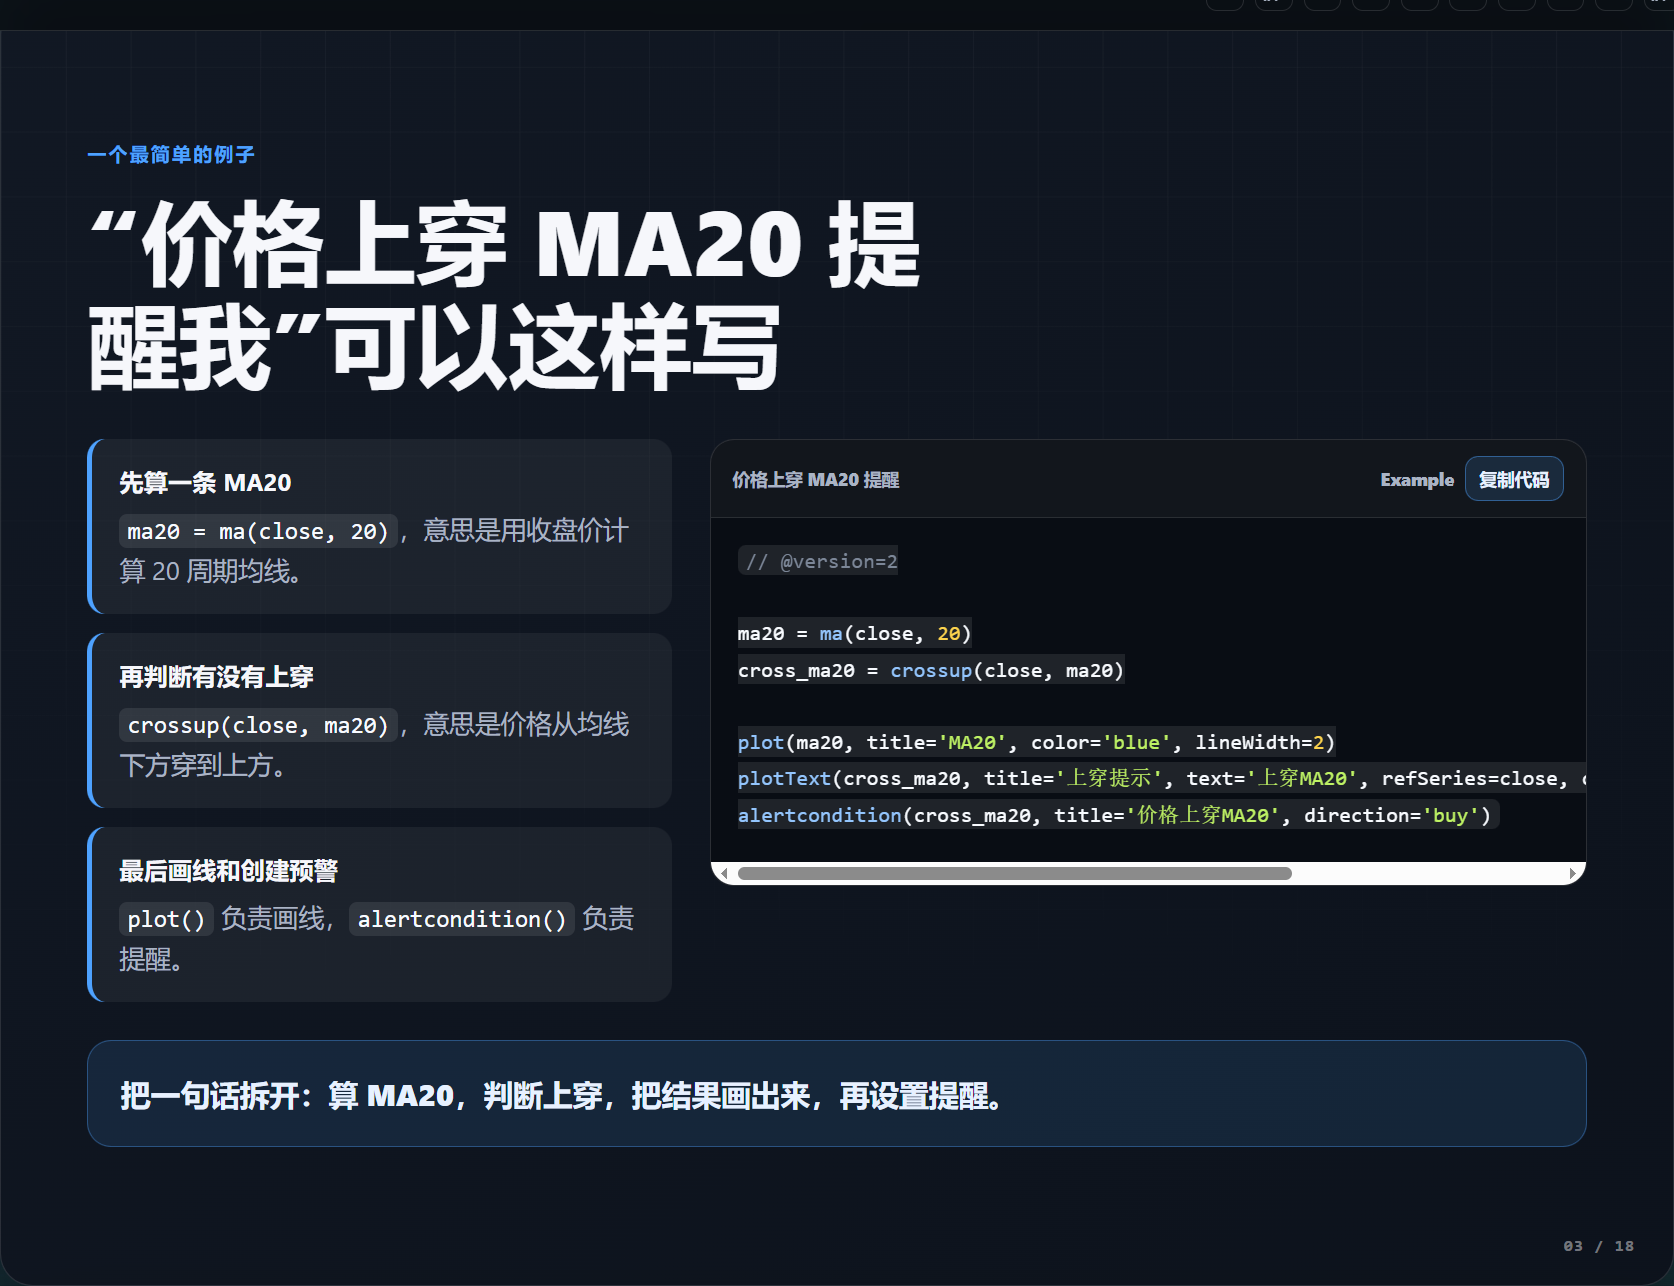
 We will start with the simplest example: writing a commonly used “price crosses above the 20-day moving average reminder.” First, we need two core functions:
 MA is the moving average function, MA(close,20) represents the 20-day moving average calculated using the closing price; cross_up is the crossing up function, cross_up(close,MA(close,20)) means that the closing price crosses above the 20-day moving average. Just calculating is not enough; we need to plot the result on the candlestick chart, which requires the use of the plot function. It can set the title, color, and thickness of the lines. For example, we can draw the 20-day moving average in blue, with a line width set to 2. Then use the plot_text function to annotate the text “Crossing MA20” at the crossing position, and finally add the alert function; as long as the conditions are triggered, the system will automatically send you a reminder. 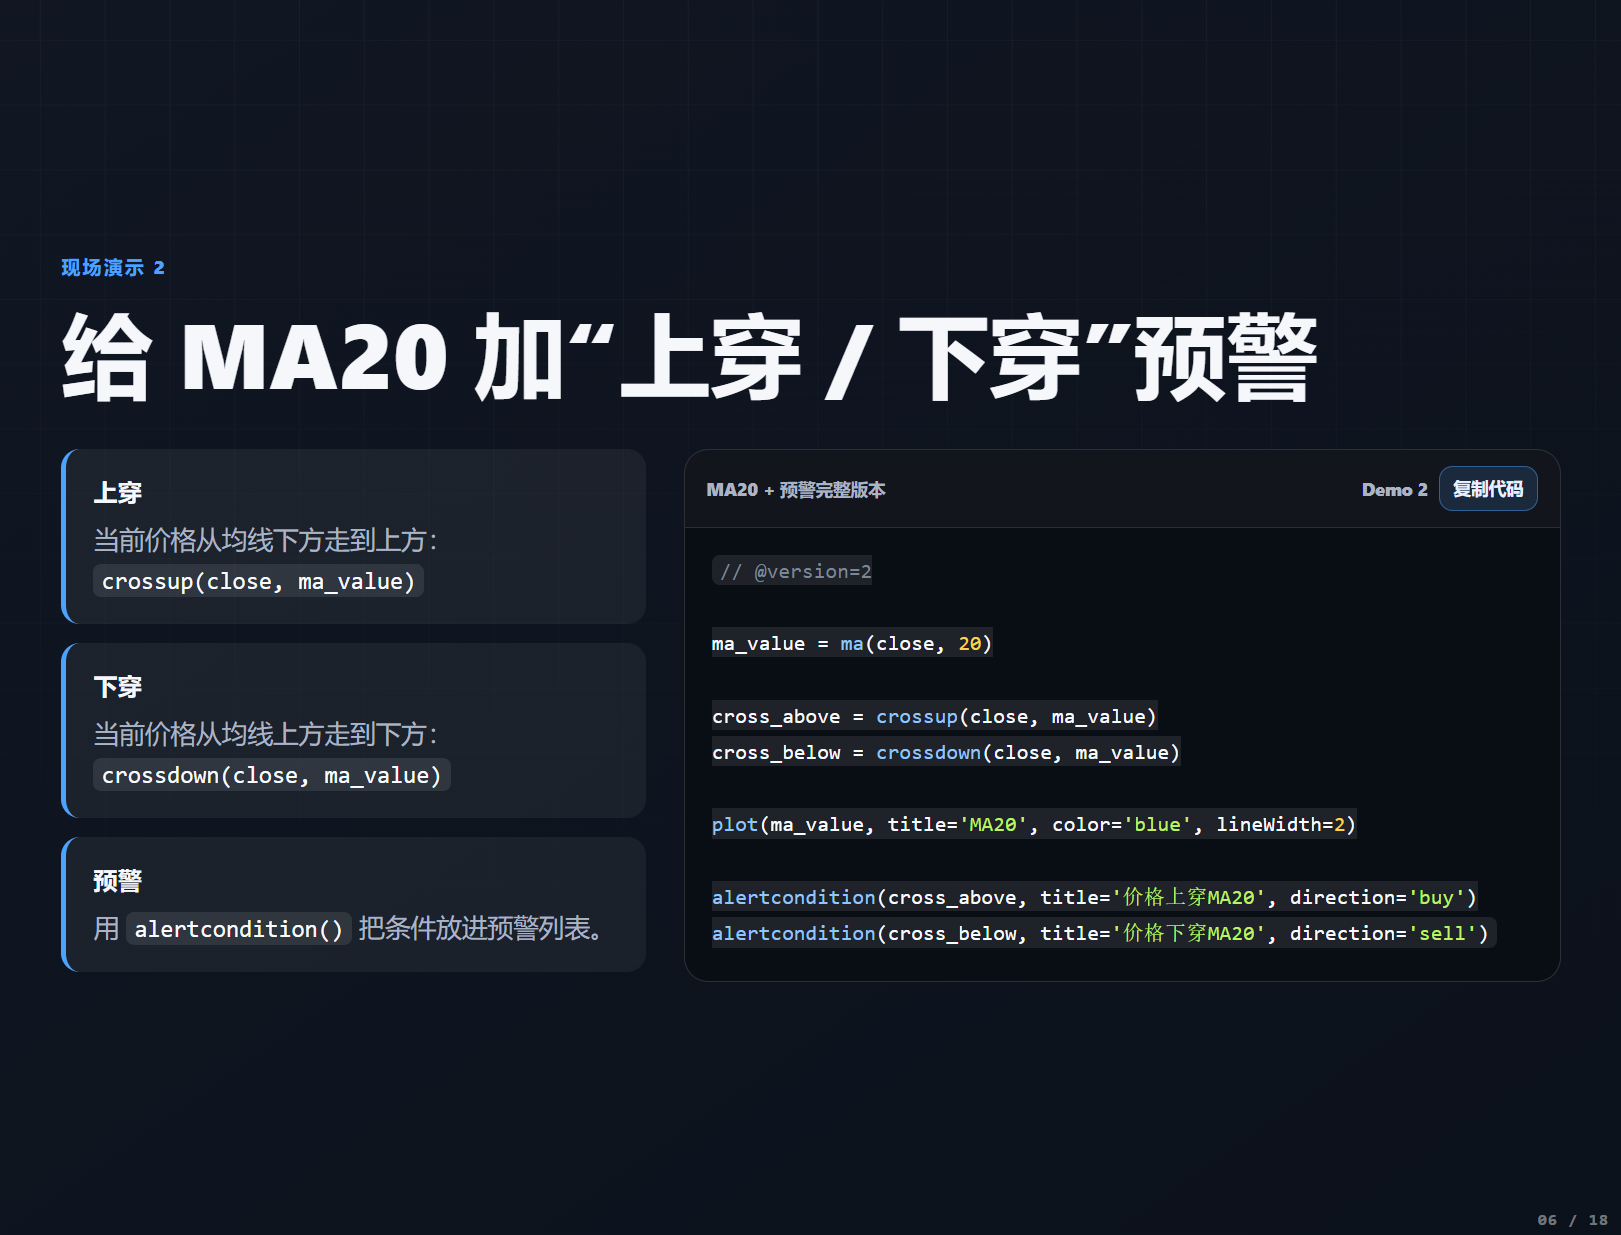
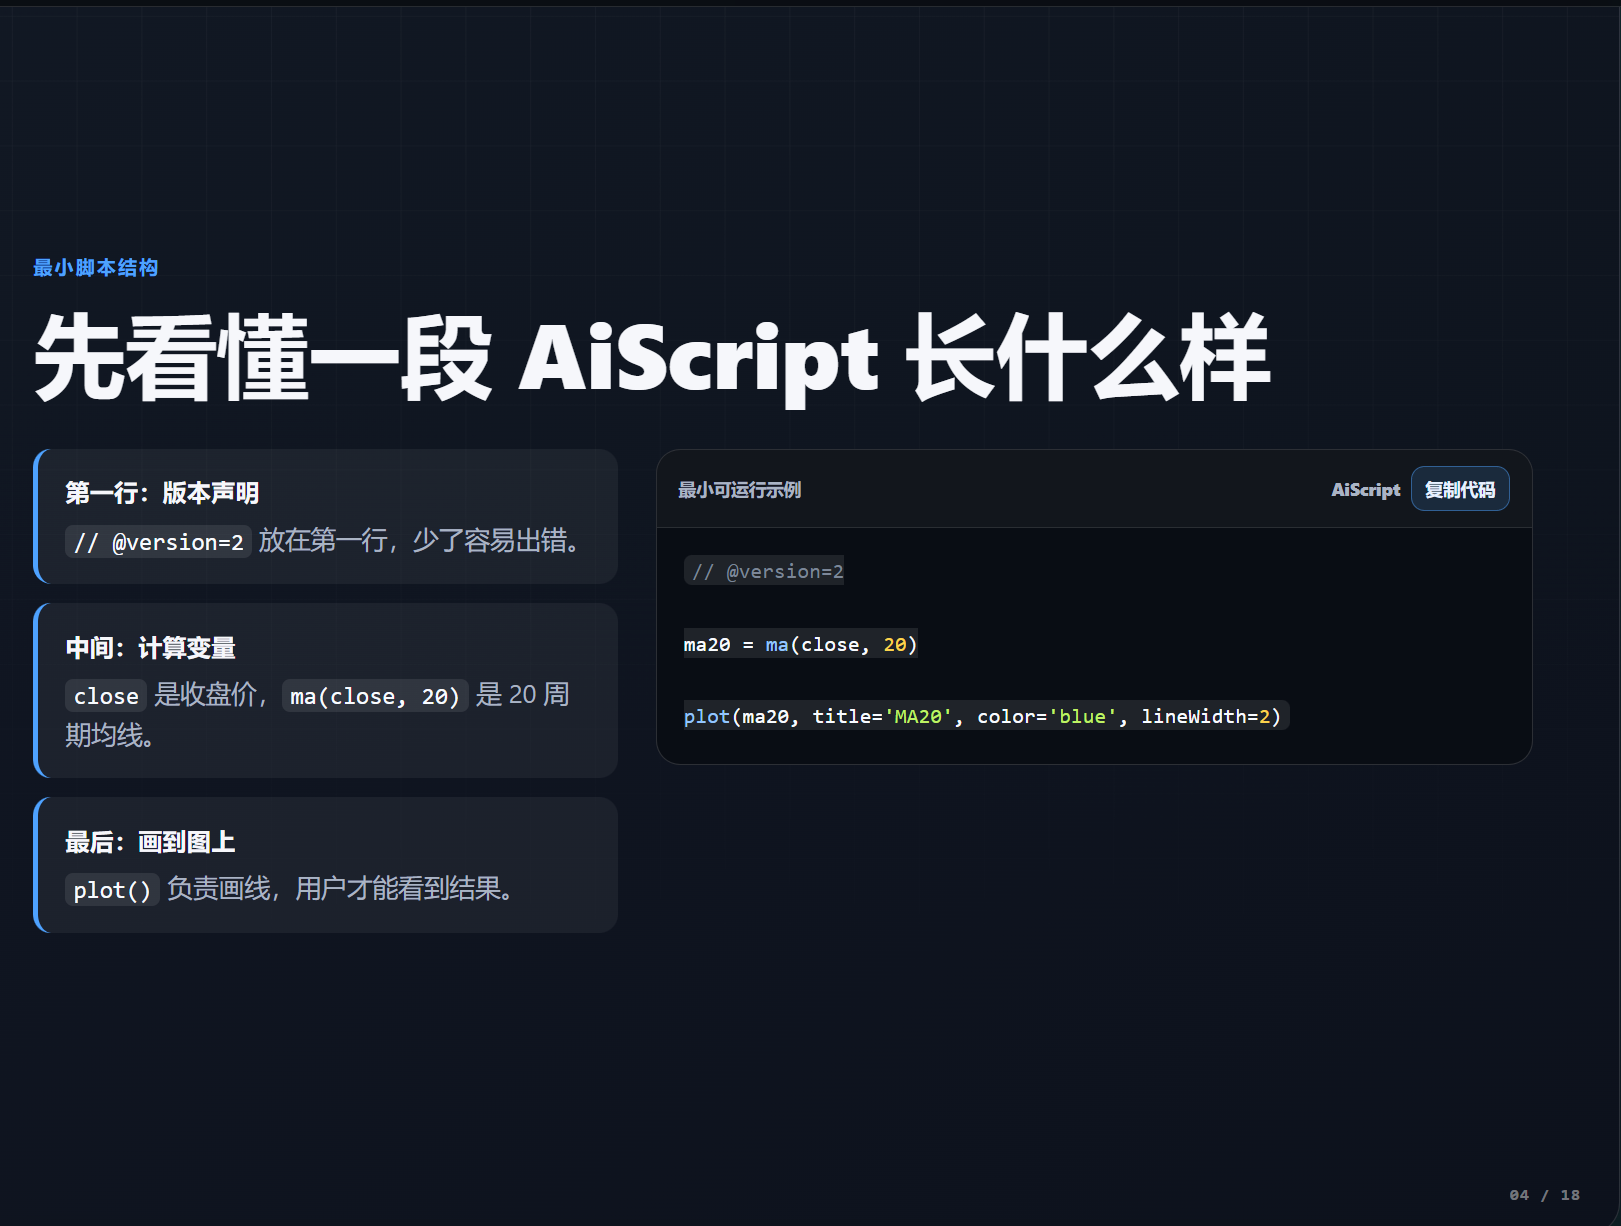
 Copy these codes into AiCoin's custom indicator editor, and you will see the blue 20-day moving average appear on the candlestick chart. Every time the price crosses above the moving average, a text reminder and alert will pop up. This indicator is very useful in trending markets, but in a sideways market, it may produce false signals. Later, we can add more conditions to filter, such as overlaying a 30-day moving average, so that the signal is triggered only when both moving averages meet the conditions simultaneously.
  The script structure for all indicators is similar, fundamentally involving three steps: first, declare the version number, which is generated by the system by default; then calculate the indicator values you need; finally, use the plotting function to draw the results on the chart. We can upgrade this a bit by writing a color-changing 20-day moving average—when the price is above the moving average, it shows green; when it's below the moving average, it shows red. This requires the use of a ternary operator, formatted as “condition ? result A : result B,” which translates to using A if the condition is met, otherwise using B. Hence, we can write
 color = close > MA20 ? #00ff00 : #ff0000, and then put this color parameter into the plotting function, so the moving average will change color automatically with the price position. 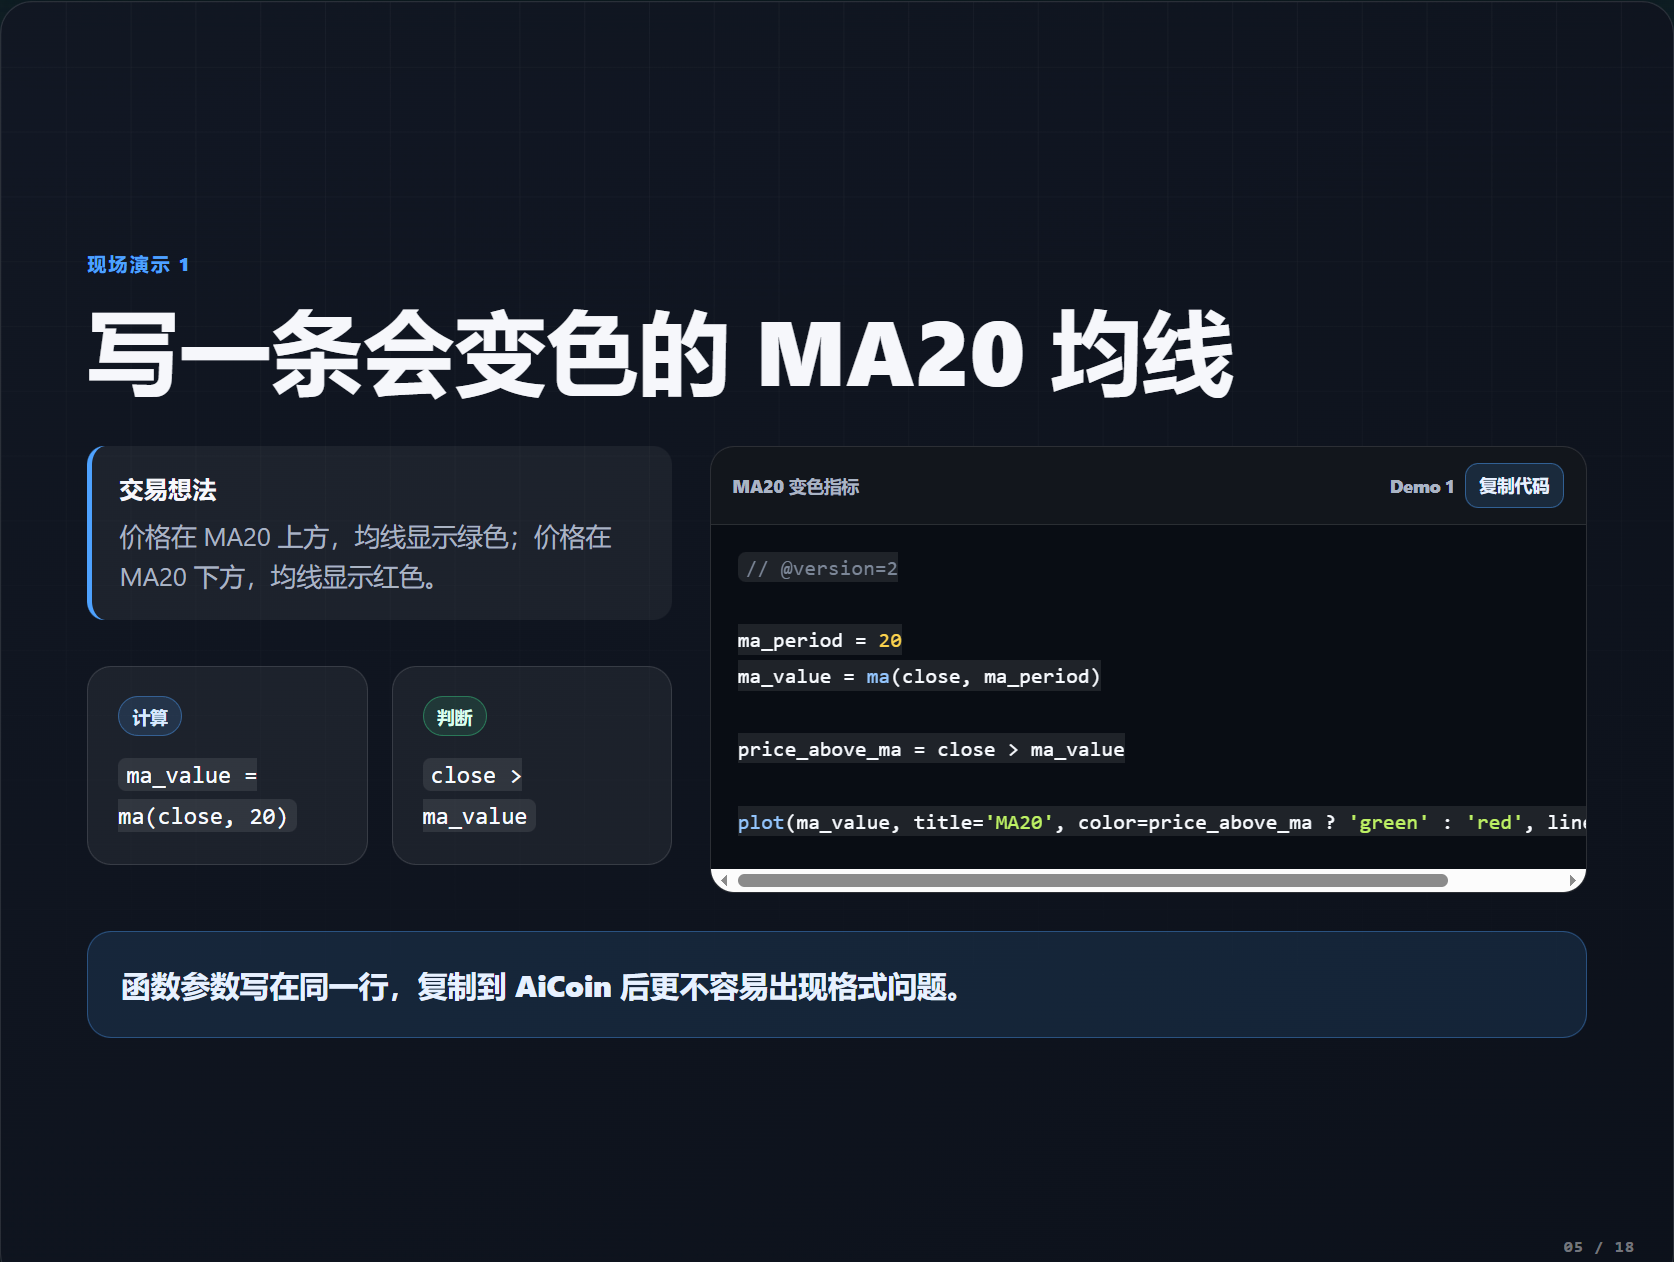
 Having learned about a single moving average, we can now write the most commonly used EMA golden cross and death cross indicators. Use EMA5 for the short-term, which reacts faster; and EMA60 for the long-term, which is more stable. When EMA5 crosses above EMA60 from below, it is a golden cross, and when it crosses below, it is a death cross—this can be easily achieved using the
 cross_up and cross_down functions. We can annotate the positions of the golden cross and death cross on the chart with arrows: drawing an upward green arrow for the golden cross and a downward red arrow for the death cross, and add corresponding alerts, allowing us to receive signals without watching the market constantly. 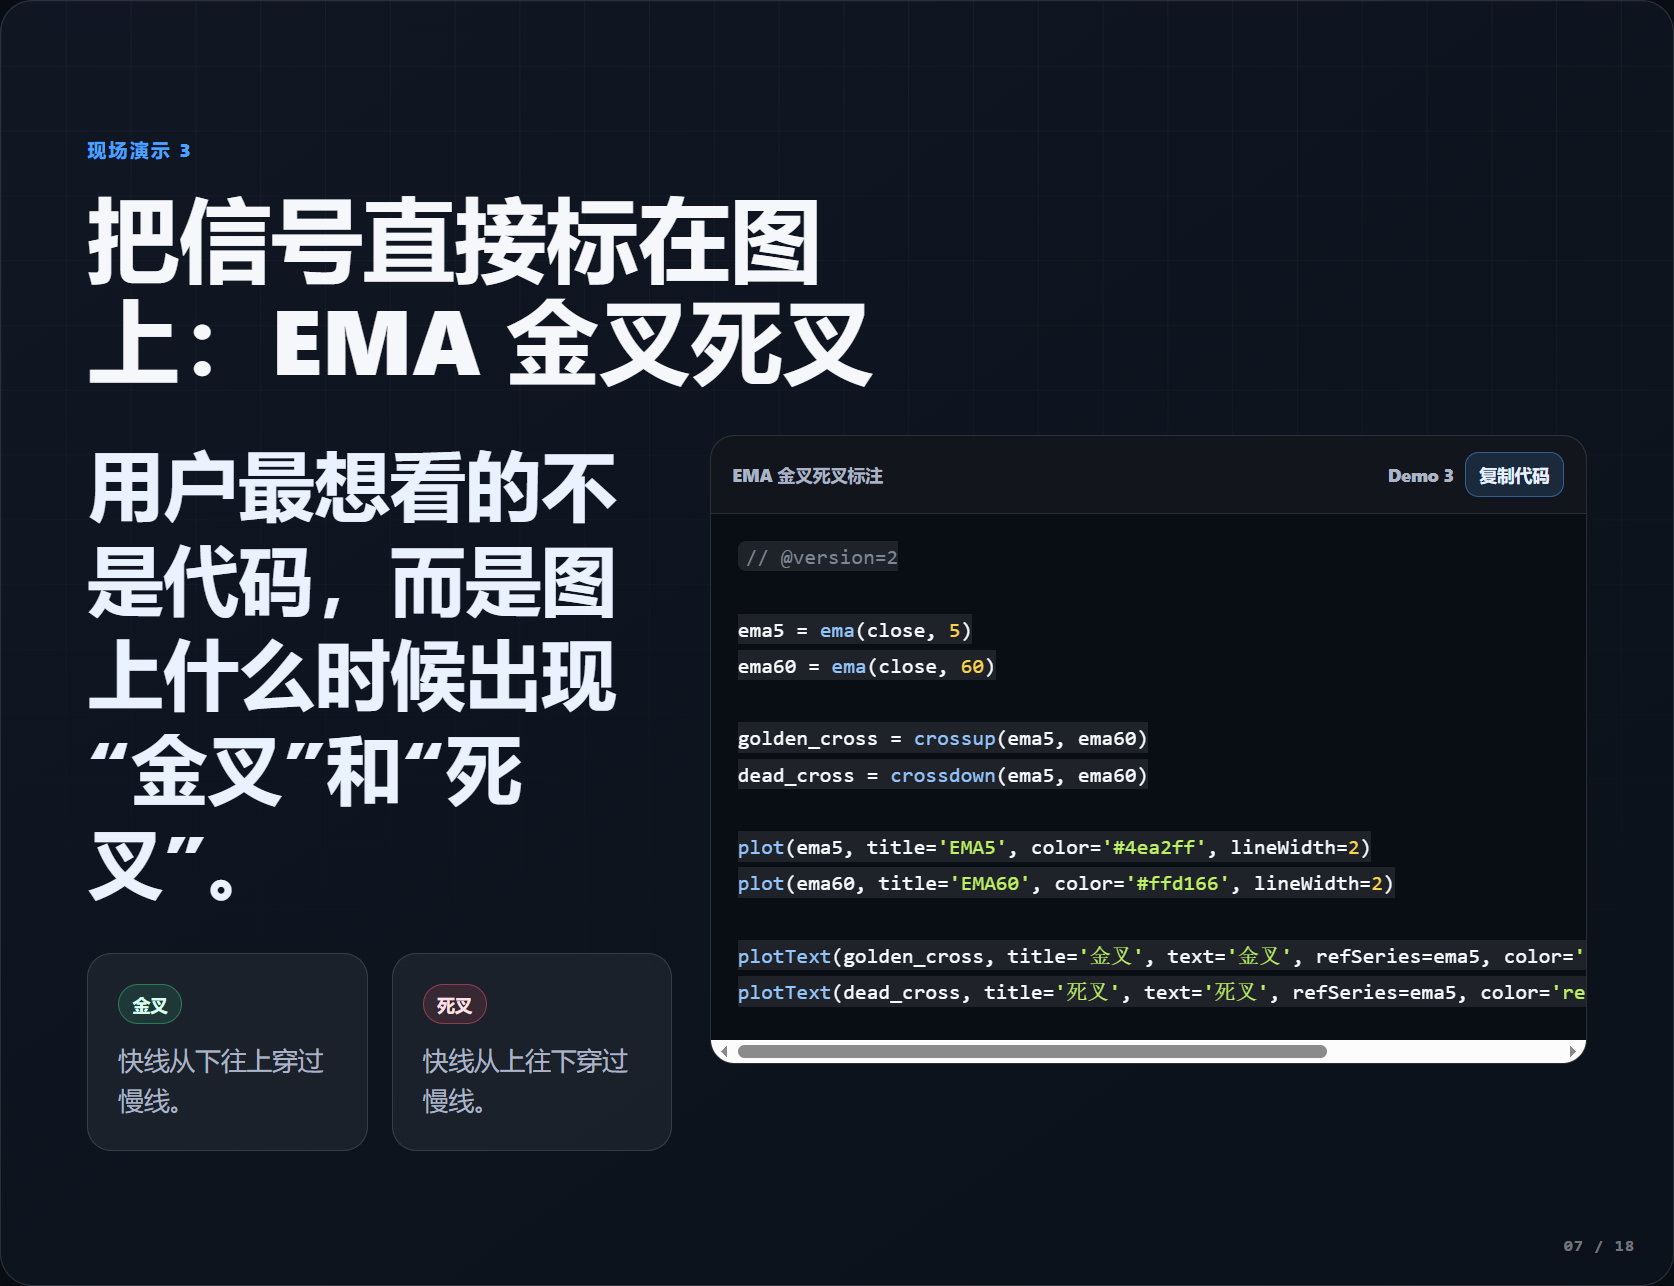 Next is the RSI indicator, which is the easiest for beginners to use. It only uses the numbers 70 and 30 to judge overbought and oversold conditions. An RSI greater than 70 indicates a hot market, signaling overbought conditions; an RSI below 30 indicates a cold market, signaling oversold conditions. The code implementation is quite simple: first use
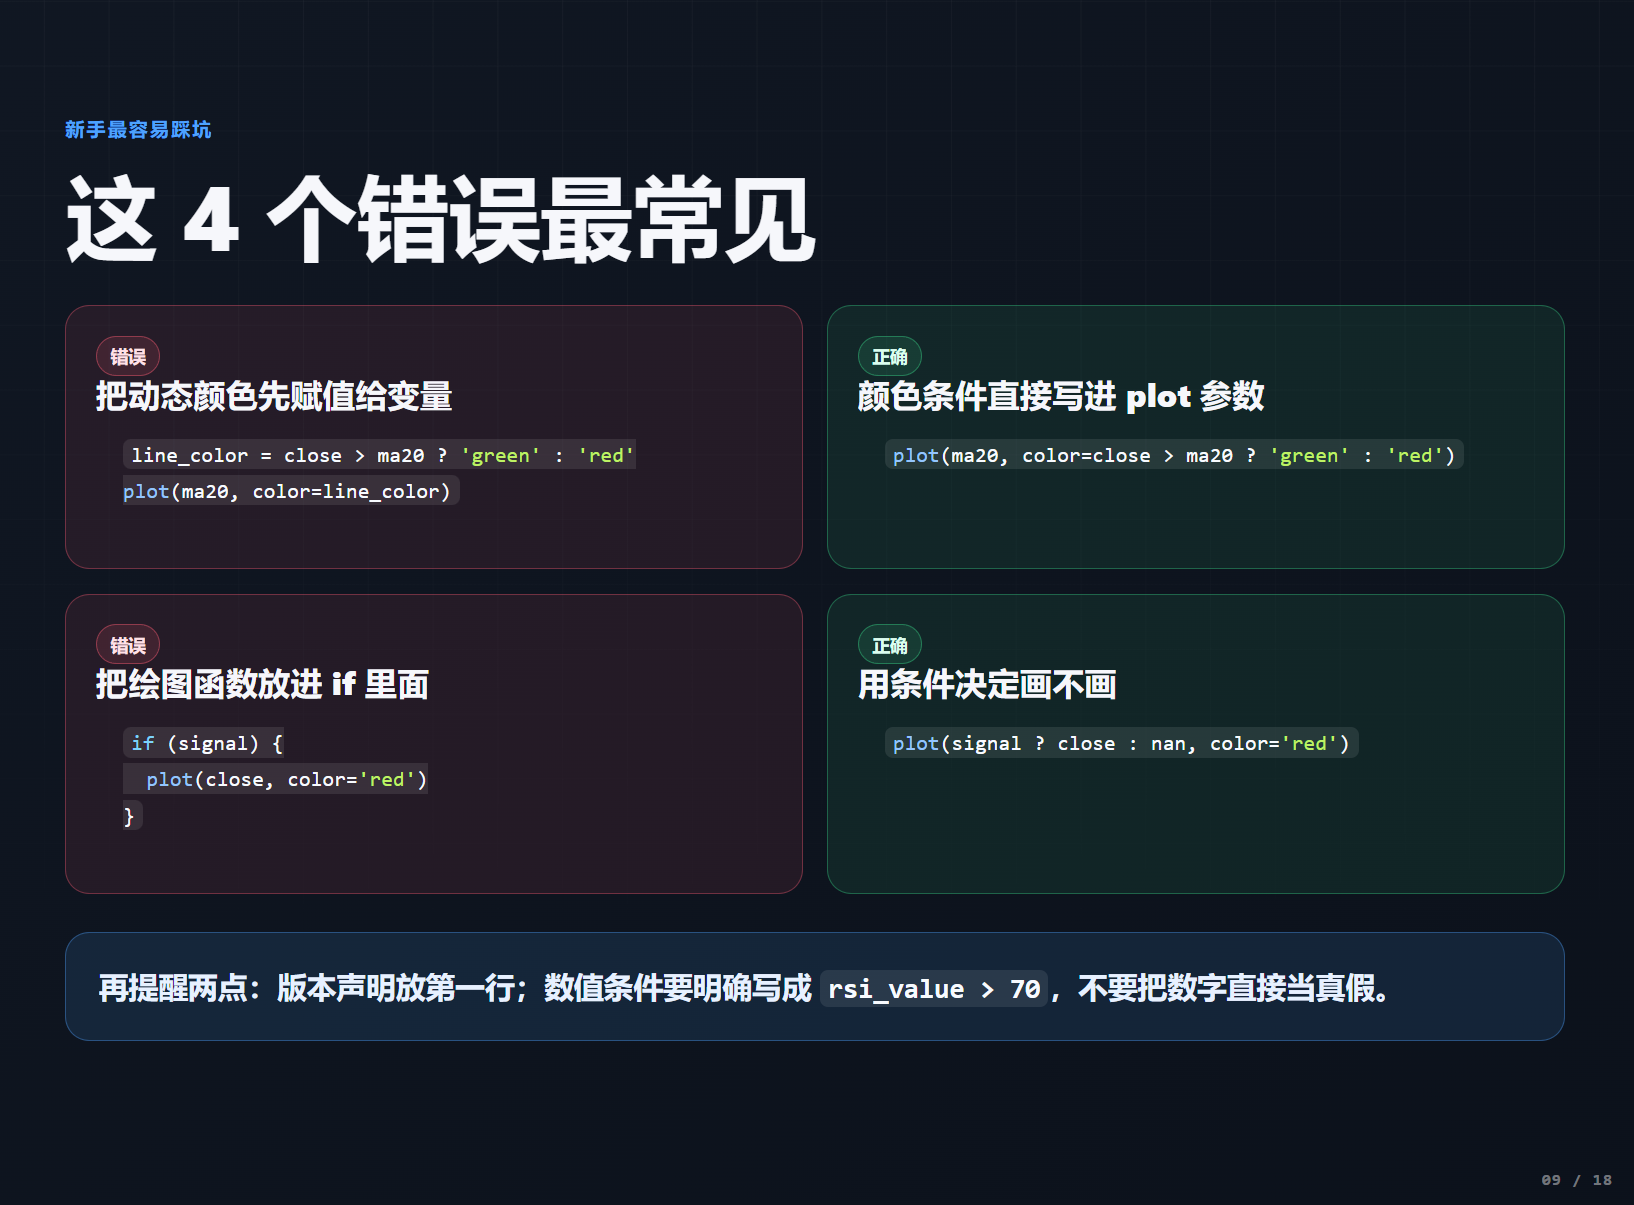
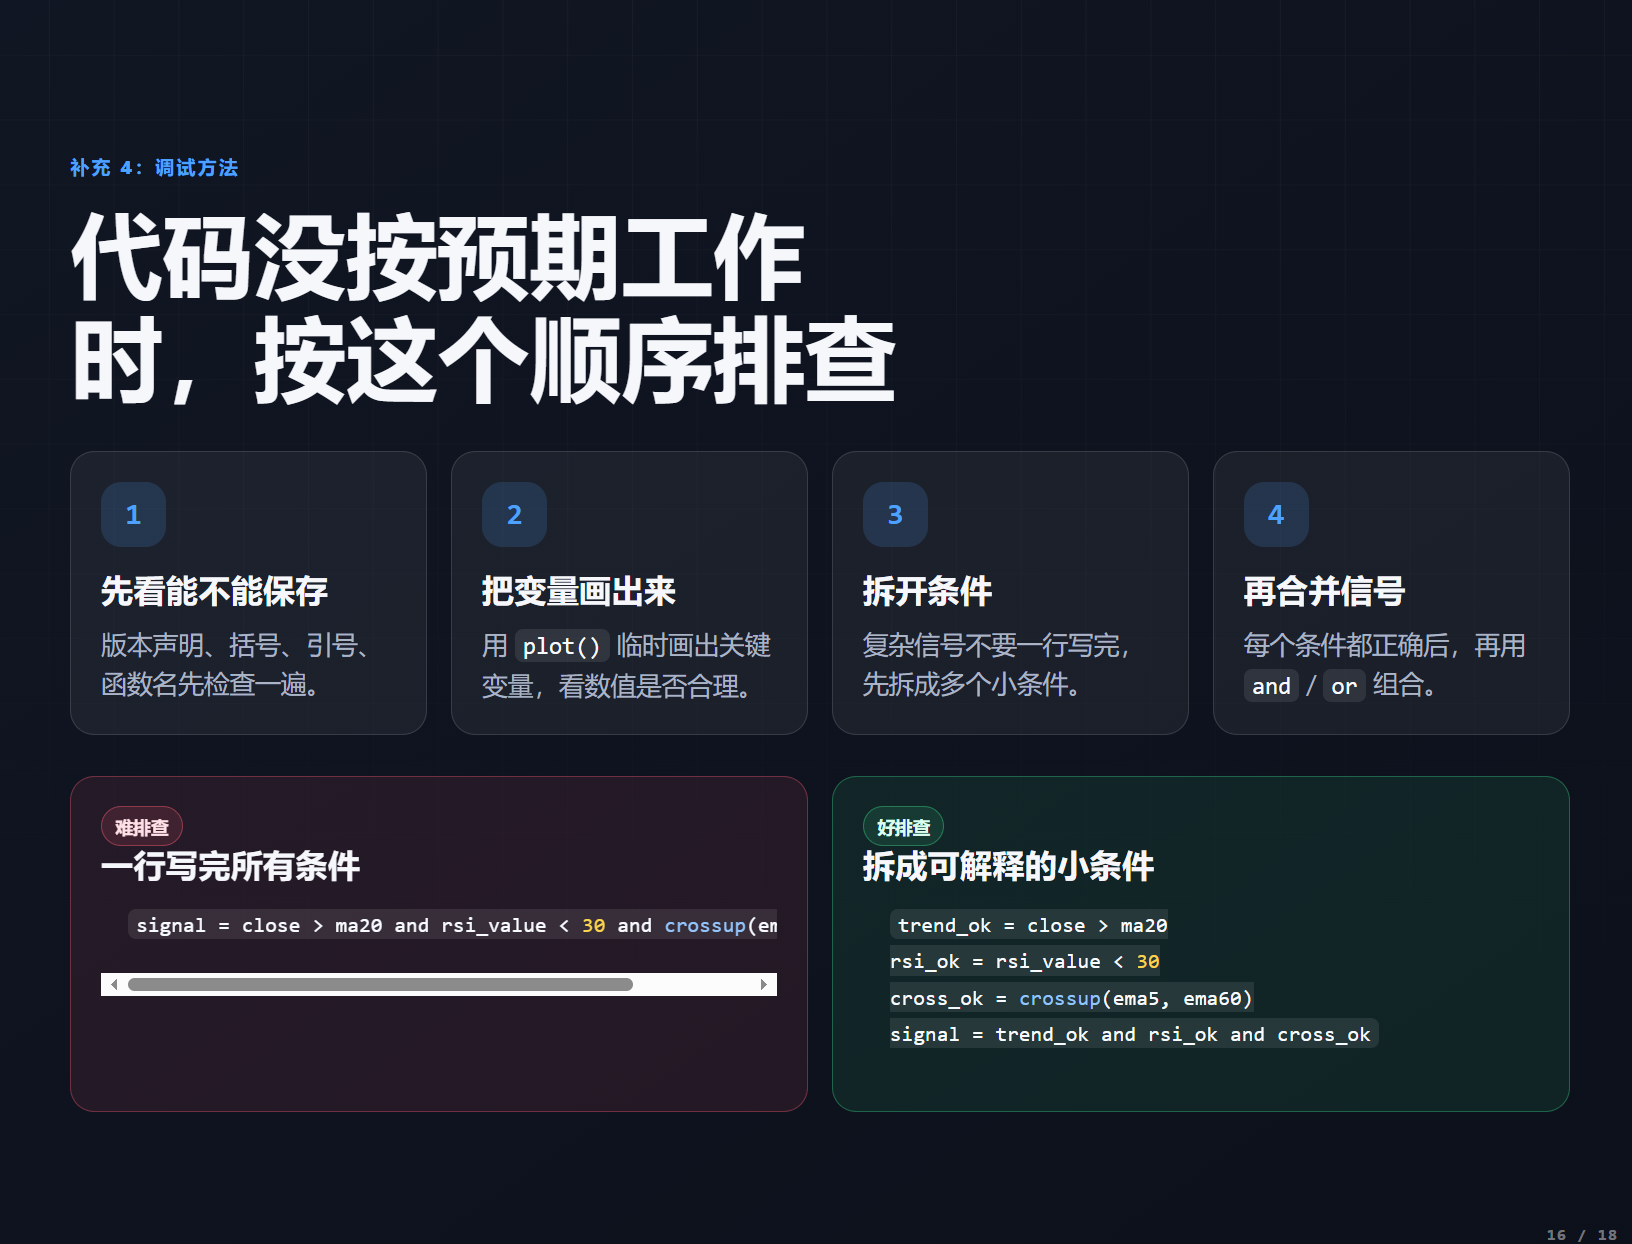
 rsi(close,14) to calculate the RSI value for a 14-period, then check if it is greater than 70 or less than 30, plot the RSI curve in the subplot, draw the reference lines at 70 and 30, and add alerts for overbought and oversold—thus completing a full RSI indicator. There’s no need to get caught up in what RSI stands for; just knowing how to use it can help us gauge market temperatures. 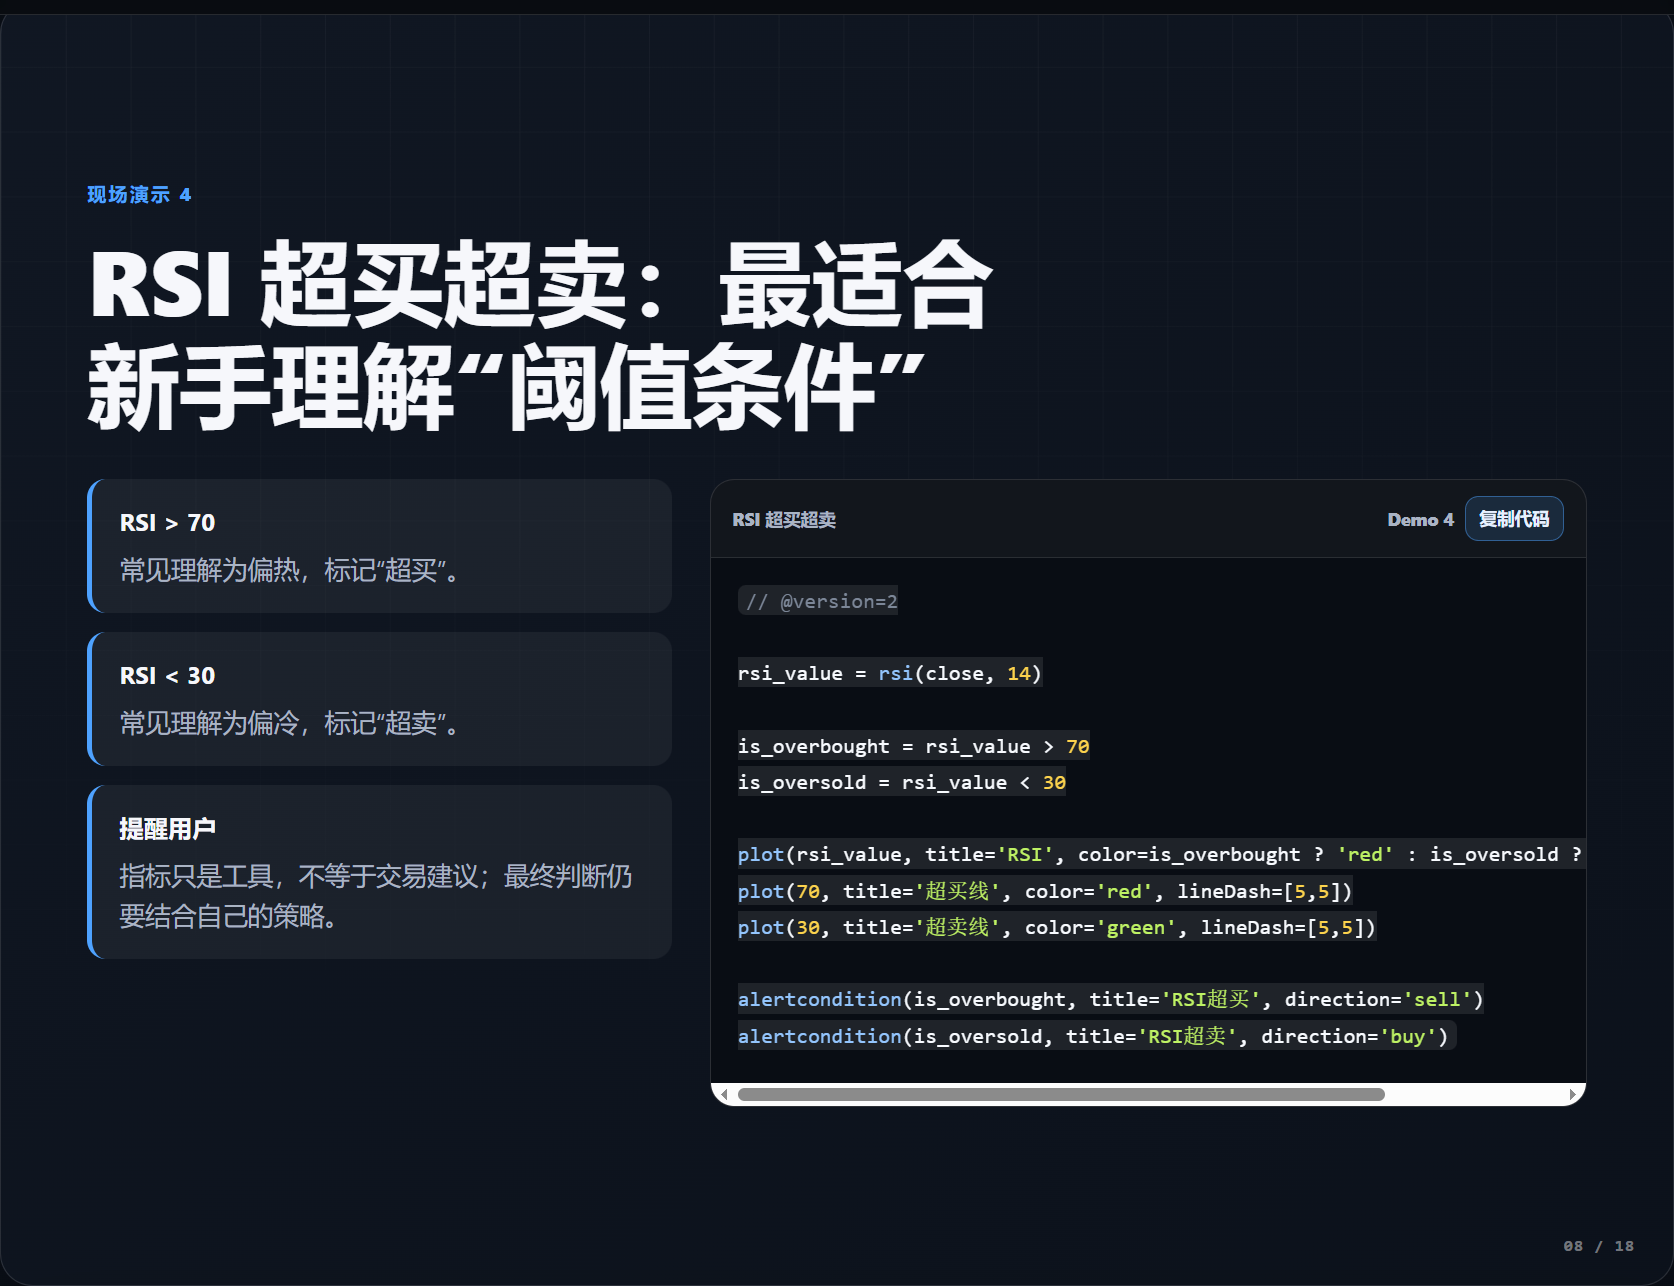 Beginners tend to make four common mistakes when writing indicators that must be avoided. The first is assigning dynamic colors to variables before putting them into the plotting function; the correct method is to write the color conditions directly in the parameters of the plotting function. The second is the misuse of the if function; frequently, a ternary operator or directly adding condition checks in the plotting function would be more concise. The third is writing multiple complex conditions in one line, making it impossible to troubleshoot later; and the fourth is not saving and testing after writing. Many syntax errors will prompt the system upon saving, helping us quickly locate the issues.
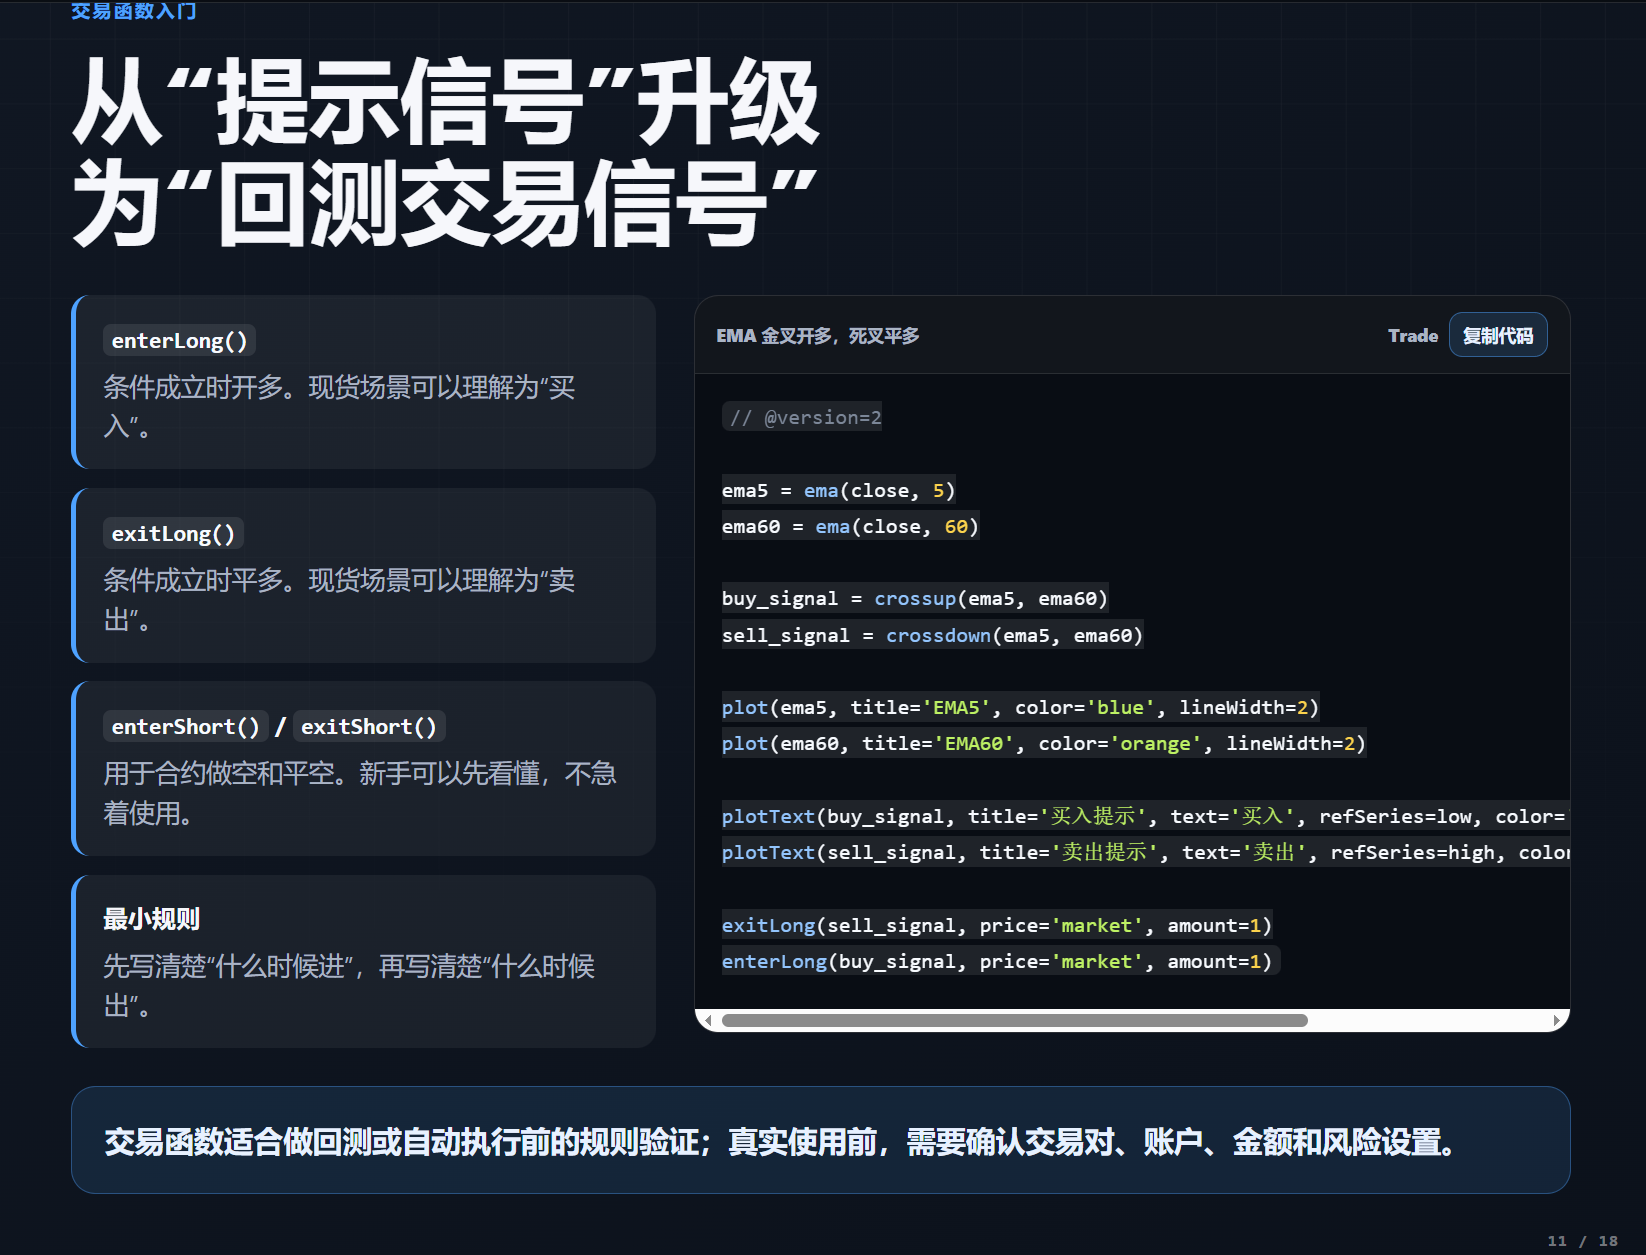
Having mastered basic signals and plotting, we can progress to learning trading functions, which are the core of automated trading. There are four commonly used trading functions: enter_long for entering long positions, exit_long for closing long positions, enter_short for entering short positions, and exit_short for closing short positions. Still using the EMA golden cross and death cross example, trigger enter_long when the golden cross occurs and exit_long when the death cross occurs. Adding these functions to the code and linking it to your trading account, while keeping the AiCoin client and internet operational, will allow the system to automatically execute buy and sell operations. 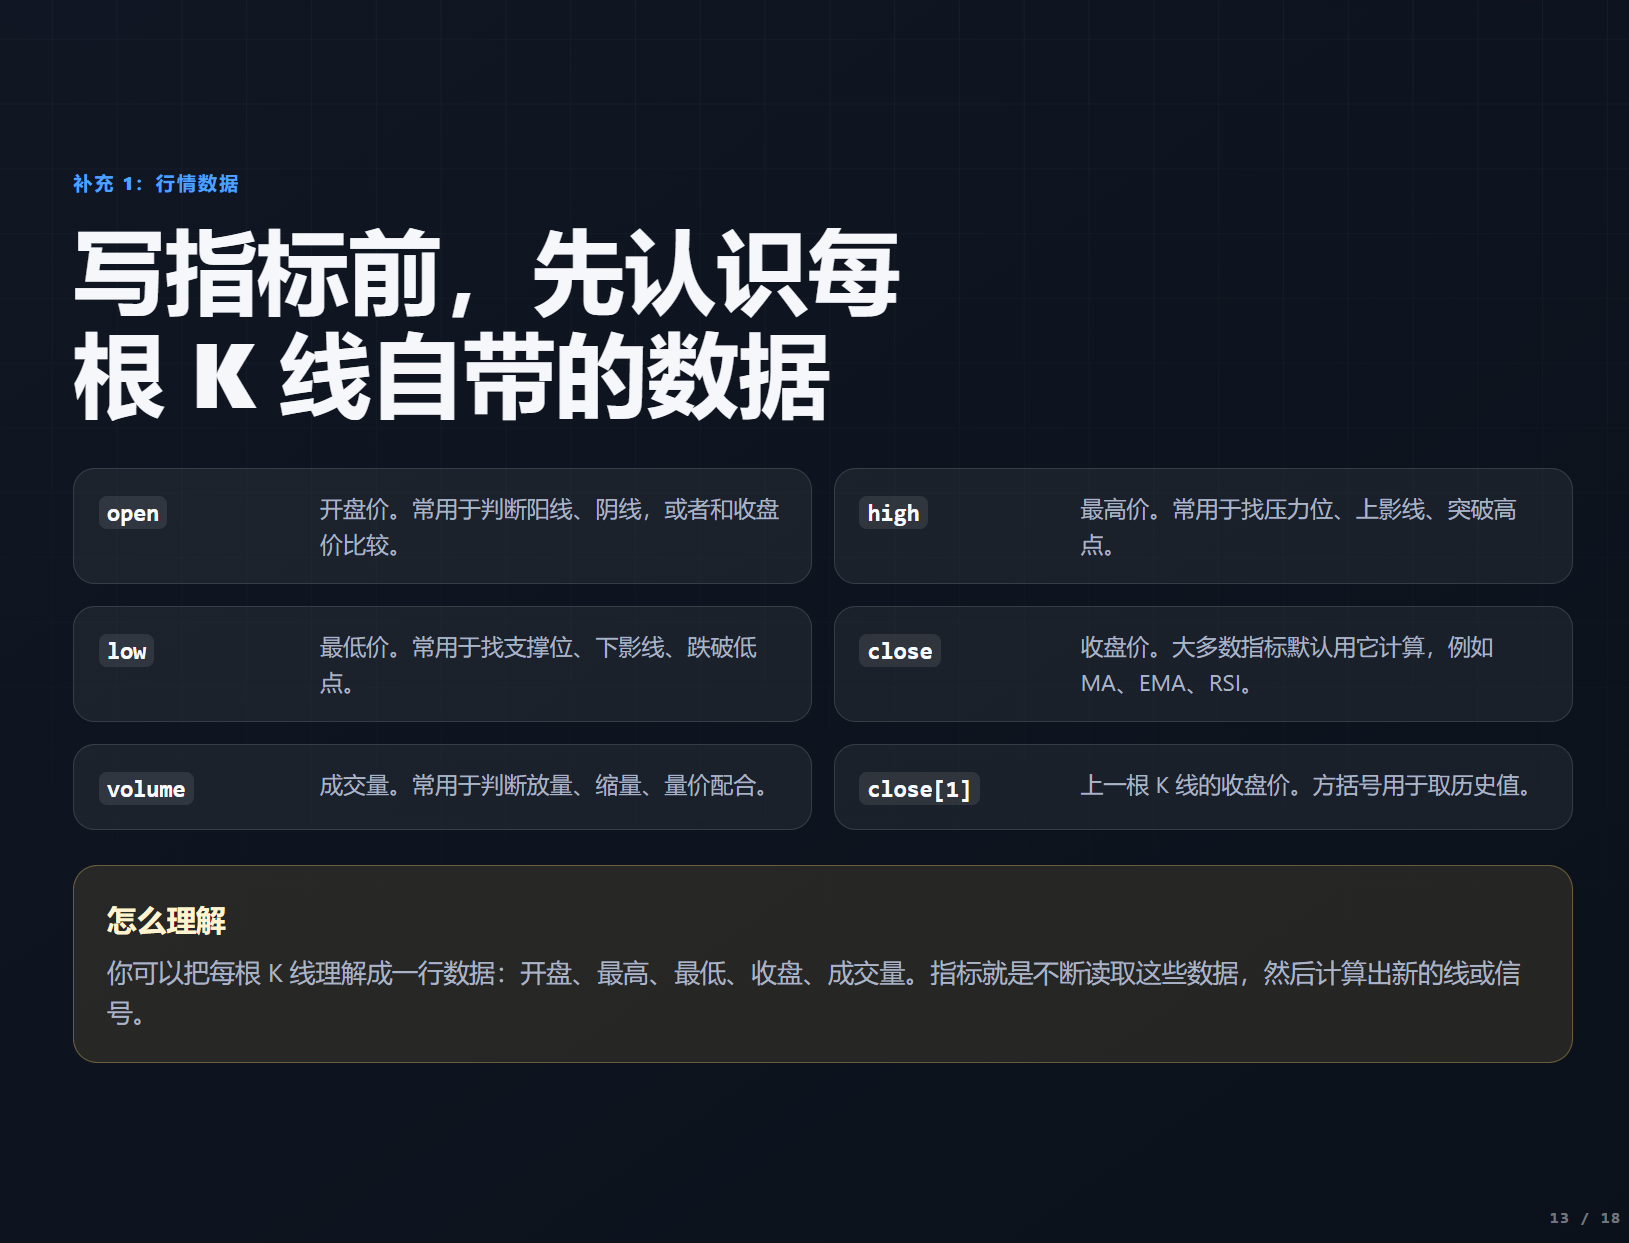
 However, never go straight to live trading after writing; the greatest utility of trading functions is to help us conduct backtesting. After writing the indicator, click the backtest button, choose different time periods and parameters, and you can see how the indicator performed in historical markets, whether it made a profit or loss, and the maximum drawdown will be obvious. If the backtesting results are poor, it indicates that our trading logic needs to be optimized, helping us avoid many pitfalls of live trading losses.
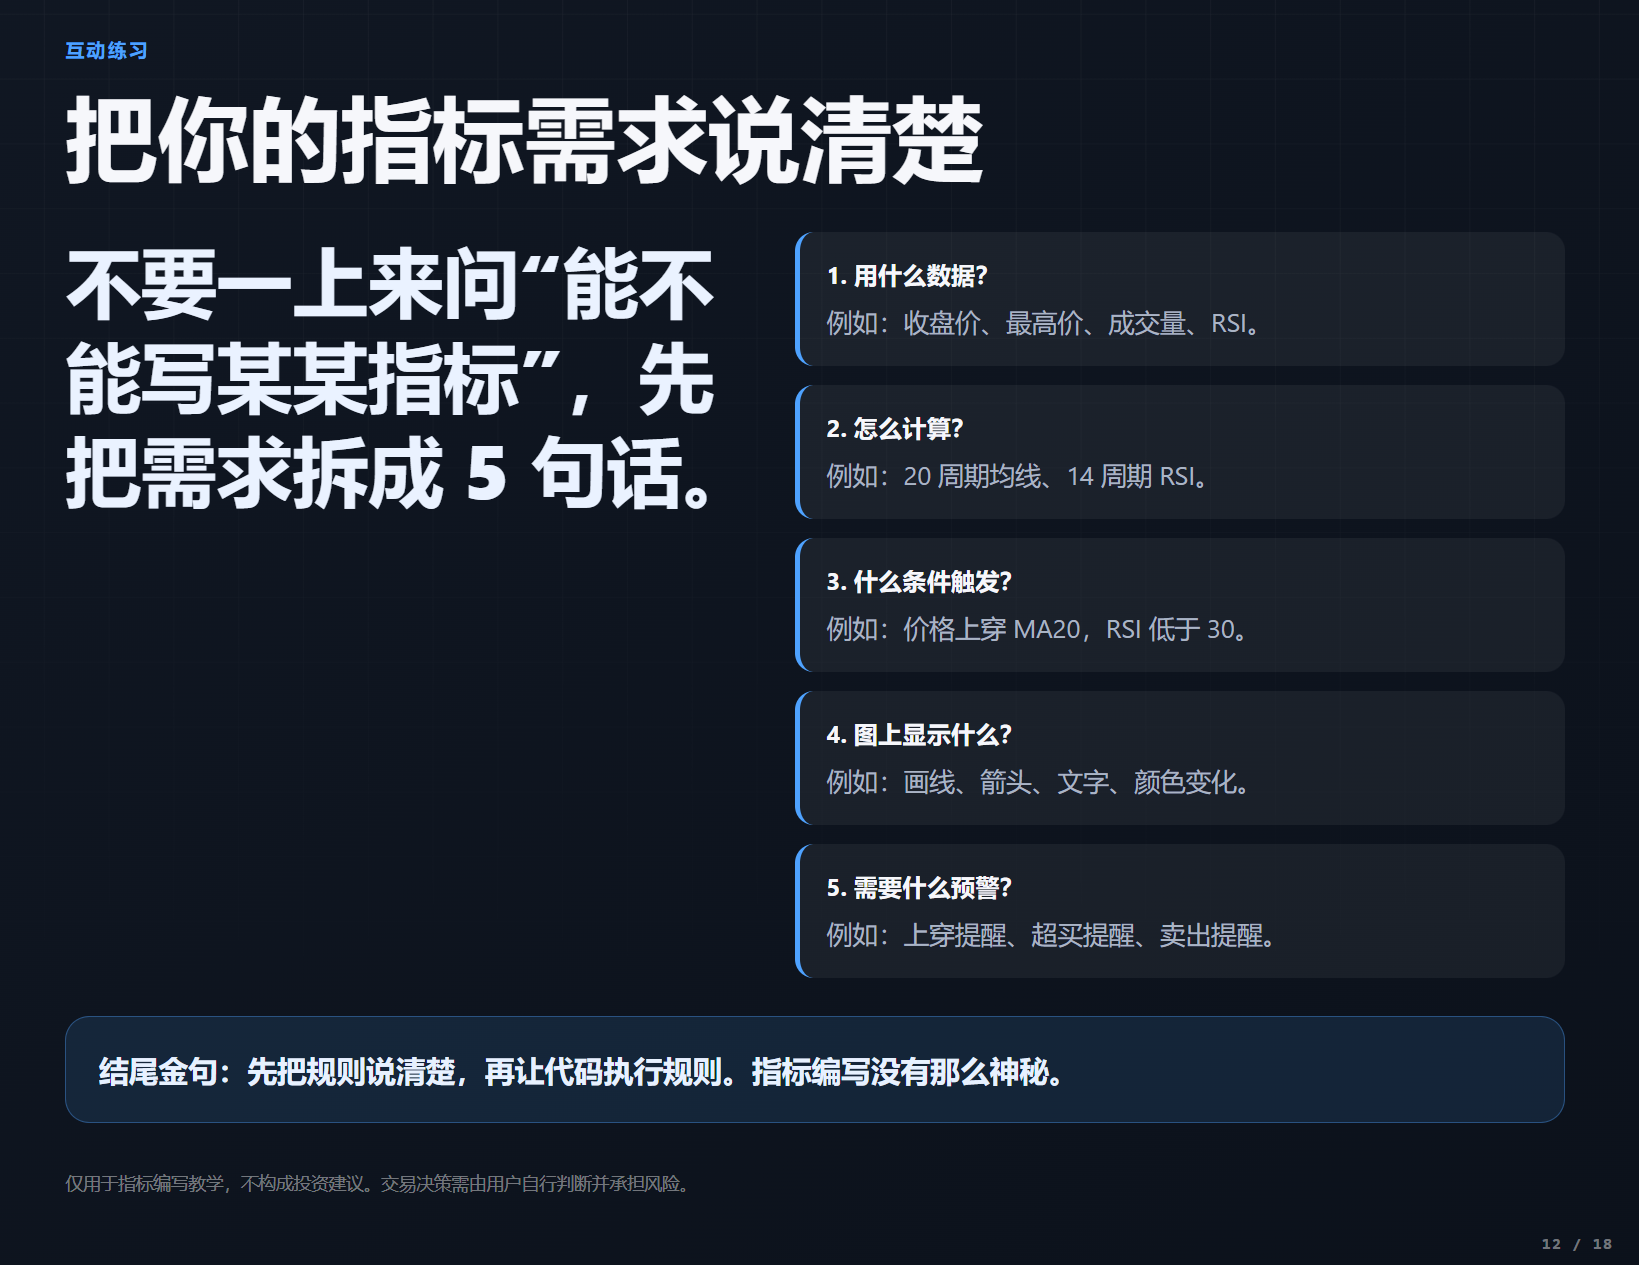
When many people request custom indicators from customer service, they often say, “Help me write a MACD indicator,” which is too vague. A clear indicator requirement is best broken down into five sentences: first, what data will be used, such as closing price, trading volume, or highest price; second, how it will be calculated, such as a 14-period RSI or a 20-period Bollinger band; third, when the signal will be triggered, such as during a golden cross or when the price breaks through a moving average; fourth, what should be displayed on the chart, such as lines, arrows, or text; and fifth, what kind of alerts are needed, such as crossing alerts or overbought alerts. The clearer the requirements, the more closely the written indicator will match your expectations. 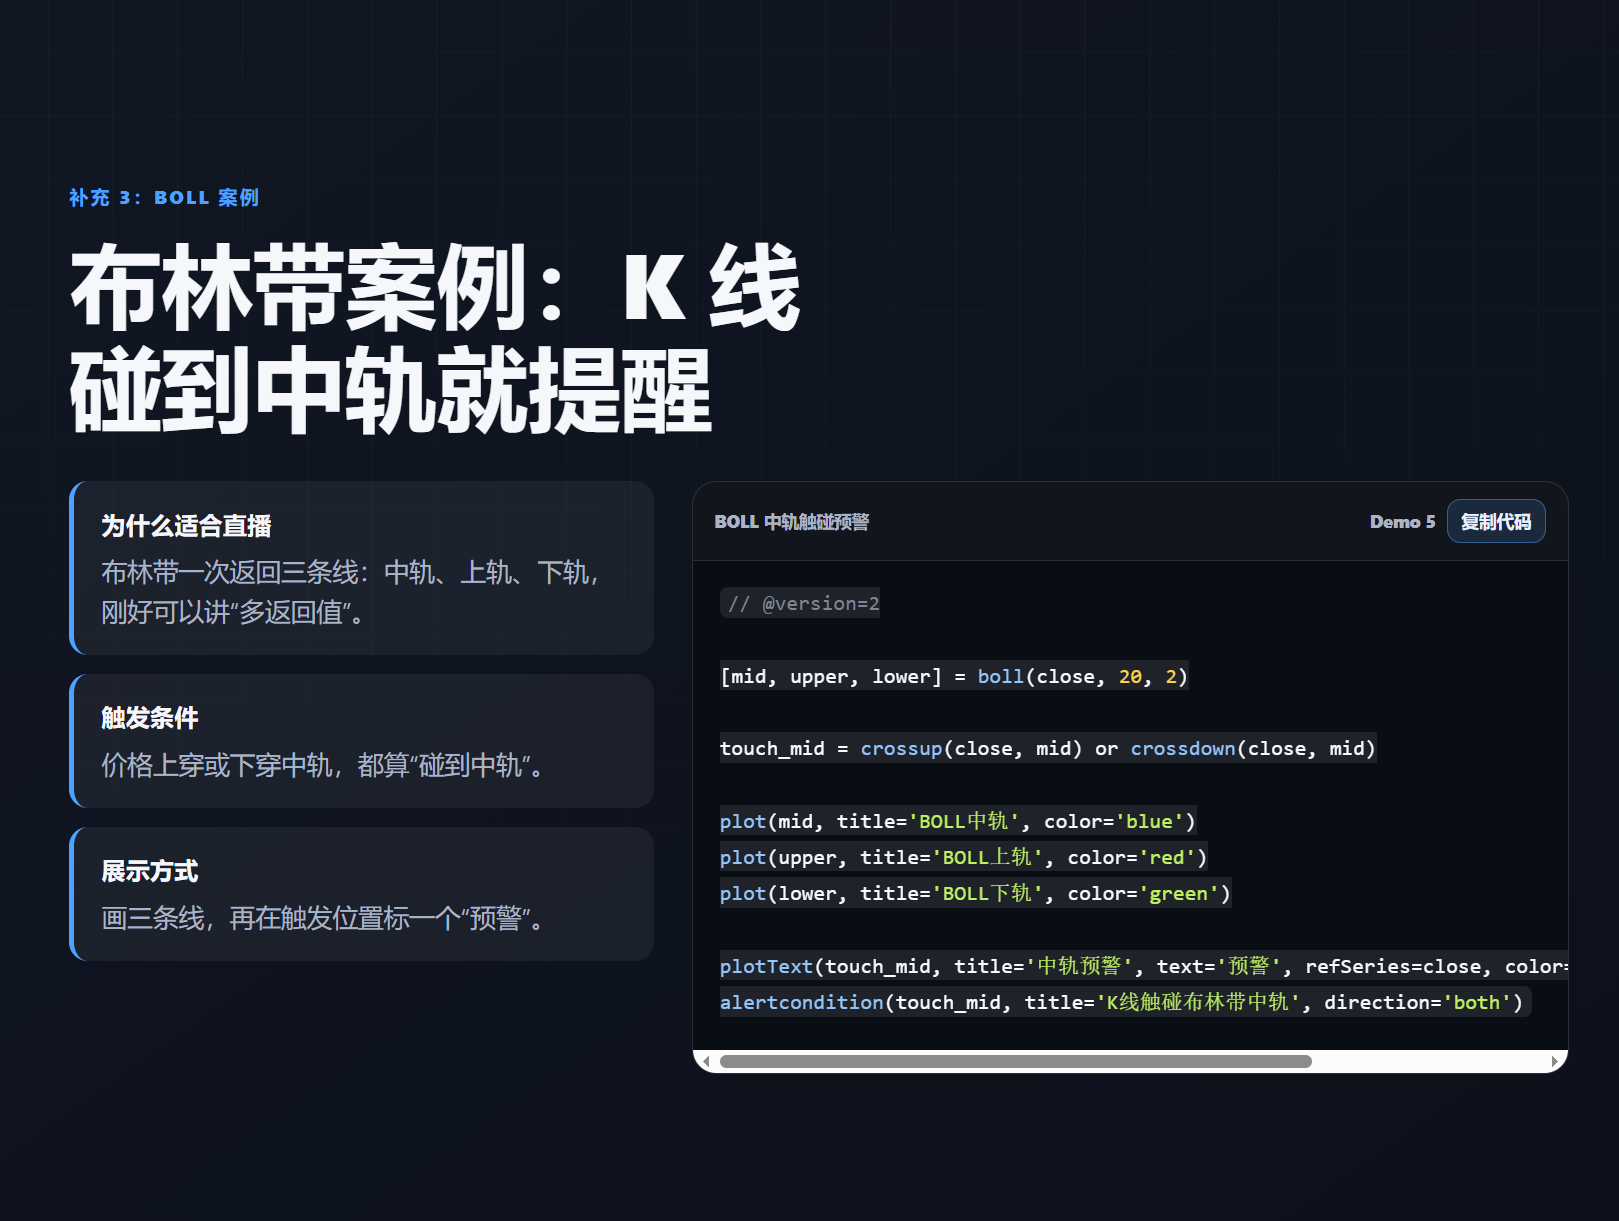
 Before writing indicators, we need to understand the basic data provided by candlesticks:
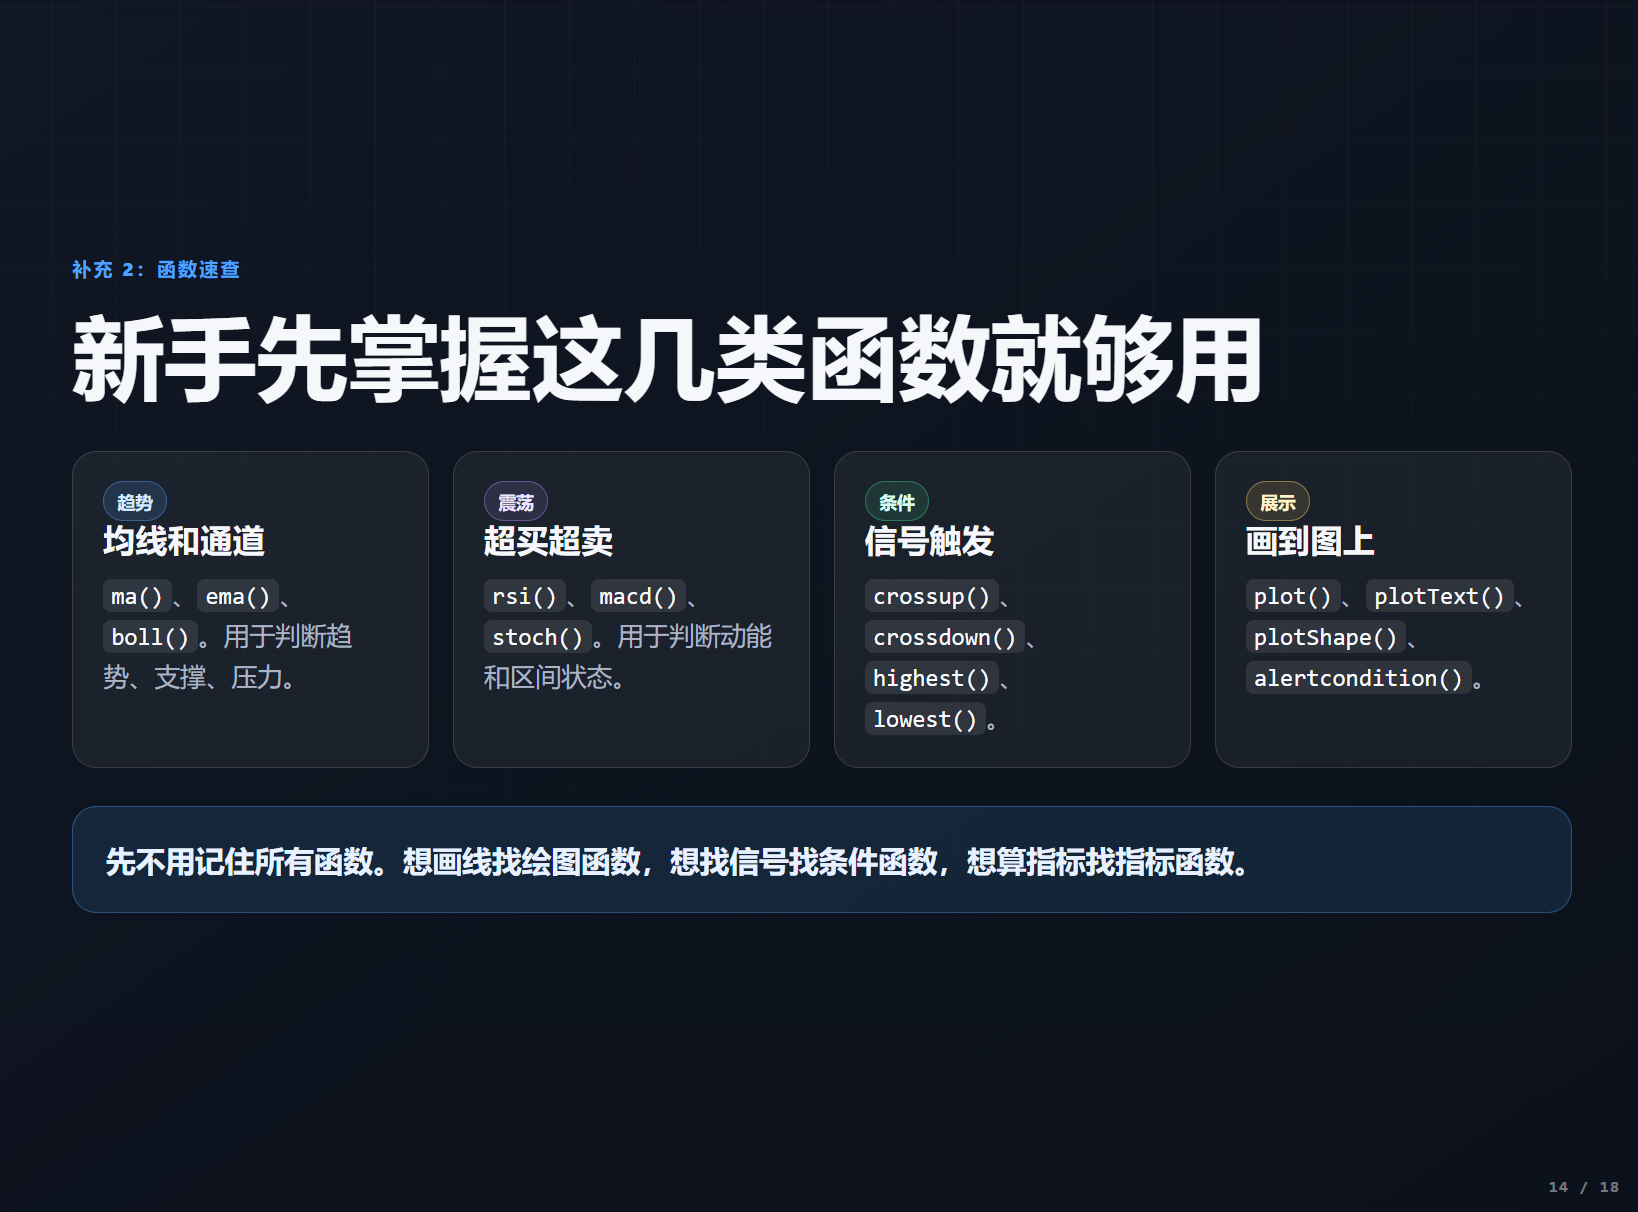
 open for opening price, high for highest price, low for lowest price, close for closing price, volume for trading volume, and all indicators are computed based on this data. Beginners do not need to remember all functions; mastering three categories is sufficient: one is moving averages and channels, such as MA, EMA, and Bollinger bands; another is for overbought and oversold, such as RSI and MACD; and the last is for conditional functions, such as golden crosses, death crosses, and the highest or lowest prices within a certain timeframe. To draw lines, use plotting functions; to find signals, use condition functions; and to calculate indicators, find the corresponding indicator functions; the function library in AiCoin is already built-in for direct calls.
Let's do a comprehensive exercise by writing an indicator for “candlesticks touching the Bollinger band midline reminder.” First, use boll(close,20,2) to calculate the three lines of the Bollinger bands: the midline, upper line, and lower line. Next, determine whether the closing price crosses above or below the midline, plot all three lines of the Bollinger bands on the main chart, and add alerts for touching the midline. If you want to change it to alerts for touching the upper or lower lines, simply change the midline parameter in the code to the upper or lower line, allowing for great flexibility. 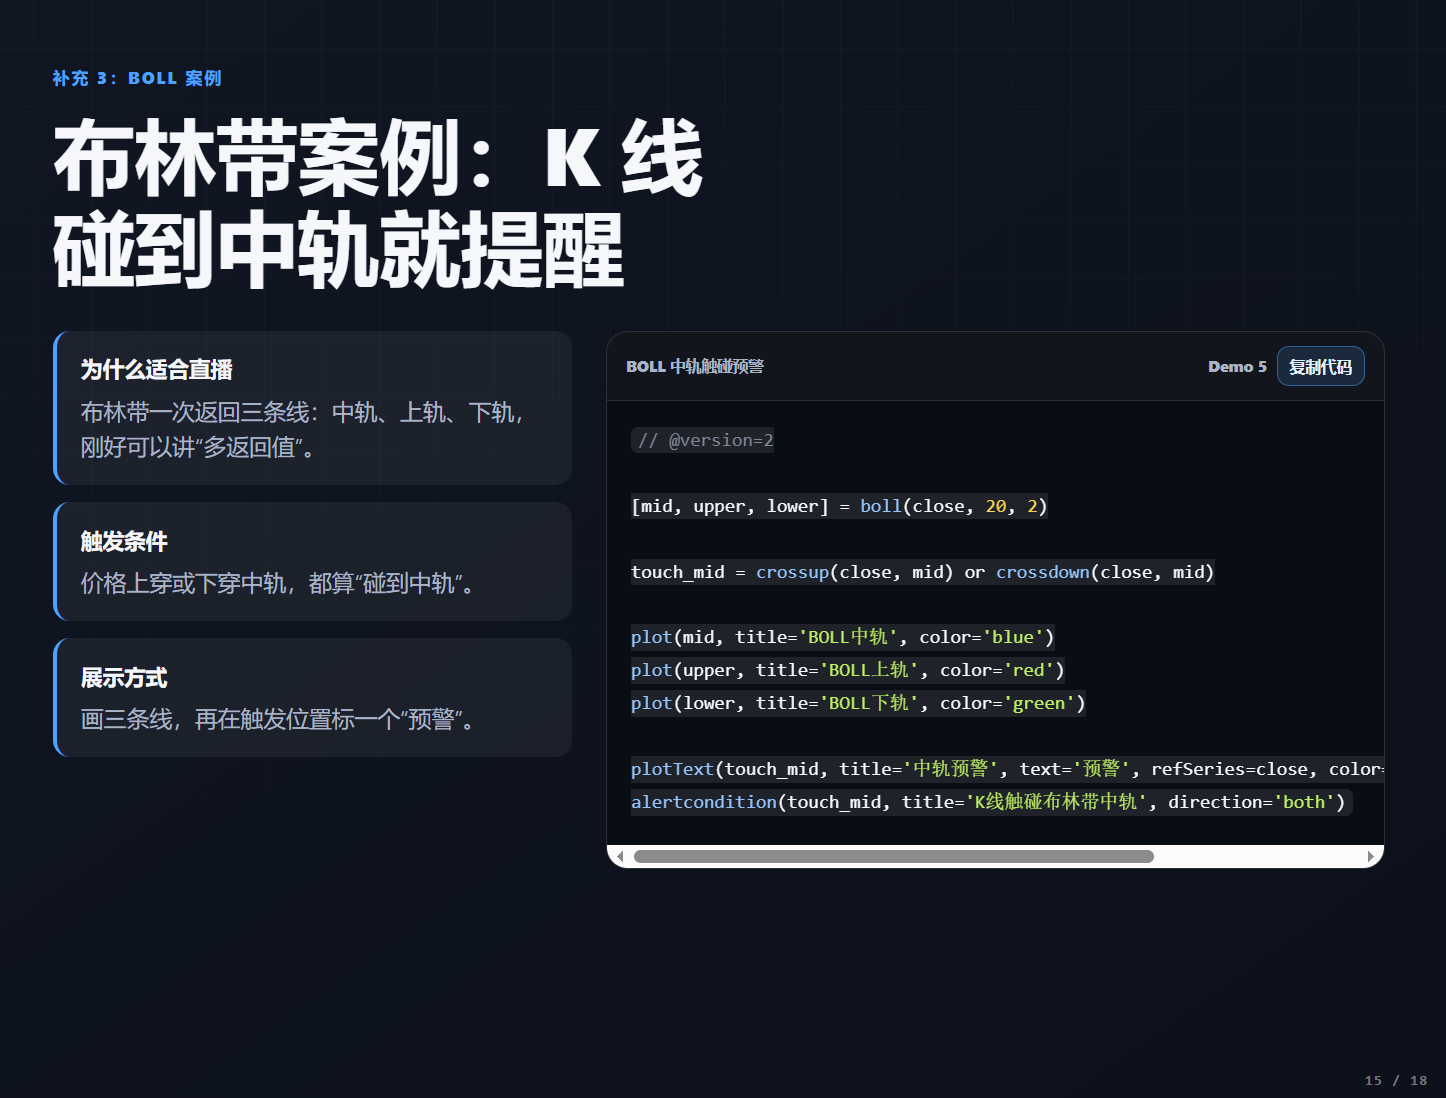 If the code you wrote does not function as expected, do not rush to rewrite it; follow four steps for troubleshooting. The first step is to click save and check if the system shows any error messages; most syntax errors will be displayed here; the second step is to temporarily plot any variables in doubt using the plotting function to check if the values are reasonable; the third step is to break down complex conditions into smaller conditions and test each one separately to verify correctness; the fourth step is to use
 and or or to combine small conditions into the final signal, where and means both conditions must be met, and or means only one of the conditions needs to be met. 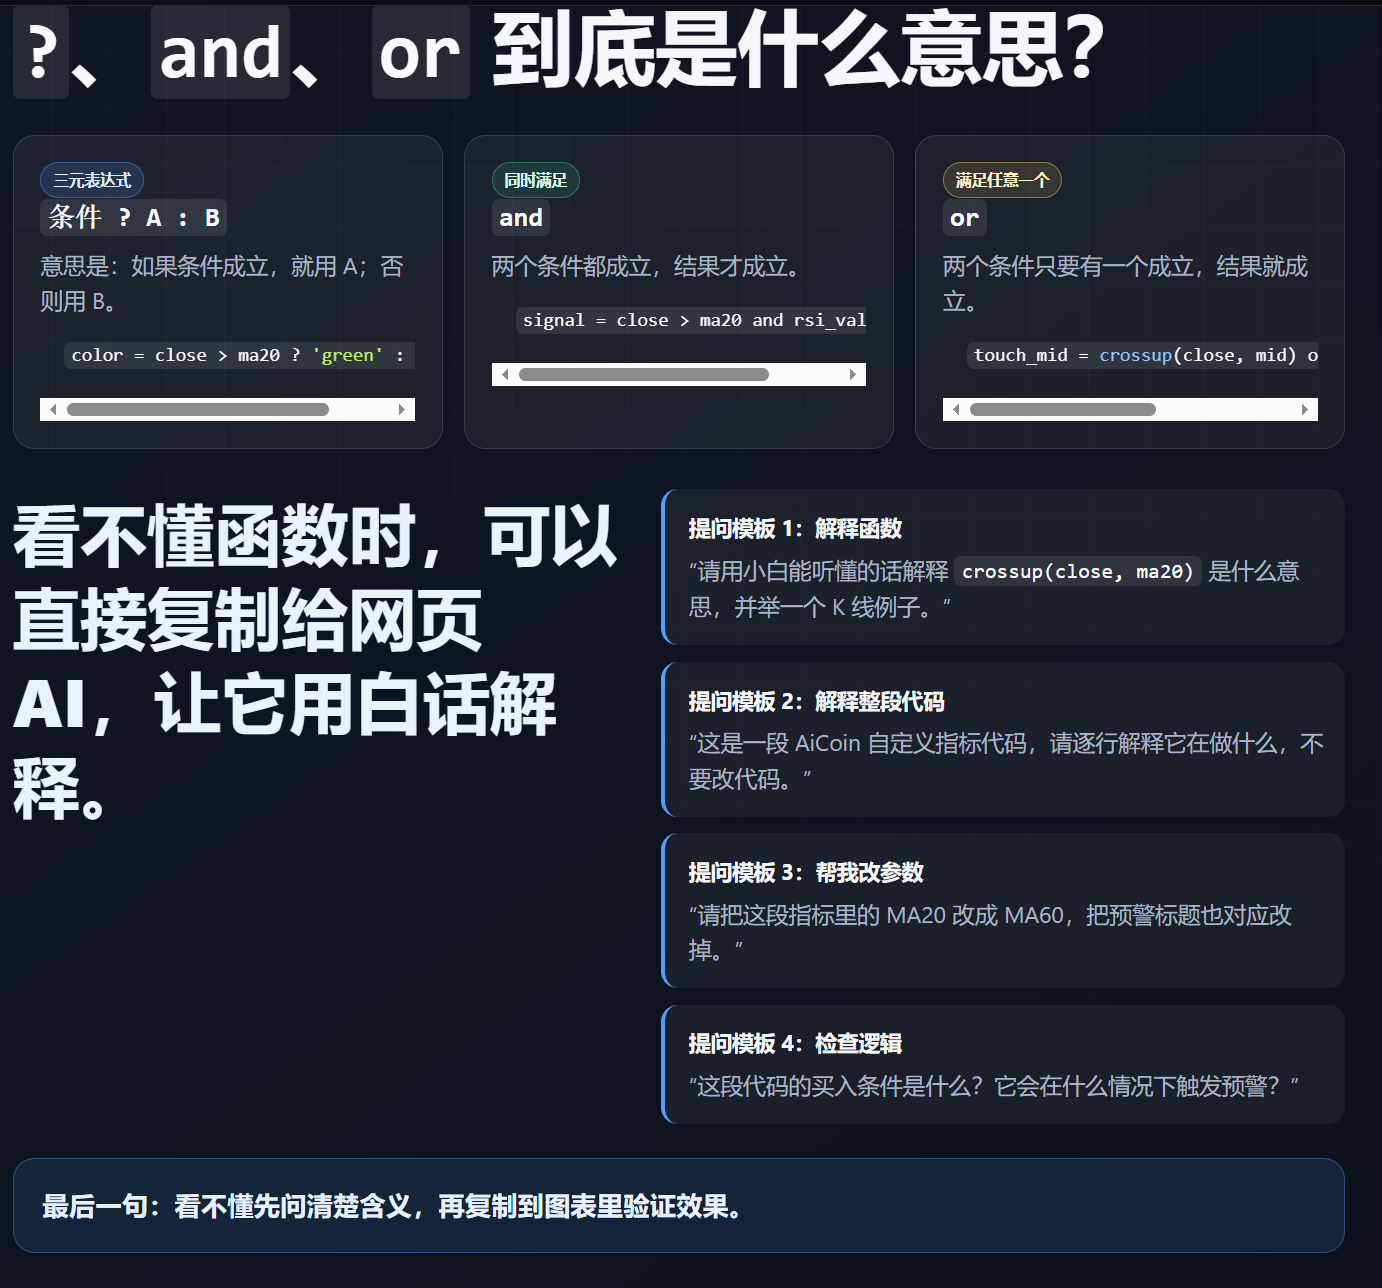 Finally, here are a few tips: the current AI tools can greatly assist us. When encountering functions that are hard to understand, you can copy them to AI for explanations in simple terms and also ask AI to help modify parameters or explain code logic. However, be cautious not to have AI write the indicators for you entirely, as this can easily lead to errors; use it for minor modifications and explanations. If you encounter problems that you cannot solve, you can ask AiCoin's customer service for help, and they will customize indicators based on your needs. Additionally, the platform has many ready-made indicator templates hidden in the "More Templates" section of the indicator editor, which we can use directly or modify based on templates to meet our needs, saving a lot of effort.
Starting from modifying a parameter, to writing a simple signal indicator, and then to creating complex indicators that can achieve automated trading, take your time. You will find that writing indicators is actually not difficult at all; the most important thing is to clearly express your trading logic.
This article only represents the author's personal views and does not reflect the positions or views of this platform. This article is for informational sharing only and does not constitute any investment advice to anyone.
免责声明:本文章仅代表作者个人观点,不代表本平台的立场和观点。本文章仅供信息分享,不构成对任何人的任何投资建议。用户与作者之间的任何争议,与本平台无关。如网页中刊载的文章或图片涉及侵权,请提供相关的权利证明和身份证明发送邮件到support@aicoin.com,本平台相关工作人员将会进行核查。


