Cryptocurrency Expert: 5.15ETH's sideways movement does not indicate a lack of market, deeply analyze the main force's intentions and future trends at the 2304 point! Latest market analysis and operation suggestions
The current price of Ethereum is 2315. The upward movement from 2240 has not been stopped out, effectively being a ride on a bullish roller coaster. It is advisable to reduce holdings to secure the principal and set a stop-loss point, so no matter how the market moves, you can remain unscathed. For those who haven't entered the market, are you hesitating whether to open a position tonight? Don't panic, I've broken down the daily and 4-hour charts clearly, guiding you through the long and short logic and key points all at once. After reading this article, you'll have a solid understanding.
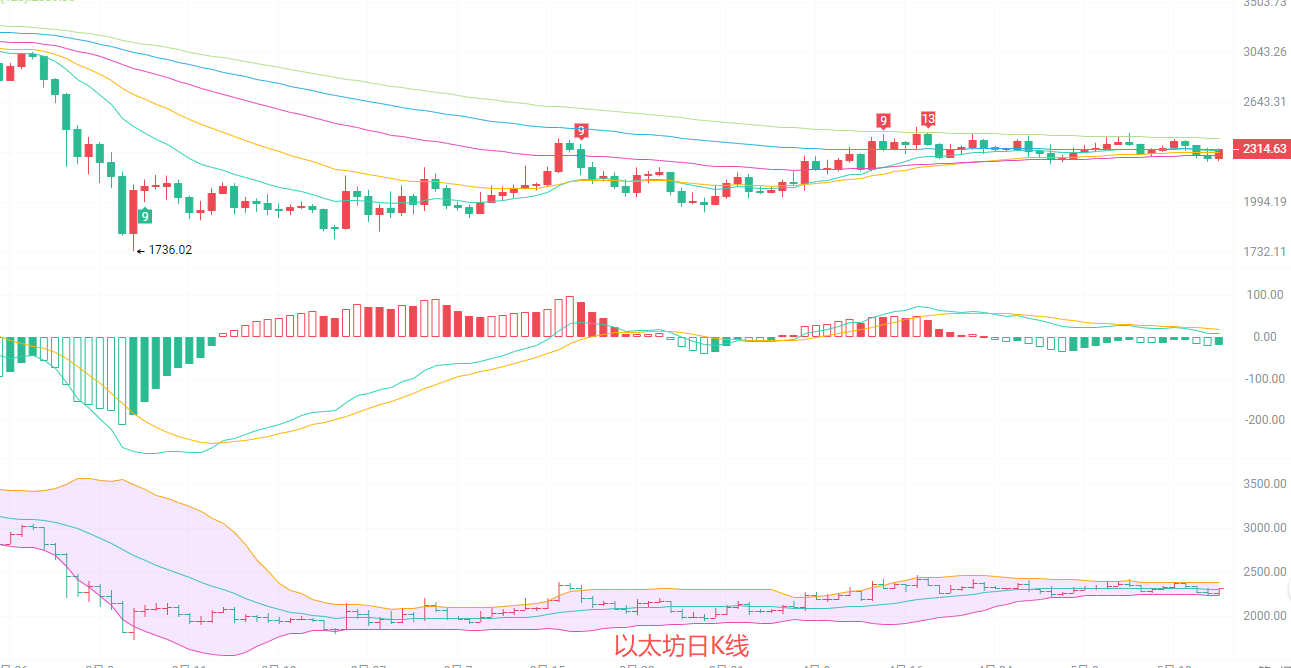
The daily K-line is near a dense area of moving averages, with EMA15, EMA30, and EMA60 forming a support band in the range of 2275-2310, while the overhead resistance is strong at the EMA120 line of 2389. The MACD red bars are continuously shortening, and the fast and slow lines are flattening around the zero axis, indicating that the long and short momentum is tending towards balance. The Bollinger Bands are continuously narrowing, with the upper track at 2382 and the lower track at 2241, with the price near the middle track. If there is no significant breakout in the short term, the range oscillation is likely to continue.
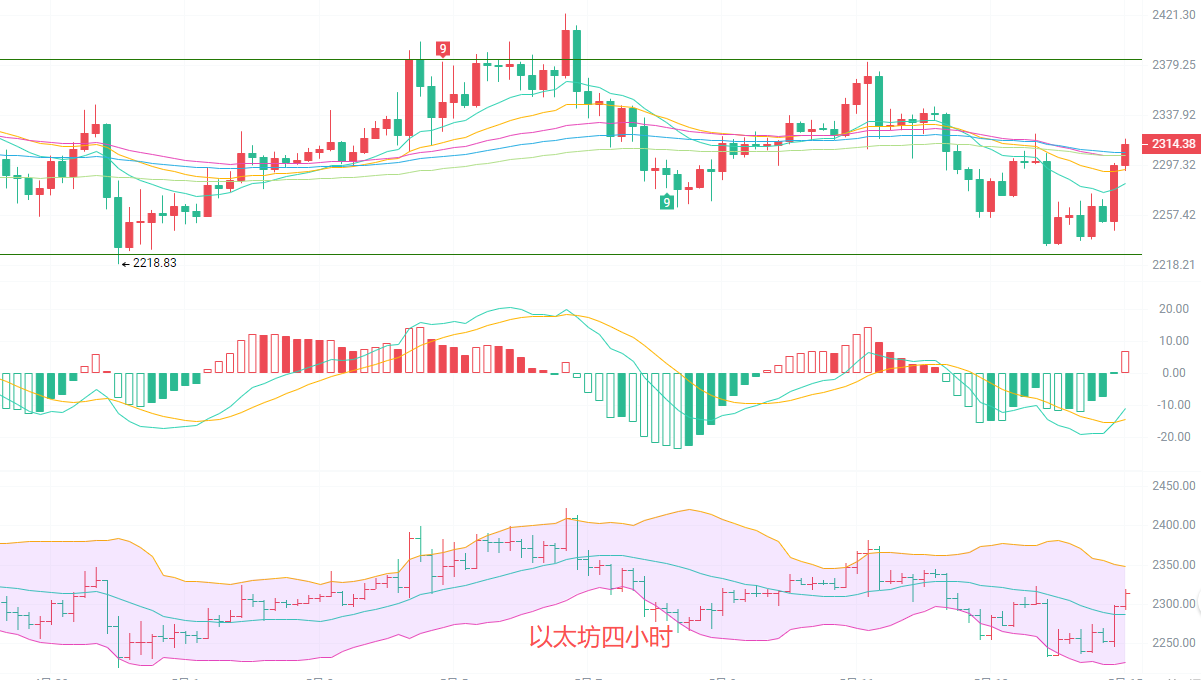
The four-hour K-line rebounded from the bottom track of the Bollinger Bands near 2226 and has currently returned to the middle track near 2304. The short-term moving averages EMA15 and EMA30 have formed a golden cross, providing support for the price. After the MACD golden cross, the red bars are gradually increasing, while the downward momentum continues to weaken and the rebound momentum has somewhat strengthened. The pressure point above is at the upper track of the Bollinger Bands at 2346, with support at around 2280 below. If the upper track cannot be broken through in the short-term rebound, there is still a risk of a second re-test, so be prepared to take profits on any pullbacks; conversely, continue to hold if the price rises.
Short-term reference:
Go long from 2280 to 2250, stop loss at 2220, target at 2320 to 2350.
Go short from 2340 to 2360, stop loss at 2390, target at 2300 to 2280.
The specific operations depend on real-time data from the market. For more information, you can consult the author. The article is published with a delay; the suggestions are for reference only, and risks are to be borne by yourself.

Warm Reminder: The above content is created solely by the author of the public account. The advertisements at the end of the article and in the comment section are unrelated to the author. Please discern carefully, thank you for reading.
免责声明:本文章仅代表作者个人观点,不代表本平台的立场和观点。本文章仅供信息分享,不构成对任何人的任何投资建议。用户与作者之间的任何争议,与本平台无关。如网页中刊载的文章或图片涉及侵权,请提供相关的权利证明和身份证明发送邮件到support@aicoin.com,本平台相关工作人员将会进行核查。