Bitcoin
Trend Judgment
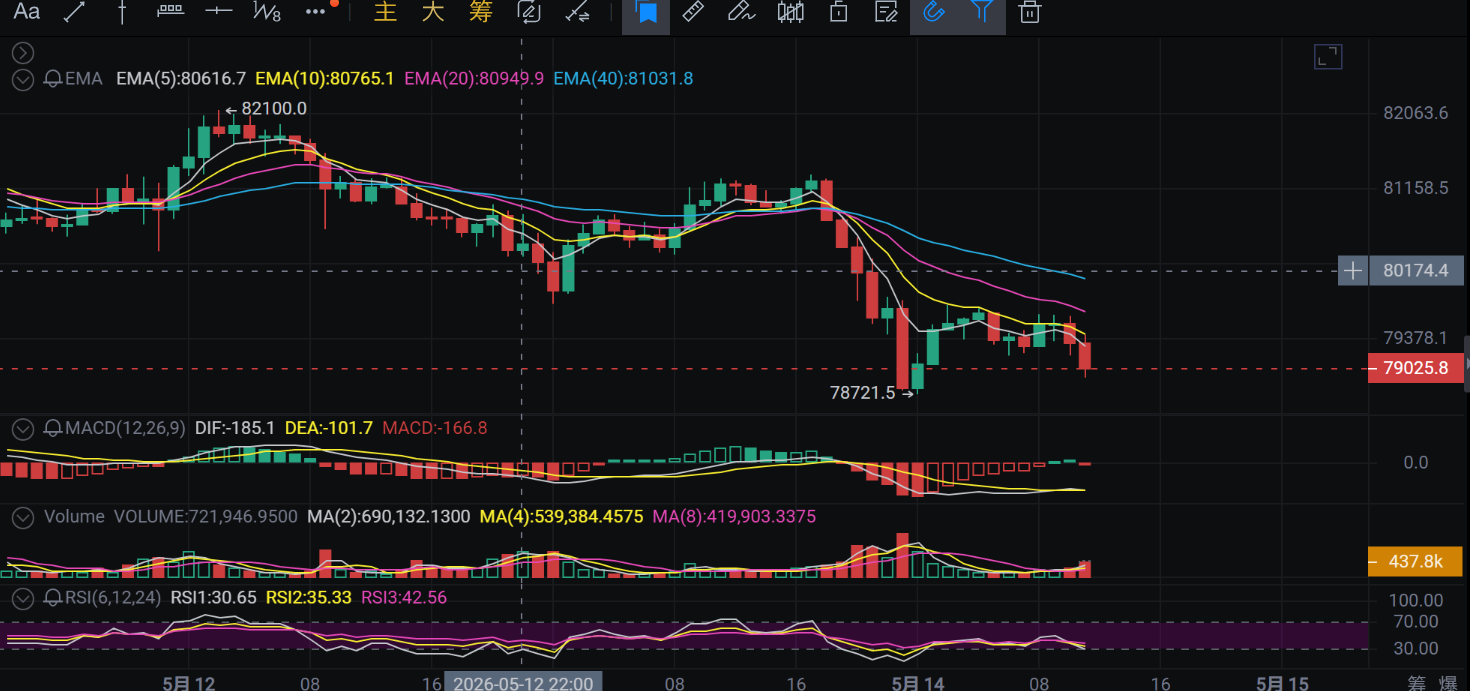
Moving Average System: EMA(5) < EMA(10) < EMA(20) < EMA(40), showing a typical bearish arrangement. The price is suppressed by EMA(5), with weak rebounds, clearly belonging to a descending channel.
Price Pattern: The price has fallen from a high of 82100, although there have been rebounds along the way, the highs keep decreasing. The latest K-line closed bearish again with a lower shadow, indicating resistance around 79000, but the bearish force still dominates.
MACD Indicator: Both DIF and DEA are below the zero axis and diverging downwards. Although the MACD histogram has shrunk (negative values have become smaller), it remains in a weak area, with no obvious golden cross or bottom divergence signals yet.
RSI Indicator: The RSI1 value is 30.65, close to the oversold area (below 30), indicating that the short-term decline is too large, creating a demand for a technical rebound, but it has not entered the extremely oversold zone.
Key Levels
Resistance Levels: 80000-80200 (short-term moving average resistance area), 80950 (position of EMA20).
Support Levels: 78721 (previous low), 78000 (integer psychological barrier).
Trading Suggestions
Main Strategy (Short Selling in Trend):
The current trend is bearish, and blindly bottom-fishing is not advisable.
Entry Point: If the price rebounds to around 80000-80200 and meets resistance, consider attempting a short with a small position.
Stop Loss: Set above 80500.
Target: First target at previous low 78721, and if breached, look at 78000.
Alternate Strategy (Short-term Long):
Because the RSI is close to oversold, aggressive traders may attempt a very short-term long position around 79000, but strict stop-loss is necessary. Exit immediately if it breaks below 78700 as support in a downtrend is often very weak.
Ethereum
Trend Judgment
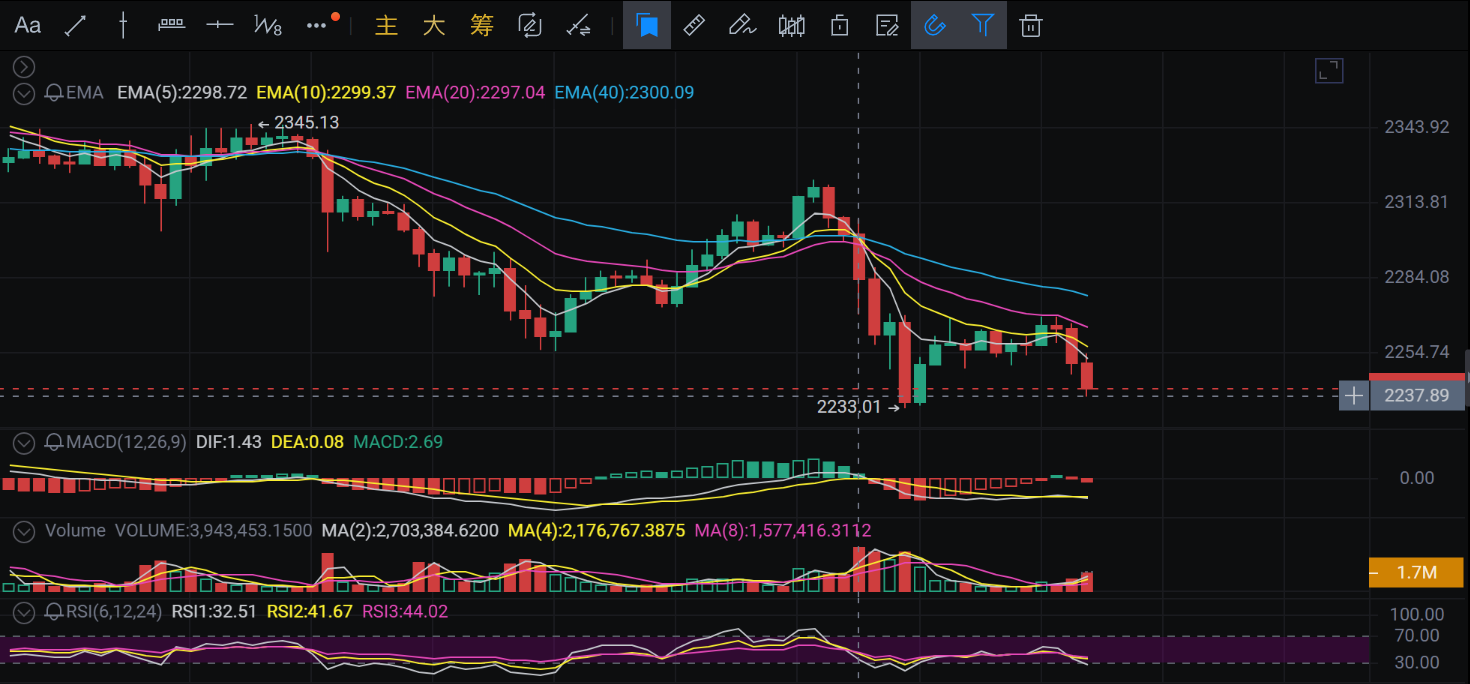
Moving Average System: Also showing a bearish arrangement, EMA(5) < EMA(10) < EMA(20) < EMA(40). The price has recently accelerated downwards after breaking the 2300 platform.
Price Pattern: It has fallen from a high of 2345, with a rapid decline near 2233 recently, followed by a slight rebound but weak. The K-line pattern shows significant selling pressure.
MACD Indicator: DIF and DEA are below the zero axis, though the DIF value is positive (1.43), the MACD histogram indicates insufficient momentum and signs of weakening, belonging to a weak oscillation biased downwards.
RSI Indicator: The RSI1 value is 32.51, also close to the oversold area, suggesting a potential exhaustion of short-term downward momentum and a demand for correction.
Key Levels
Resistance Levels: 2280-2290 (short-term dense area), 2300 (integer barrier and EMA40).
Support Levels: 2233 (previous low), 2200 (integer barrier).
Trading Suggestions
Main Strategy (Short Selling at Highs):
Ethereum's trend is weaker than Bitcoin's (typically, altcoins perform weaker during a downtrend).
Entry Point: If it rebounds to the 2270-2280 range and meets resistance, it is a good shorting opportunity.
Stop Loss: Set above 2295.
Target: Look for 2233 below, and if it breaks, look at 2200.
Alternate Strategy (Wait or Short-term Long):
Since the RSI is close to 30, if the price stabilizes around 2233 and shows a long lower shadow, consider attempting a short-term rebound to around 2260, but the risk is high, so a very small position is recommended.
Summary and Risk Control
Overall View: The current market is in a downward trend, with a clear bearish arrangement. Although the RSI indicator suggests nearing oversold, indicating a possible technical rebound, heavy bottom-fishing is not recommended.
Risk Warning:
Strict Stop Loss: In a downward trend, any support level could be instantaneously breached, so be sure to set a stop loss.
Pay Attention to Trading Volume: If the volume does not increase during a rebound, it is likely to be a trap for buyers, so continue to short at highs.
Correlation: Ethereum usually follows Bitcoin’s trend; if Bitcoin breaks key support, Ethereum will likely accelerate its decline.
In summary: The trend is bearish, and shorting at highs has a higher winning probability; bottom-fishing should be approached with caution.

The above article is analyzed by: (Warm Heart Talks about Coins), if you want to know more cryptocurrency news, scan the code to follow the public account and communicate with me, there may be delays in sending articles, and the content is for reference only. I have many years of research experience in the cryptocurrency field, and everyone is welcome to learn.
免责声明:本文章仅代表作者个人观点,不代表本平台的立场和观点。本文章仅供信息分享,不构成对任何人的任何投资建议。用户与作者之间的任何争议,与本平台无关。如网页中刊载的文章或图片涉及侵权,请提供相关的权利证明和身份证明发送邮件到support@aicoin.com,本平台相关工作人员将会进行核查。