Crypto Circle Academician: On May 12, Ethereum at 2339 falls into a critical change window! Now is the golden window period for layout! Latest market analysis and operation suggestions
Ethereum is currently priced at 2339. Yesterday, both the north and south went up, just like that, direction, level, and stop-loss are all online. Today, it’s still the familiar oscillation market, weaving back and forth between 2320 and 2350; don’t think about a one-way move before breaking the level. Don’t ask me whether it will rise or fall, follow the structure, act when the signal arrives, and wait when it does not. With effective execution, profits can be continuously made in a volatile market. The upward trend can continue to be held; as long as the upward trend remains unchanged, the market is likely to oscillate upward.
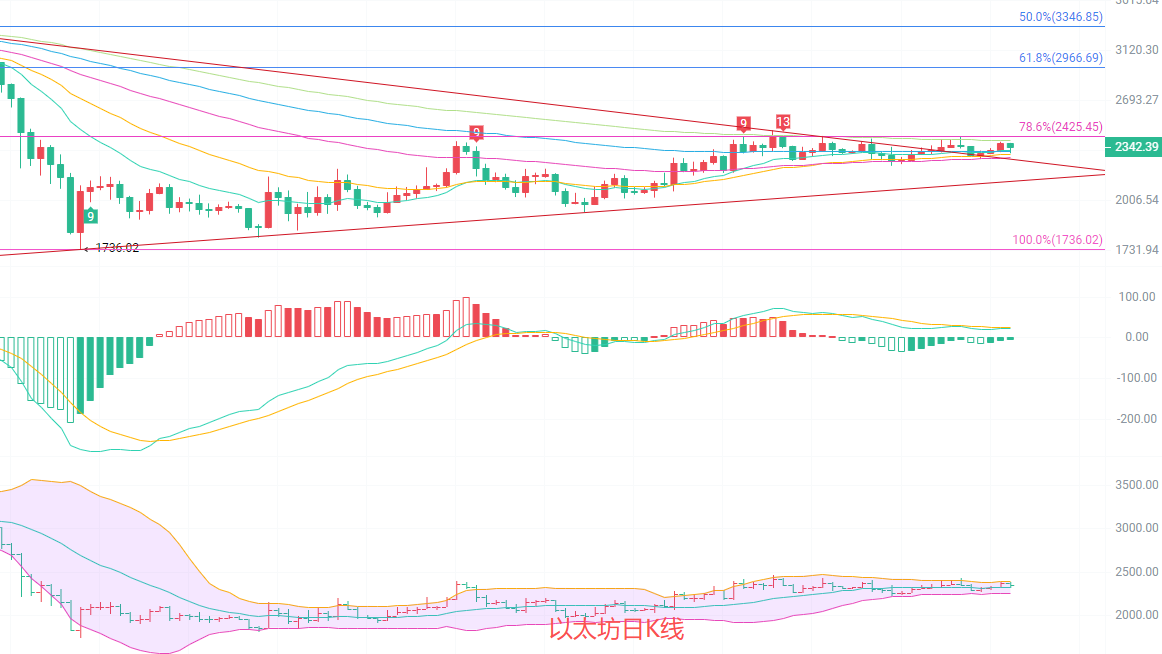
The daily K-line is in a typical horizontal oscillation structure, just near the middle track of the Bollinger Bands, with the upper band at 2388 and the lower band at 2252. The narrowing of the Bollinger Bands indicates a decrease in volatility, with a direction about to be chosen. Regarding the moving averages, EMA15, EMA30, and EMA60 are almost fused, indicating that both long and short costs are becoming consistent without a clear trend direction. The MACD green bars are continuously shrinking, and the DIF and DEA are entangled near the zero axis, leaning towards neutrality in terms of momentum, without a clear north-south signal, so the daily operations should focus on ranges.
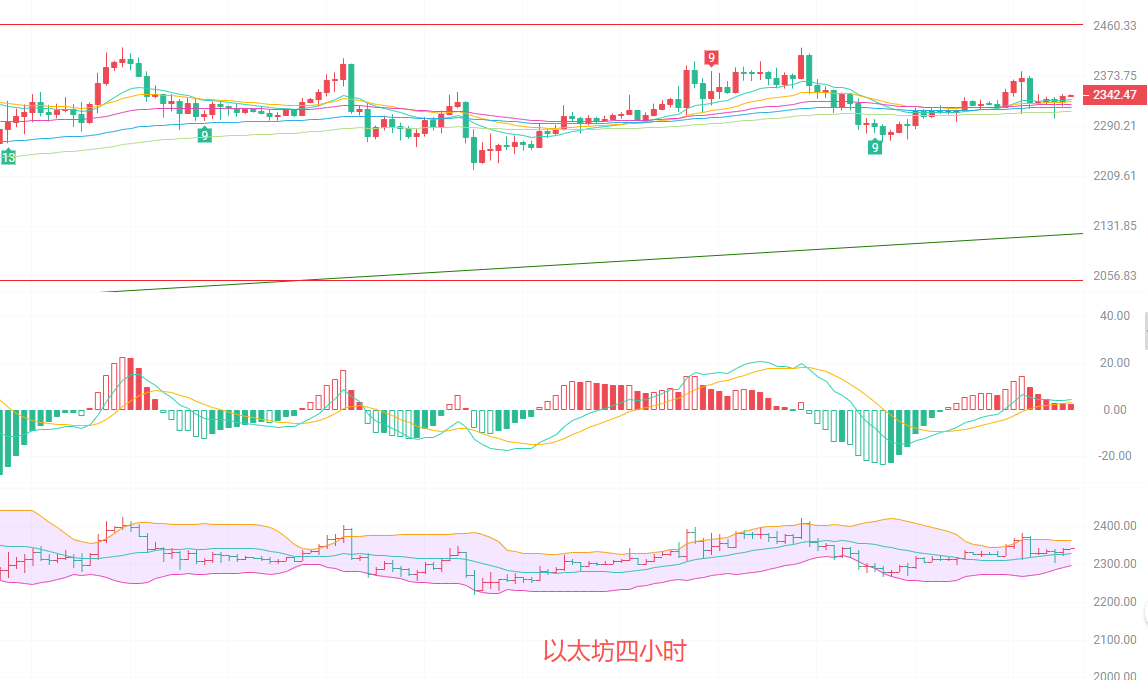
The four-hour K-line is key for short-term operations. The price oscillates above the middle track of the Bollinger Bands at 2327, with the upper track at 2363 and the lower track at 2291. This range is narrower than the daily K-line, suitable for short-term high-selling and low-buying. The EMA15, EMA30, and EMA60 have a higher degree of fusion, indicating limited short-term fluctuation amplitude. The MACD transitions from red to green above the zero axis, as upward momentum diminishes, but a downward trend signal has not appeared. The support level is 2320, and the resistance level is 2350; a break will open up new space, while without a break upward, it will be suppressed. Those who enjoy short-term intraday trading will find this type of market, while trend followers will have to continue to exchange time for space.
Short-term reference:
Upward from 2330 to 2300, stop-loss at 2270, target looking at 2380 to 2430.
Downward from 2380 to 2400, stop-loss at 2430, target looking at 2340 to 2300.
In fact, in trading, the hardest part is not judging the market, but controlling your own hands. Knowing full well it’s a volatile market, yet unable to resist chasing highs and cutting lows, ultimately losing more than gaining. Write down the rules of operation, execute them when the point is reached, and do not move when it is not. This proves to be more effective than anything else. The crypto market does not lack opportunities; what it lacks is people who can control themselves.

Warm reminder: The above content is solely created by the author in the public account. The advertisements at the end of the article and in the comment section are unrelated to the author; please discern carefully, and thank you for reading.
免责声明:本文章仅代表作者个人观点,不代表本平台的立场和观点。本文章仅供信息分享,不构成对任何人的任何投资建议。用户与作者之间的任何争议,与本平台无关。如网页中刊载的文章或图片涉及侵权,请提供相关的权利证明和身份证明发送邮件到support@aicoin.com,本平台相关工作人员将会进行核查。