60-Minute ETH Diagram
1. News Analysis
Macroeconomic Expectations (Bullish): The market has optimistic expectations for this week's inflation data, significantly increasing risk appetite and driving mainstream crypto assets to rise collectively.
On-chain Trends (Bullish): In the last 24 hours, ETH inventories on exchanges have continued to flow out, with notable capital accumulation; at the same time, expectations for the 2026 L2 ecosystem upgrade continue to ferment, enhancing institutional investment willingness.
Market Sentiment: From panic to neutrality, the market is looking for a breakthrough opportunity to surpass recent highs.
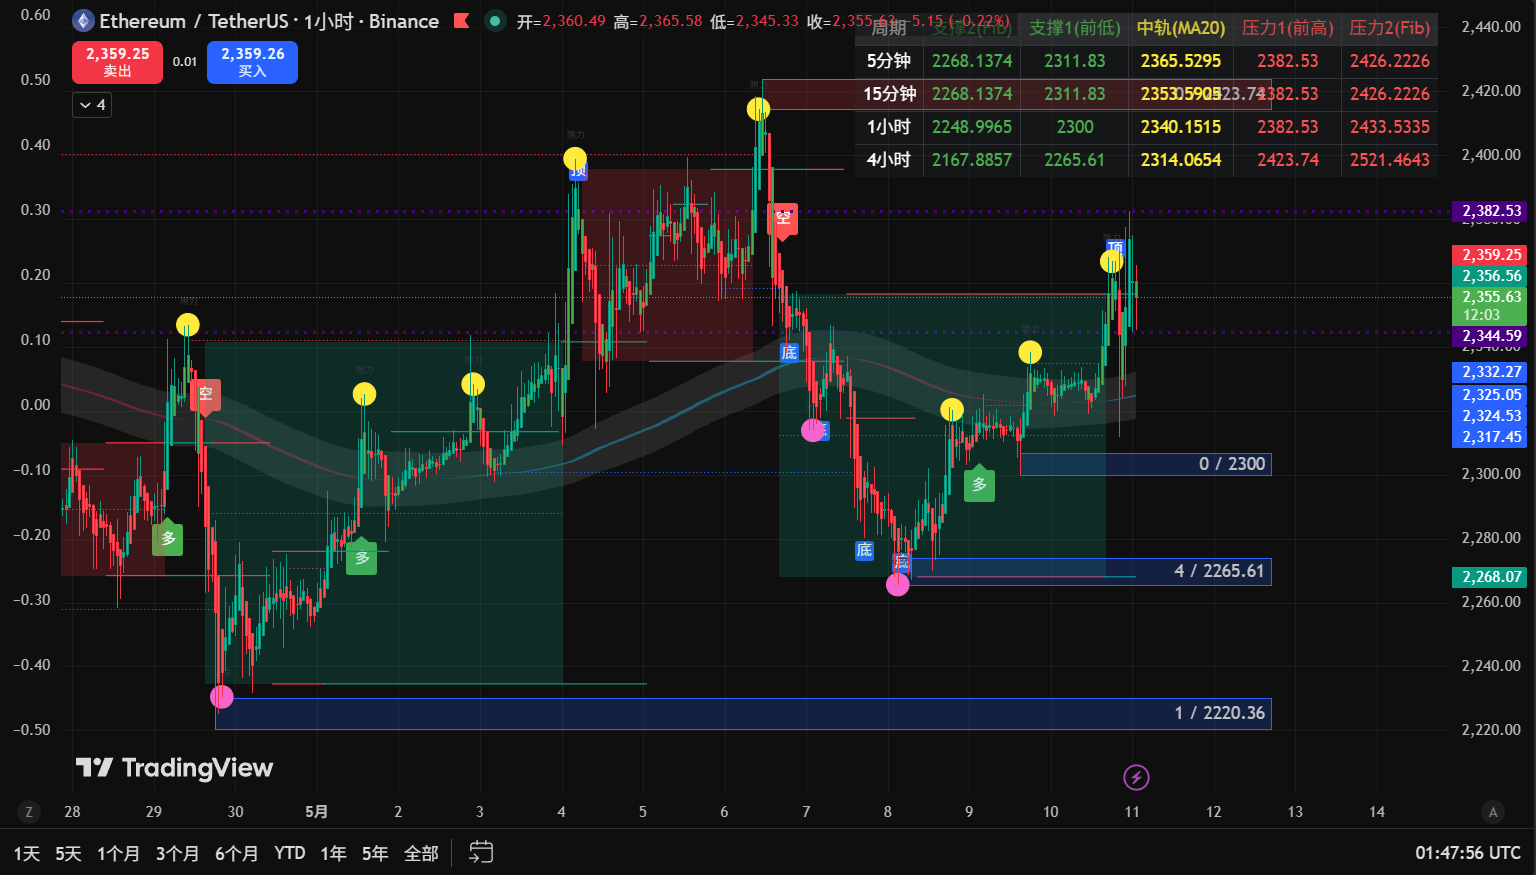
2. Technical Analysis (60-Minute Level)
Candlestick Pattern Analysis:
Bottom Structure: Prices confirmed a double bottom support near 2263, then climbed with consecutive bullish candles, completing a standard "rounded bottom" reversal.
Breakout Pattern: A breakout above MA52 accompanied by a large bullish candle is a strong breakout signal, indicating a shift in trend from weak to strong.
Consolidation: Currently facing resistance at the previous high of 2381.96, showing a small-bodied "rising flag" consolidation, aimed at digesting profit-taking, indicating a healthy adjustment.
Moving Average System (MA):
MA5 (2294) and MA10 (2306) have formed a golden cross and are diverging upward.
The price is currently stable above MA52 (2349), where it has shifted from "resistance" to "strong support."
Volume-Price Relationship:
During the rebound, trading volume has notably increased, validating the authenticity of bottom buying. Current retracement shows reduced volume, indicating limited selling pressure.
3. Trading Direction
Entry Suggestion: Buy on Dip: Gradually enter when the price stabilizes after retracing to 2345 - 2352 (around MA52).
Buy on Breakout: After the price stabilizes above 2382, additional positions can be added for chasing up.
Take Profit/Stop Loss:
First Take Profit Point: 2415
Second Take Profit Point: 2450 (previous segment high area)
Core Stop Loss Point: 2325 (if the price falls back below this level, the reversal pattern will fail, and a stop-loss exit is necessary).
Position Management: Initial base position is 30%, add 20% after a breakout, always maintain half a position to manage sudden volatility.
4. Risk Warning
False Breakout Risk: If there are multiple unsuccessful attempts to push through 2382 with a long upper shadow on high volume, be wary of forming a "double top" structure.
Macroeconomic Variables: Be cautious of systemic sell-offs caused by unexpected escalation of geopolitical situations.
Response Plan: Strictly execute stop losses, do not hold losing positions. As long as the price maintains above 2349, the trend logic will not change.
免责声明:本文章仅代表作者个人观点,不代表本平台的立场和观点。本文章仅供信息分享,不构成对任何人的任何投资建议。用户与作者之间的任何争议,与本平台无关。如网页中刊载的文章或图片涉及侵权,请提供相关的权利证明和身份证明发送邮件到support@aicoin.com,本平台相关工作人员将会进行核查。