Academician of the Cryptocurrency Circle: The upward trend on May 11 remains unchanged! Bitcoin's pullback is an opportunity, with precise entry points and stop-loss strategies included! Latest market analysis and operation suggestions
Bitcoin is currently priced at 81,400; don't let the market noise mislead you! Bitcoin ran from over 60,000 to 80,000, and if you're like me, moving north from 60,000 to 65,000 to 71,000 and then to 75,500, wouldn't you be afraid of missing the next wave? Today, I will use the daily candlestick and 4-hour charts to give you a thorough market breakdown, avoiding fluff, only discussing the current real trend, key price levels, and operation strategies. After reading this, you'll know how to respond next, and you won’t have to follow others' haphazard operations anymore!
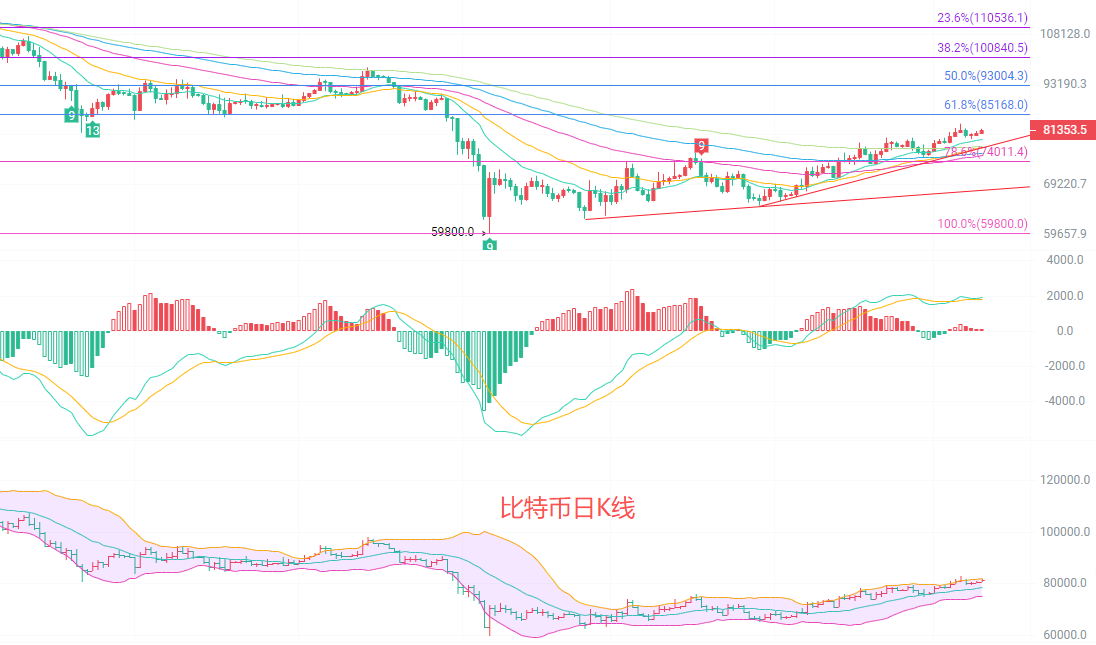
The rebound trend that began from the low of 59,800 has continued to this day. The price has successfully risen above the middle Bollinger Band, and the moving average system shows a northward arrangement. The long-term EMA120 has also turned upward from a flat position, indicating a significant warming trend in the mid-term. The MACD golden cross persists; although the red bars have decreased, there is no sign of a top divergence, showing that while the upward momentum has weakened, it has not reversed. The Bollinger Band is widening, with the price between the middle and upper bands, facing pressure at 82,000-83,000, while key support is at the 78,500 line. Overall, it remains within a rebound channel.
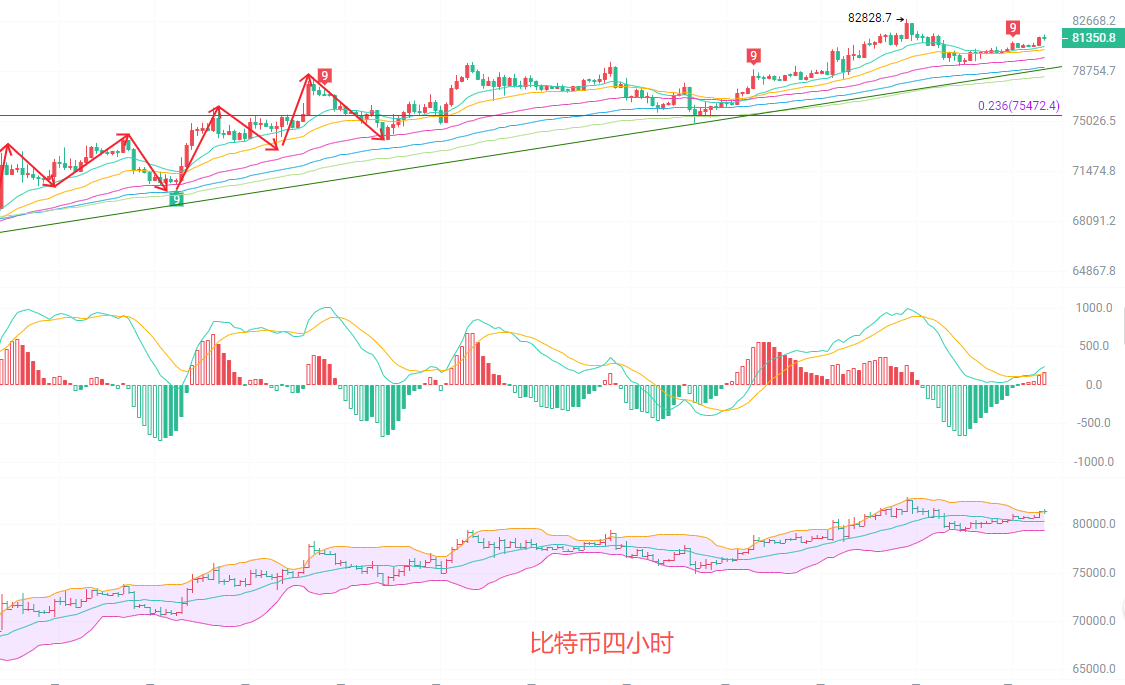
The 4-hour candlestick shows a pattern of fluctuating upward movement, with the price steadily rising relying on the EMA15 and EMA30 moving averages. Every pullback to the moving averages can recover quickly, indicating strong acceptance of the upward movement. The MACD operates above the zero axis, with DIF and DEA showing signs of high-level convergence, and the red bars shorten, indicating a short-term need for oscillation and consolidation. The Bollinger Band is narrowing, with the price fluctuation range tightening; pressure above is around 82,800, while support below is at 80,700. The movement belongs to the accumulation phase during the upward process, waiting for a breakout direction.
Short-term strategy reference: Follow the large cycle trend, with small stop-loss and quick in-and-out.
For upward movement from 80,500 to 80,000, stop-loss at 79,500, target at 81,500 to 82,000, breakout view at 82,500.
For downward movement from 82,500 to 83,000, stop-loss at 83,500, target at 81,500 to 81,000, breakout view at 80,500.
Under the current upward trend, short positions should only be short-term speculative plays, focusing primarily on long positions, with strict control of positions.

Friendly reminder: The above content is solely created by the author on the public account. The advertisements at the end of the article and in the comment section are unrelated to the author. Please be cautious and discern carefully. Thank you for reading.
免责声明:本文章仅代表作者个人观点,不代表本平台的立场和观点。本文章仅供信息分享,不构成对任何人的任何投资建议。用户与作者之间的任何争议,与本平台无关。如网页中刊载的文章或图片涉及侵权,请提供相关的权利证明和身份证明发送邮件到support@aicoin.com,本平台相关工作人员将会进行核查。