Charts
DataOn-chain
VIP
Market Cap
API
Rankings
CoinOSNew
CoinClaw🦞
Language
  • 简体中文
  • 繁体中文
  • English
Leader in global market data applications, committed to providing valuable information more efficiently.

Features

  • Real-time Data
  • Special Features
  • AI Grid

Services

  • News
  • Open Data(API)
  • Institutional Services

Downloads

  • Desktop
  • Android
  • iOS

Contact Us

  • Chat Room
  • Business Email
  • Official Email
  • Official Verification

Join Community

  • Telegram
  • Twitter
  • Discord

© Copyright 2013-2026. All rights reserved.

简体繁體English
|Legacy

Crypto Circle Liying: On May 10th, Ethereum is about to choose a direction! Will it break through 2333 or drop below 2295? Latest market analysis and operation suggestions explained.

CN
币圈丽盈
Follow
4 days ago
AI summarizes in 5 seconds.

Cryptocurrency Circle Lilying: On 5.10, Ethereum is about to choose a direction! Will it break through 2333 or drop below 2295? Latest market analysis and operational advice interpretation

Article published on 2026.5.10-----00:50

Before publication, the current price of Ethereum was 2316, having surged from a low of 2218 to a high of 2422. Now it is fluctuating around 2319, with both bulls and bears observing, neither daring to take decisive action. This type of market can be frustrating, but it also hides opportunities; as long as you understand the technical signals, you can find trends in the fluctuations. Next, Lilying will take a close look at the indicators in the charts and formulate a solid entry plan.

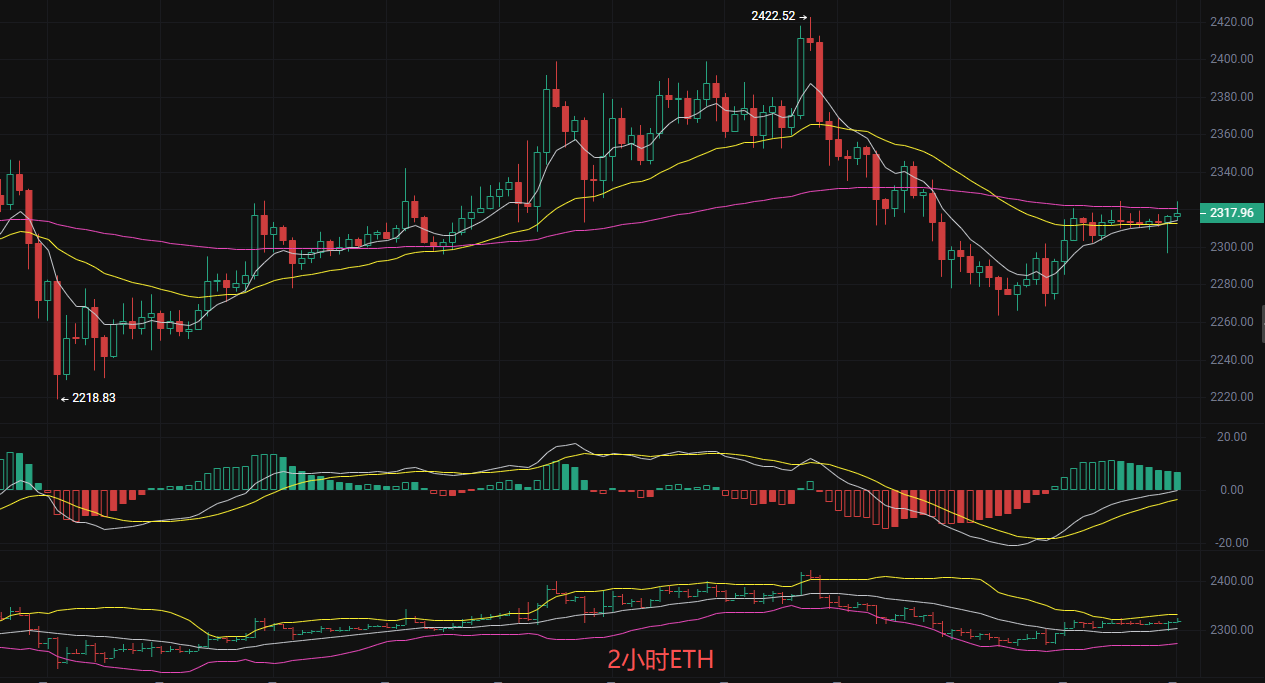
From the technical indicators perspective, the EMA moving average system shows that the short-term EMA7 is at 2314, the medium-term EMA30 is at 2313, and the long-term EMA120 is at 2320. The three moving averages are nearly converging, indicating an extremely entangled state, with the long-term moving average 2320 forming the first resistance level. In the MACD indicator, both DIF and DEA are entangled near the 0 axis, but the MACD histogram shows weak bullish momentum, and DIF is showing signs of attempting to cross above DEA to form a golden cross, which is a potential rebound signal. Regarding Bollinger Bands, the price is running above the middle band at 2302, with the upper band at 2333 providing clear resistance and the lower band at 2271 offering support. The Bollinger Bands are starting to constrict, indicating that volatility is about to increase, and a market change is imminent!

Short-term reference:

Long position in the range of 2300-2270, exit if breaking below 2230, aiming for above 2350 targeting 2400

Short position in the range of 2330-2350 if resisted, exit if breaking above 2370, targeting 2280

The above content is exclusively original by Lilying, please indicate the source when reprinting! Article publishing review has delay, market changes rapidly, the above advice is for reference only and risk is undertaken by the individual. Hope Lilying's appearance will be helpful to you!

The content of the article is timely and for reference only, risk is undertaken by the individual

Warm reminder: The above content is solely created by the author on Weibo, advertisements at the end of the article and in the comments section are unrelated to the author, please be careful to discern, thank you for reading

免责声明:本文章仅代表作者个人观点,不代表本平台的立场和观点。本文章仅供信息分享,不构成对任何人的任何投资建议。用户与作者之间的任何争议,与本平台无关。如网页中刊载的文章或图片涉及侵权,请提供相关的权利证明和身份证明发送邮件到support@aicoin.com,本平台相关工作人员将会进行核查。

|
|
APP
Windows
Mac
Share To

X

Telegram

Facebook

Reddit

CopyLink

|
|
APP
Windows
Mac
Share To

X

Telegram

Facebook

Reddit

CopyLink

Selected Articles by 币圈丽盈

3 hours ago
Coin Circle Liying: On May 14, the mid-band of the Bitcoin Bollinger Bands was lost, with 78950 becoming the boundary line between bulls and bears? Latest market analysis and operational advice.
3 hours ago
Coin Circle Li Ying: From 2422 to 2239 on May 14: After Ethereum plummeted by 6%, the technical aspect released an astonishing reversal signal! Latest market analysis and operational advice analysis.
1 day ago
Cryptocurrency District Li Ying: Ethereum continues to decline on May 13, can the 2200 mark become a lifeline? Latest market analysis and trading suggestions explained.
View More

Table of Contents

|
|
APP
Windows
Mac
Share To

X

Telegram

Facebook

Reddit

CopyLink

Related Articles

avatar
avatar币圈伟泽
2 hours ago
Mr. Coin: May 14 Bitcoin BTC Latest Trend Analysis and Prediction. Includes Operational Strategies.
avatar
avatar币圈院士
2 hours ago
Cryptocurrency Academy: On May 14, Ethereum 2253 weakly fluctuates without changing its structure. Key support holds; a rebound may start at any time! Latest market analysis and trading suggestions.
avatar
avatar币圈院士
2 hours ago
Cryptocurrency Scholar: Bitcoin fell to 79088 on May 14! The daily and four-hour structure has been thoroughly analyzed, and the key points for bulls and bears have been locked in! Latest market analysis and trading suggestions.
avatar
avatar周彦灵
3 hours ago
Zhou Yanling: May 14 Bitcoin BTC Ethereum ETH Latest Trends Forecast Analysis and Trading Strategy Today
avatar
avatar币圈丽盈
3 hours ago
Coin Circle Liying: On May 14, the mid-band of the Bitcoin Bollinger Bands was lost, with 78950 becoming the boundary line between bulls and bears? Latest market analysis and operational advice.
APP
Windows
Mac

X

Telegram

Facebook

Reddit

CopyLink