Cryptocurrency Academician: Is the correlation between Ethereum and BTC weakening on April 20? How to operate in the current market! Latest market analysis and operational suggestions
The current price of Ethereum is 2295. The current market is like boiling a frog in warm water, with neither bulls nor bears showing a clear direction, and entering heavily can easily result in getting harvested back and forth. Don't chase the market when it rises, and don't short it when it falls; chasing orders in a choppy market will likely get you swept out. It’s better to try small positions, quickly enter and exit to make some pocket money, and wait until the daily direction becomes clear before increasing positions. Protecting your capital is the key.
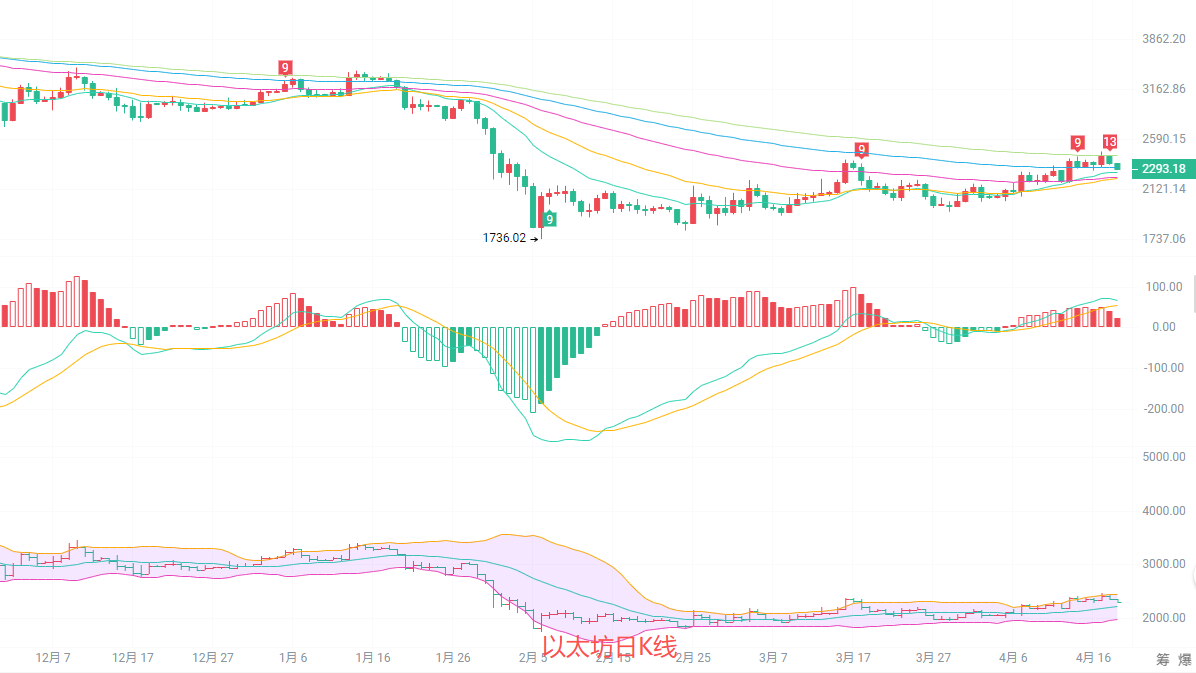
The daily candlestick chart is in the high position of a rebound consolidation phase, with prices under pressure below the EMA120 moving average at 2428. The short-term moving averages are still arranged upwards, with dual support formed by EMA30 at 2214 and the middle track of the Bollinger Bands at 2221. The MACD red column continues to shorten, the DIF line is still above the DEA line but showing clear signs of turning down, and the upward momentum is gradually weakening. The daily level has entered an adjustment period after the rise, the overall trend has not yet deteriorated, but the risk of a pullback is accumulating.
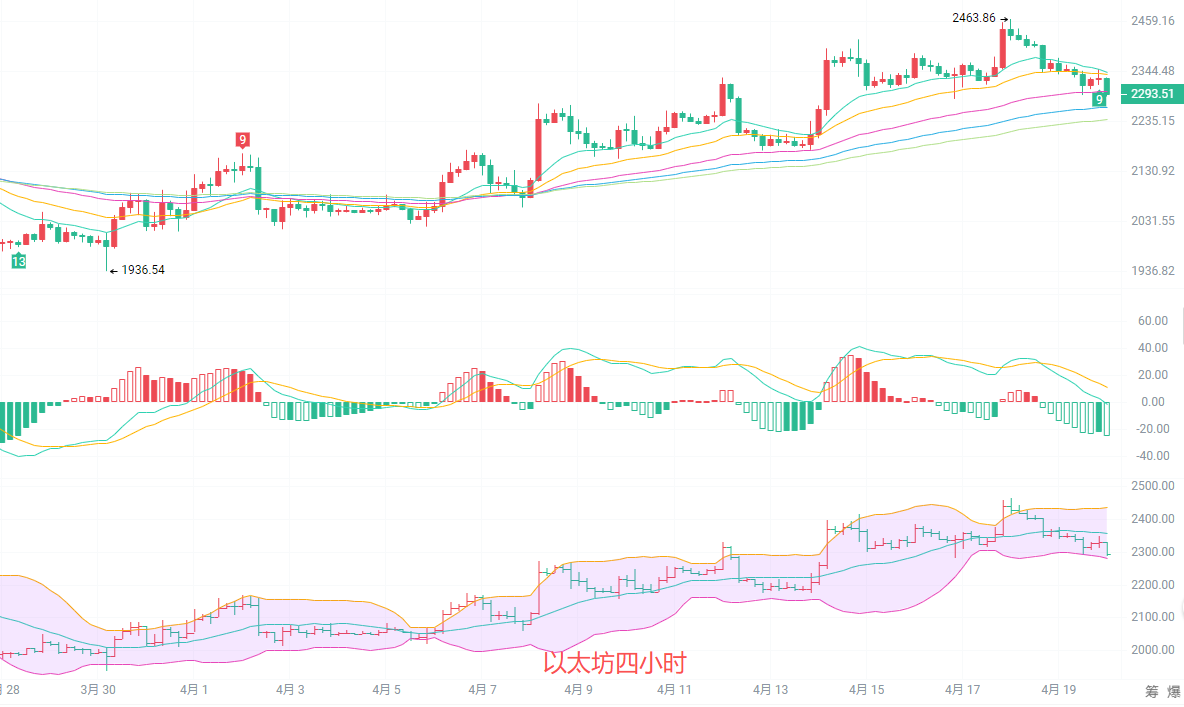
The four-hour candlestick chart has begun a pullback from a high of 2463, with the current price breaking the EMA15 and EMA30 moving averages. After the MACD dead cross, the green column continues to expand, showing a clear downward trend in the short term. The lower track of the Bollinger Bands around 2280 and the EMA60 moving average at 2299 create a resonance support area, which serves as a short-term dividing line for bulls and bears. If there is a stabilization and rebound, it is highly likely to test the 2380-2400 resistance again. If it breaks below 2280, the support will shift down to the EMA120 line at 2238, or even revisit the 2200 integer level.
Short-term reference: (Practical data has been updated, details can be consulted from the author)
Buy from 2280 to 2300, stop-loss at 2250, target at 2340 to 2370
Sell from 2350 to 2370, stop-loss at 2390, target at 2300 to 2280
To speak from the heart, the current market has unclear direction, so watch more and act less. Don’t always think about bottom fishing or top touching; capturing the highs and lows in a choppy market is much harder than you imagine. For short-term trading, operate within the range, enter and exit quickly without greed; for mid-term trading, stick to key supports, hold on as long as they don’t break; if they break, don’t stubbornly hold on. In the cryptocurrency world, surviving is much more important than making quick money.

Warm reminder: The above content is created solely by the author for the public account. The advertisements at the end of the article and in the comments section are unrelated to the author. Please discern carefully, thank you for reading.
免责声明:本文章仅代表作者个人观点,不代表本平台的立场和观点。本文章仅供信息分享,不构成对任何人的任何投资建议。用户与作者之间的任何争议,与本平台无关。如网页中刊载的文章或图片涉及侵权,请提供相关的权利证明和身份证明发送邮件到support@aicoin.com,本平台相关工作人员将会进行核查。