Crypto Circle Scholar: On April 18, Ethereum surged to 2431. Is it a trap or a real breakthrough? Don’t be confused after reading! Latest market analysis and trading suggestions.
The current price of Ethereum is 2420. The second one in this wave of rebound is indeed strong, but many people are only now realizing they want to chase it. Entering the market at this time is likely just giving the main force a chance to take over. In the crypto market, those who are early take the meat, while latecomers pay the bills. We will not be the followers who buy high and sell low; we will only make planned trades, using technical analysis to find safe entry points, steadily profiting without stepping into pitfalls. If you want to keep up with the rhythm, just look below.
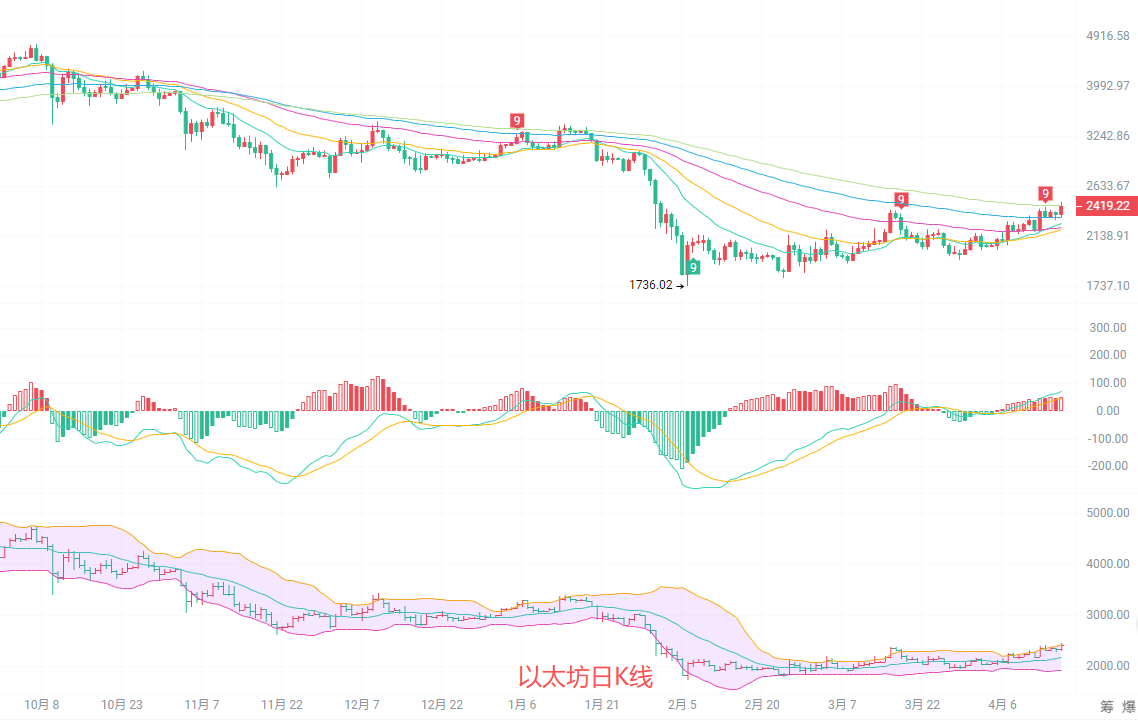
The daily candlestick has risen above the upper Bollinger band line of 2443, indicating a clear upward trend. The MACD indicator's red bars continue to expand, with the DIF line and DEA line moving upward in sync, showing sufficient northward momentum. The moving average system is in a northward arrangement, with the lower EMA30 moving average providing strong support at around 2200. As long as this position is not broken, the upward trend will not be damaged.
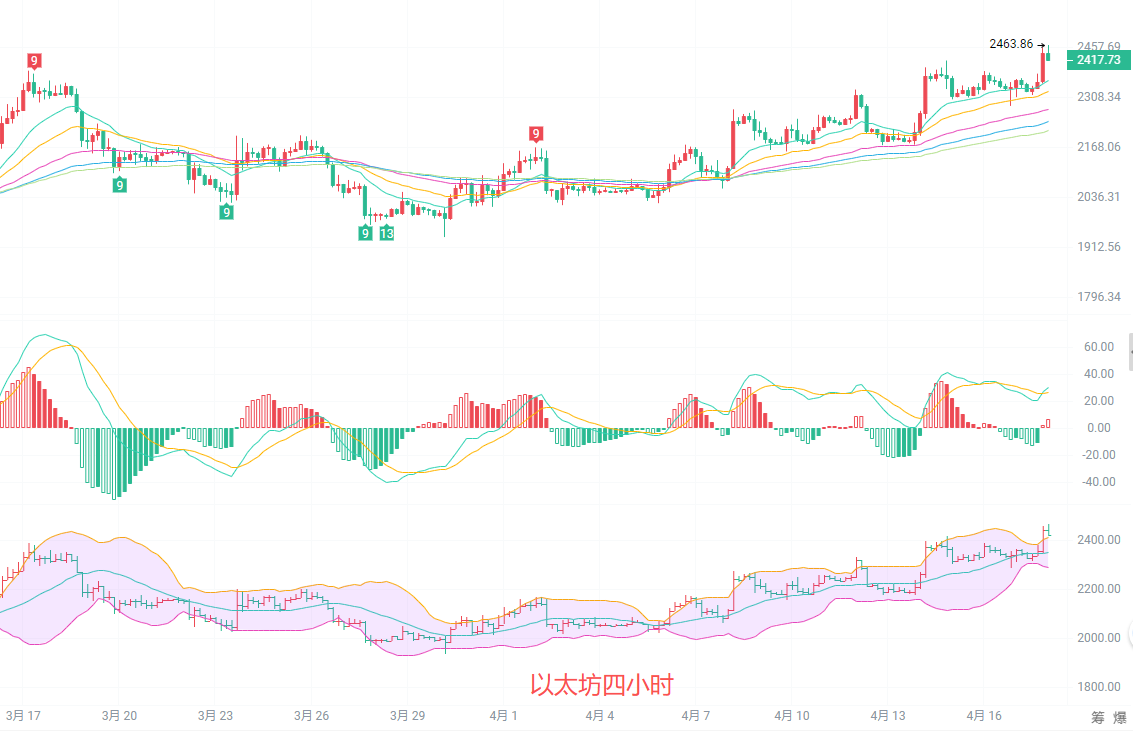
In the four-hour chart, prices are steadily rising along the upper Bollinger band, and the moving averages maintain a good northward arrangement. The EMA15 and EMA30 moving averages continue to move upwards, forming a stepped support. Every time there is a pullback to the moving averages, it can rise quickly, maintaining control of the rhythm. Although the MACD red bars have slightly shortened, they are still above the zero axis, and no obvious divergence signals have appeared. Currently, the price is approaching the phase high of 2463, and there may be a need for short-term consolidation to digest pressure. If the price doesn't drop below 2350 during a pullback, the upward trend will continue.
Short-term reference: (Real-time data has been updated; please consult the author for details)
Northward movement from 2350 to 2400, stop loss at 2320, target looking at 2460 to 2500, breaking point looking at 2550.
Southward movement from 2450 to 2470, stop loss at 2500, target looking at 2400 to 2350.
Specific operations should be based on real-time market data; for more information, please consult the author. There may be a delay in article release; suggestions are for reference only and risks are self-borne.

Warm reminder: The above content is solely created by the author of the public account. The advertisements at the end of the article and in the comments section are unrelated to the author. Please distinguish cautiously. Thank you for reading.
免责声明:本文章仅代表作者个人观点,不代表本平台的立场和观点。本文章仅供信息分享,不构成对任何人的任何投资建议。用户与作者之间的任何争议,与本平台无关。如网页中刊载的文章或图片涉及侵权,请提供相关的权利证明和身份证明发送邮件到support@aicoin.com,本平台相关工作人员将会进行核查。