Circle Liying: 4.15 ETH pullback in a bullish trend, precise operation suggestions for 2311 position? Latest market analysis and operation suggestions
Dear family! The current price of Ethereum is 2311, with a price pullback from the previous high of 2416, currently situated below the middle band of the Bollinger Bands at 2333, indicating a weakening short-term bullish momentum. The moving average system shows a bullish arrangement, but the MA(7) is slightly above the current price, forming immediate pressure, while MA(30) constitutes medium-term support and MA(120) serves as long-term trend support. The Bollinger Bands are narrowing, with the price running below the middle band, indicating that the trend has entered an adjustment phase. In the MACD indicator, the DIF crosses above the DEA, but the shrinking red bars show a shift in momentum from strong to weak, indicating pullback pressure. Trading volume is shrinking during the pullback process, indicating that bearish funds have not entered on a large scale, with the technical structure still leaning towards bullish, but caution is needed for further pullback risks.
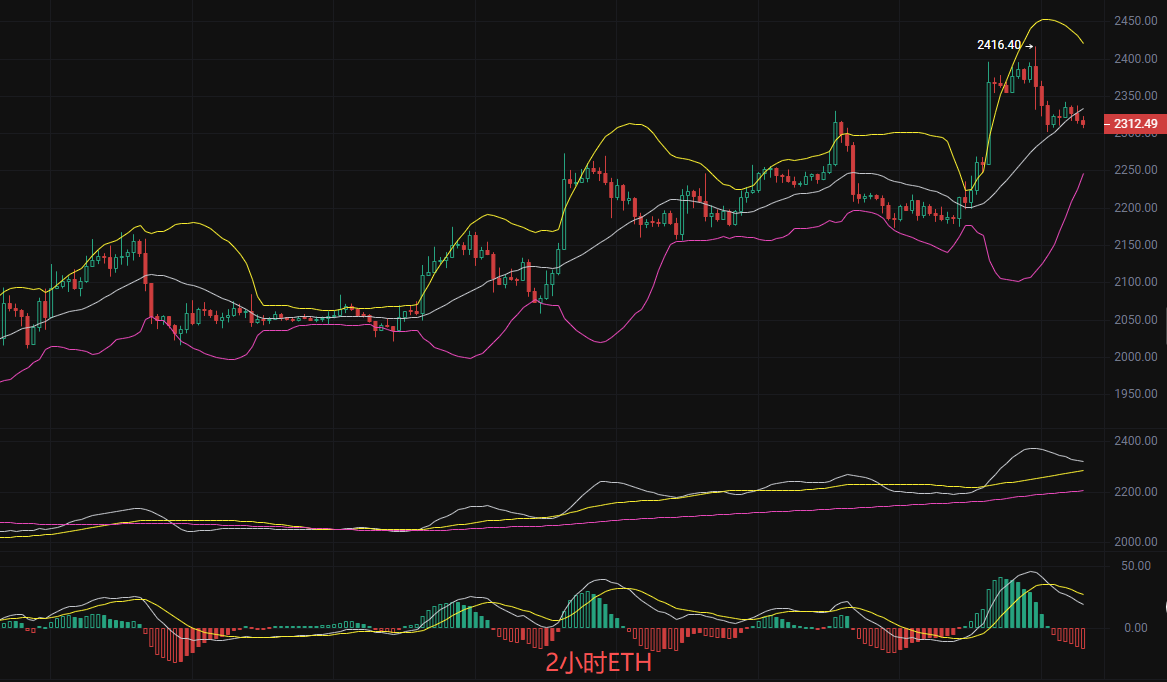
From a momentum perspective, the RSI indicator is around 55, which is not overbought but has not shown significant weakness; the KDJ is in a balanced state in the short term. The upper band of the Bollinger Bands at 2421 presents strong resistance, and if the price rebounds without breaking this level, it may continue to pull back. The key support below is at MA(30), with stronger support at MA(120); if the price retests without breaking below 2280, it can still be regarded as a healthy pullback within the bullish trend. The current price is consolidating near 2311, which belongs to a momentum accumulation after a breakout; as long as it does not fall below the breakout level of 2280, the trend structure remains intact. Attention needs to be given to the breakout strength in the 2330-2350 range; if it breaks out with volume, it will accelerate upward; if faced with resistance and falls back, the validity of the 2280 support should be observed.
Short-term practical strategy (taught by Liying, precise targeting of the market)
Long position strategy: Stabilize at 2280-2290 to test long, stop loss at 2250, target at 2350 aiming for 2400
Short position strategy: Test short at 2350-2360 when encountering resistance on rebound, stop loss at 2380, target at 2280 aiming for 2250
The market will always reward those who respect trends and strictly adhere to rules!
Note: The above analysis is solely based on the technical logical deduction of Liying and does not constitute investment advice. The market has risks; investment should be cautious.

Warm reminder: The above content is solely created by the author of the public account; the advertisements at the end of the article and in the comments section are not related to the author. Please identify them cautiously. Thank you for reading
免责声明:本文章仅代表作者个人观点,不代表本平台的立场和观点。本文章仅供信息分享,不构成对任何人的任何投资建议。用户与作者之间的任何争议,与本平台无关。如网页中刊载的文章或图片涉及侵权,请提供相关的权利证明和身份证明发送邮件到support@aicoin.com,本平台相关工作人员将会进行核查。