Cryptocurrency Circle Liying: On April 15, Ethereum reached a recent high of 2359, how to operate at this position most stably? Latest market analysis and operation suggestions
Family! Ethereum is currently priced at 2359, in the 2-hour chart the price has strongly broken through the previous high of the 2320-2330 consolidation area, currently running near the upper Bollinger Band, indicating strong short-term bullish momentum. The moving average system shows a typical bullish arrangement: MA(7) slightly above the current price forms immediate pressure, MA(30) constitutes medium-term support, and MA(120) serves as long-term trend support, all three lines moving up simultaneously, confirming that the medium-term upward trend remains unchanged. The Bollinger Band's opening is widening, and the price is running along the upper band, indicating a high trend strength. In the MACD indicator, DIF crosses above DEA, and the red bars are amplifying, indicating sustained increasing momentum without any bearish divergence signs. The trading volume significantly expanded upon breaking 2320, showing active participation from bullish funds, with a healthy technical structure and strong trend continuity.
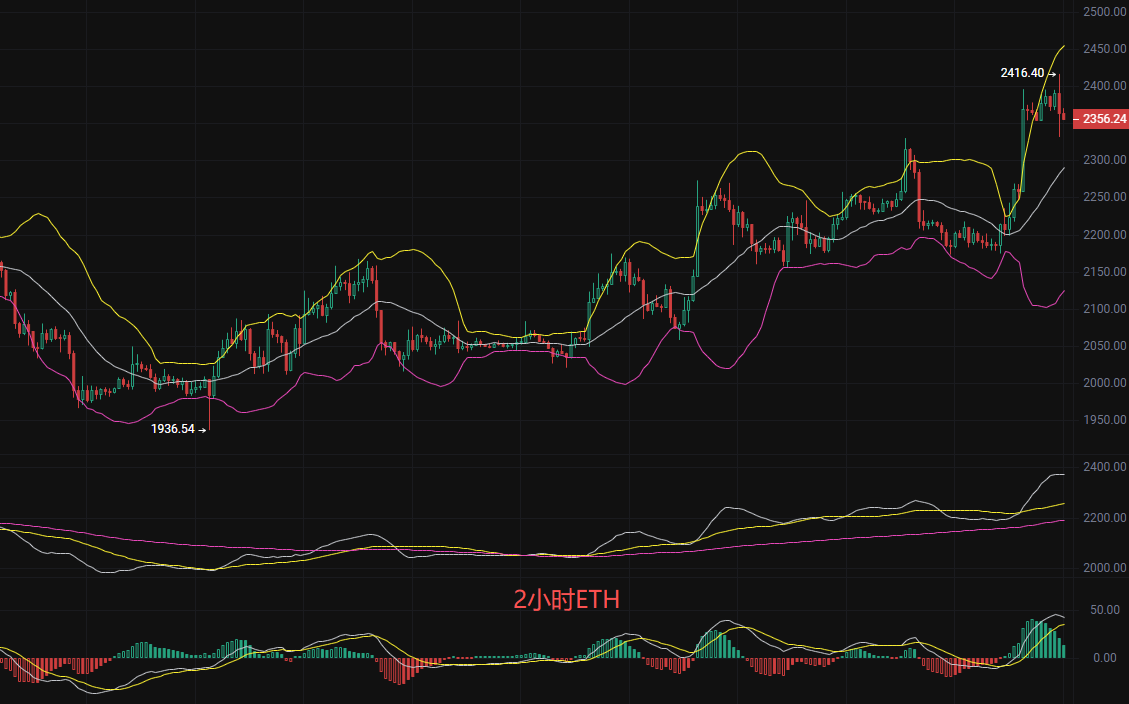
From the momentum perspective, the RSI indicator is around 65, though close to the overbought area, it has not reached extreme levels, still possessing upward space. The KDJ indicator shows short-term strength but requires caution for potential pullback risks. The upper Bollinger Band at 2455 is a strong resistance level; if a strong breakout occurs, it will open up an upward channel, with targets potentially reaching 2500-2550. Key support below is at MA(30), with stronger support at MA(120); if the price retraces but does not break below 2260, it can still be viewed as a healthy pullback within a bullish trend. The current price is consolidating around 2359, which is a consolidation after a breakout; as long as it does not fall below the previous high breakout level of 2320, the trend structure is not damaged. Attention should be paid to the breakout strength in the 2380-2400 range; if a strong breakout occurs, it will accelerate upward; if it meets resistance and falls back, then the effectiveness of the 2320 support needs to be observed.
Short-term practical strategy (Liying’s personal instruction, accurately corresponding to the current market)
Long position idea: Stay above 2320-2330 to cautiously try longs, stop loss at 2190, target 2450 aiming at 2550
Short position idea: Consider shorting if breaking below 2280, stop loss at 2350, target 2200 aiming at 2120
The market will always reward those who respect the trend and strictly adhere to the rules!
Note: The above analysis is solely based on technical logical deduction from Liying and does not constitute investment advice. The market has risks, and investments require caution.

Warm reminder: The above content is solely created by the author for the public account. The advertisements at the end of the article and in the comments section are unrelated to the author; please discern carefully, thank you for reading.
免责声明:本文章仅代表作者个人观点,不代表本平台的立场和观点。本文章仅供信息分享,不构成对任何人的任何投资建议。用户与作者之间的任何争议,与本平台无关。如网页中刊载的文章或图片涉及侵权,请提供相关的权利证明和身份证明发送邮件到support@aicoin.com,本平台相关工作人员将会进行核查。