Welcome to the Qinglan Crypto Classroom, I am Sister Qinglan! Today we will use the TPV three-point verification system to dissect the market thoroughly, filled with practical insights!
Step One: Look at the big picture (multi-timeframe trend overview)
Let's list the trend checklist for the four timeframes:
1-Day timeframe: The trend is bearish! Because MA5 is 67145.03, MA10 is 68375.25, MA30 is 69610.86, and the price is below the moving averages. The current price is 68255.34, which is lower than both MA10 and MA30. Key resistance is near MA10 at 68375.25, with support at the recent low of 65998.05. On-chain sentiment is "extreme fear," with an index of only 8, indicating highly pessimistic sentiment in the larger timeframe, which may suppress the daily rebound.
4-Hour timeframe: The trend is bullish! MA5 is 67560.22, MA10 is 67385.04, MA30 is 66961.48, and the price of 68255.34 is above the moving averages. Key resistance is at the recent high of 68589.49, with support near MA30 at 66961.48. In a fearful sentiment, the 4-hour rebound appears somewhat "counter-trend," so caution is advised.
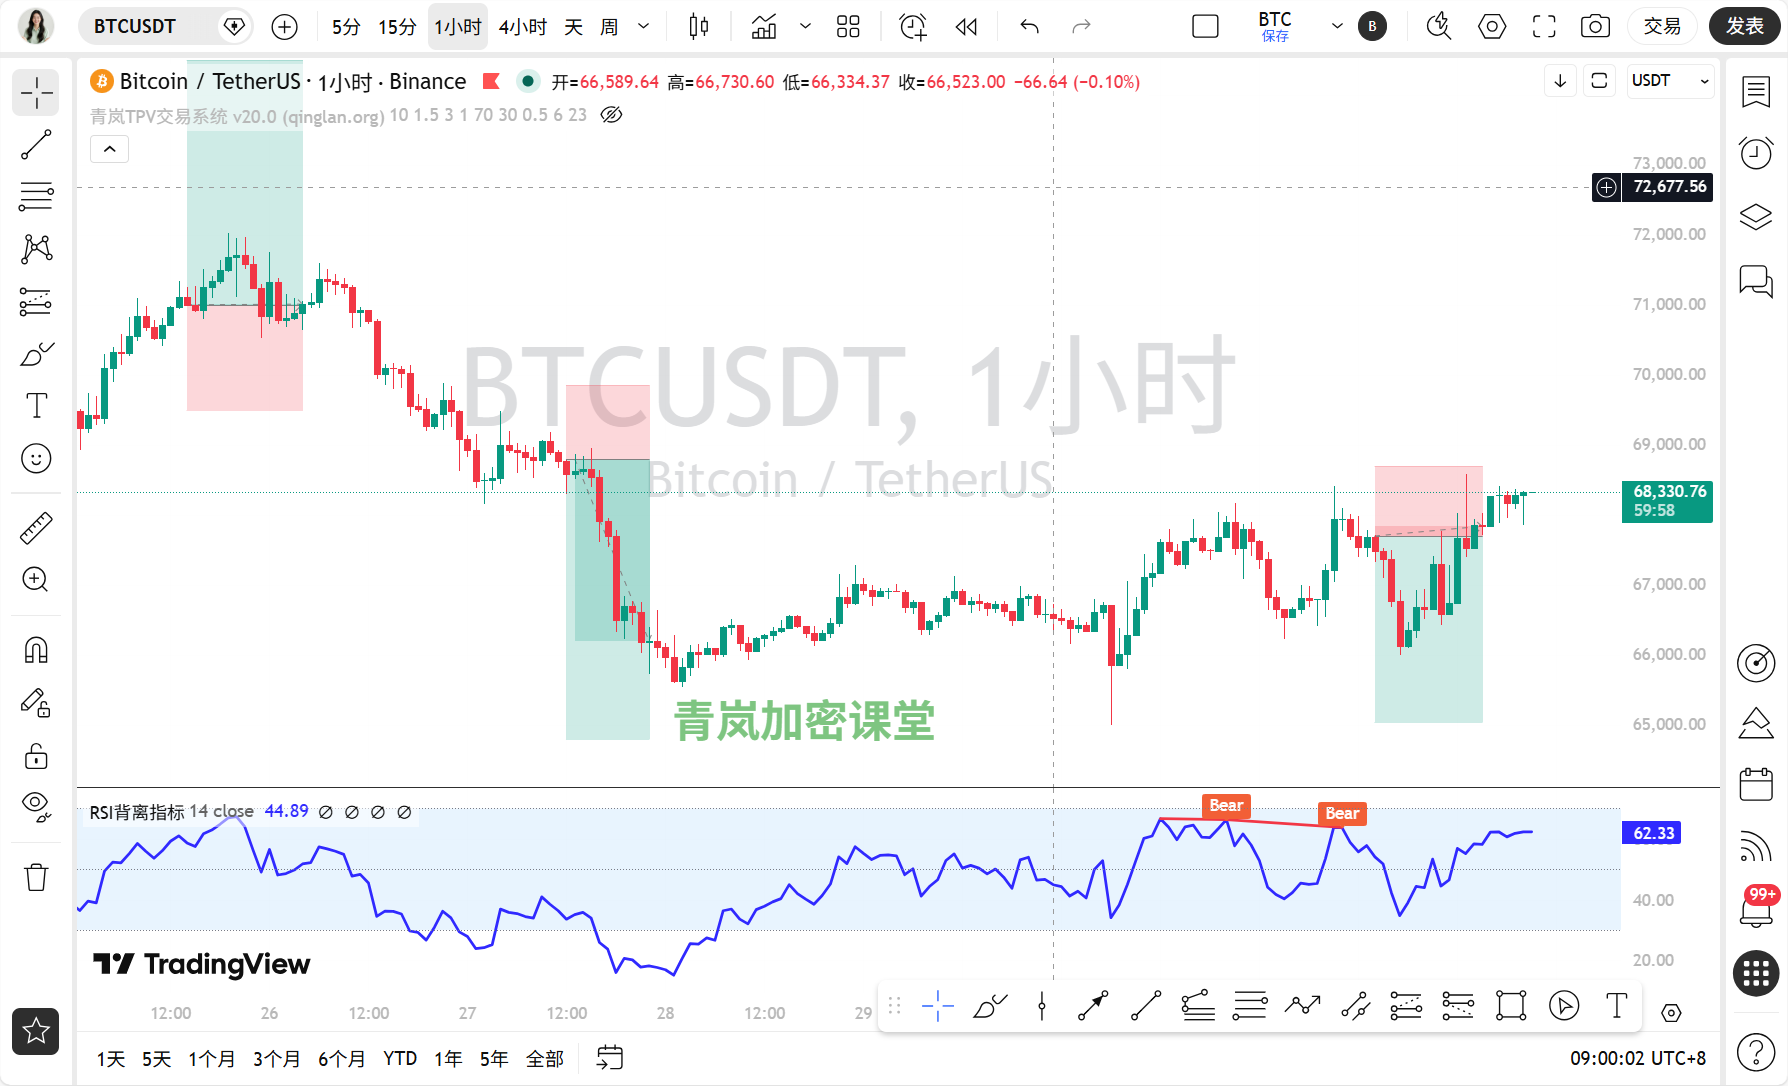
1-Hour timeframe: The trend is also bullish! MA5 is 68264.29, MA10 is 68047.24, MA30 is 67387.64, and the price of 68255.34 is near MA5 and MA10. Key resistance is at the recent high of 68378.64, with support at MA10 of 68047.24. This timeframe shows a resonance between sentiment and price trends, but the RSI is somewhat high.
15-Minute timeframe: The trend is mixed moving averages, MA5 is 68139.62, MA10 is 68196.72, and the price of 68255.34 is near the moving averages. This falls into a consolidation pattern, with resistance at 68330.75 and support at 68000.0. Short timeframes are influenced by the larger sentiment, and volatility may increase.
News relevance: The news mentions "Bitcoin breaking through the $68000 barrier" and "whale movements," which align with the bullish movements in the 1-hour and 4-hour timeframes. However, "institutional buying enthusiasm cooling down" and "Coinbase premium index falling" resonate with the pessimistic sentiment of the daily timeframe.
Step Two: Find pivot points, draw key lines (valid highs and lows + trend lines)
Valid highs (resistance) and valid lows (support) are coming up:
1-Day: Valid high at 68589.49 (recent high), valid low at 65998.05 (recent low). This low has been tested multiple times, indicating strong validity.
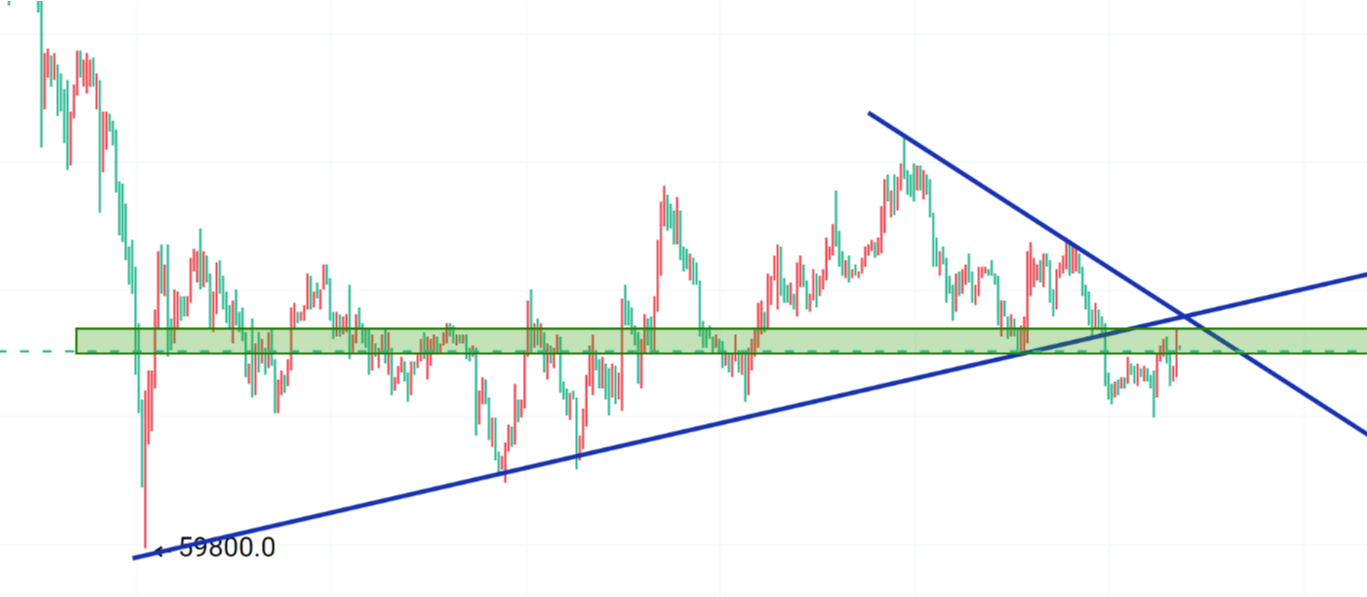
4-Hour: Valid high at 68589.49, valid low at 67853.3. A rising trend line can be drawn connecting the low points of 67853.3 and 66729.28, with the current price on this line, having touched it twice.
1-Hour: Valid high at 68378.64 (latest high), valid low at 68150.01 (latest low). Recently, there is also an important low at 67853.3.
15-Minute: Valid high at 68330.75, valid low at 68000.0. The range of consolidation is very clear.
News impact: The "whale transferring 5500 Bitcoins," such a large movement, can easily trigger price fluctuations at key pivot points, requiring close attention.
Step Three: Indicators for support (technical indicators verification)
State of indicators for each timeframe:
1-Day: MACD's DIF is -641.95, DEA is -349.00, histogram is -292.95, in a death cross state, with momentum down. RSI is 40.85, neutral and slightly weak, not oversold. This verifies the bearish trend in the daily timeframe.
4-Hour: MACD's DIF is -12.95, DEA is -245.86, histogram is 232.91, in a golden cross state, with momentum up. RSI is 63.74, neutral and slightly strong. Indicators support a bullish rebound in the 4-hour timeframe.
1-Hour: MACD's DIF is 321.06, DEA is 208.09, histogram is 112.97, in a golden cross state, with momentum up. However, the RSI is 71.02, already in the overbought zone! This suggests that the upward momentum may be overstretched and caution is warranted for a potential correction.
15-Minute: MACD's DIF is 122.74, DEA is 150.81, histogram is -28.07, no cross, with weak momentum. RSI is 53.67, neutral. Indicators for the short timeframe show consolidation without a clear direction.
Divergence situation: Currently, 1-hour RSI is overbought, and the price is making new highs (68378.64), indicating potential risks of a top divergence that should be approached with caution.
Step Four: Bull vs Bear wrestling (news + on-chain)
News aspect:
Positive factors: Bitcoin breaking through $68000, Iran's ceasefire statement boosting market rebound, U.S. stocks related to crypto rallying, Ethereum strong breakout.
Negative factors: Quantum computing threatening Bitcoin security, institutional buying cooling off, ETF net inflow turning negative, Coinbase premium index continuously dropping, whales depositing BTC to exchanges.
Core factors: The two most important are "weak inflow of institutional funds" (bearish) and "geopolitical easing (Iran)" (bullish). Negative fund flow may persist, while event-driven positives may ferment in the short term. Currently, the technical aspect (1-4 hour bullish) slightly diverges from the news aspect (mix of bullish and bearish), but daily technical and pessimistic sentiments resonate.On-chain data:
The fear and greed index is 8, indicating extreme fear! This shows that market sentiment is very poor, acting as a contrary indicator.
Bitcoin's dominance is 56.25%, the data hasn't shown changes, but the high proportion indicates that funds remain focused on Bitcoin.
Total market capitalization is 2.428 trillion, with a 24-hour change of +0.52%, showing a slight increase.
On-chain sentiment (extreme fear) resonates with daily technical (bearish), but diverges from the 1-4 hour technical rebound (bullish). Fund flows indicate minor increases in the overall market, but sentiment is extremely pessimistic, and this divergence should be watched closely.
Step Five: The path of least resistance (trading strategy)
In summary, the contradictions across multiple timeframes are obvious: daily bearish + extreme fear, but short and medium-term (1-4 hours) are bullish and prices are above the moving averages. The path of least resistance may lean towards "shorting on highs," but one must wait for signals of weakening in the short-term rebound.
Key entry area: Near the key resistance of 68378.64 in the 1-hour timeframe, or near the MA10 resistance of 68375.25 in the daily timeframe.
Stop loss criteria: If the price strongly breaks through and stabilizes above 68589.49 (the daily and recent high from 4 hours ago), then the bearish logic becomes invalid.
Target area: The first target looks at the 1-hour support of 68150.01, and the second target is focused on the 4-hour trend line support around 67853.3.
Today's trading thought: I am inclined to find short opportunities in the 68375-68380 area, with stop losses set above 68600, targeting 68150 and 67850.
Step Six: What to expect today (market prediction)
Current (within a few hours): Expected to fluctuate between 68000 and 68400, with a slight downward bias, as the 1-hour RSI is overbought and needs to adjust.
Key for today and the near term: The most important resistance today is at 68378.64 and 68589.49. The most important support levels are 68150.01 and 67853.3. Attention needs to be paid to the support effect of the 4-hour rising trend line.
Trading thought: The current most suitable trading direction is "shorting on highs." Reason: The daily bearish pattern remains unchanged, on-chain sentiment is extremely fearful, and the 1-hour timeframe shows overbought conditions and potential top divergence, making shorting near key resistance levels more favorable for risk-reward ratios.
Summary: The core conflict in the current market is between the extremely fearful long-term sentiment and the short and medium-term technical rebound.
Trading golden quote: Opportunities are born in fear, but swimming against the current of the "whales" requires a keen understanding of the tide's power.
[Qinglan's personal opinion]
Honestly, seeing the fear index at only 8 gives me pause, the market is really too pessimistic. But in trading, we cannot only focus on sentiment; we must respect price. Right now, the price is stuck on the short-term moving averages, but the daily big picture has not turned bullish yet. Therefore, I prefer to cautiously test shorts at high points during rebounds, setting proper stop losses, as protecting capital should always be the top priority. Remember, in extreme fear, rebounds are often weak; don’t let a single bullish candle change your perspective!
[TPV system historical verification] Based on nearly 508 historical backtests (sample size 519), the accuracy rate is 71.7% (last backtest time 04-01 09:00:37). Backtest results are for reference of strategy confidence, past performance does not guarantee future returns.
This TPV system has been crafted through years of monitoring, reviewing, and practical experience; I can’t say it’s 100% accurate, but it at least helps us feel more confident at critical positions. If you want to get the latest entry opportunities captured by my TPV system as soon as possible, feel free to visit the Qinglan Crypto Classroom official website www.qinglan.org, see you in the classroom!
免责声明:本文章仅代表作者个人观点,不代表本平台的立场和观点。本文章仅供信息分享,不构成对任何人的任何投资建议。用户与作者之间的任何争议,与本平台无关。如网页中刊载的文章或图片涉及侵权,请提供相关的权利证明和身份证明发送邮件到support@aicoin.com,本平台相关工作人员将会进行核查。