Coin Ocean Waves: 3.31 Bitcoin (BTC) Market Analysis Reference:
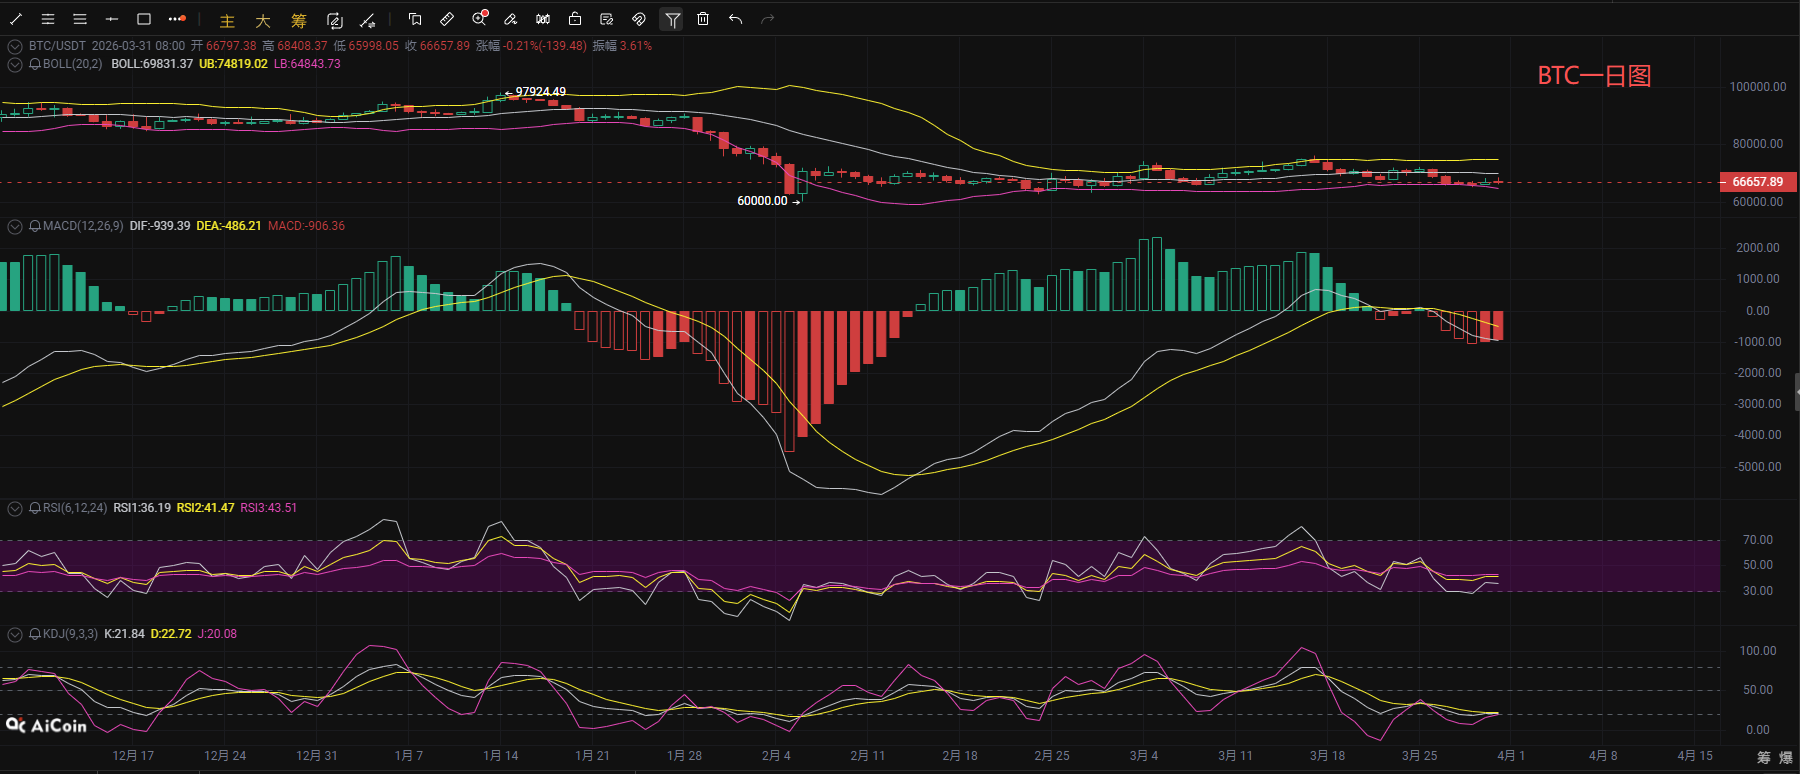
Bitcoin experienced a surge this morning, but the upward trend could not sustain, with the coin price touching the 68400 line under pressure and gradually retracting all previous gains. As of the time of writing, the current price is around 66600. From the Bitcoin daily chart, the current price operates below the EMA moving average system, and the short-term moving averages are in a bearish arrangement, with the price in a medium-term bearish trend framework. In terms of technical indicators, the KDJ three lines are running at low levels, lacking bullish rebound momentum; the MACD's DIF and DEA lines are both below the zero axis, while the bearish momentum weakens with a reduction in the histogram, but bullish counterattack signals are unclear; the RSI three lines are in a weak range below 50, not reaching extreme oversold, reflecting a alleviation of selling pressure but weak buyer support. Overall, it is judged that the short-term price will likely maintain a weak oscillation in the 65000-69000 range, with a key focus on the support at the 65000 round number. If this position is broken, it may further probe the 63000-64000 area, and it is suggested that friends in the coin community prepare for risk control in advance.
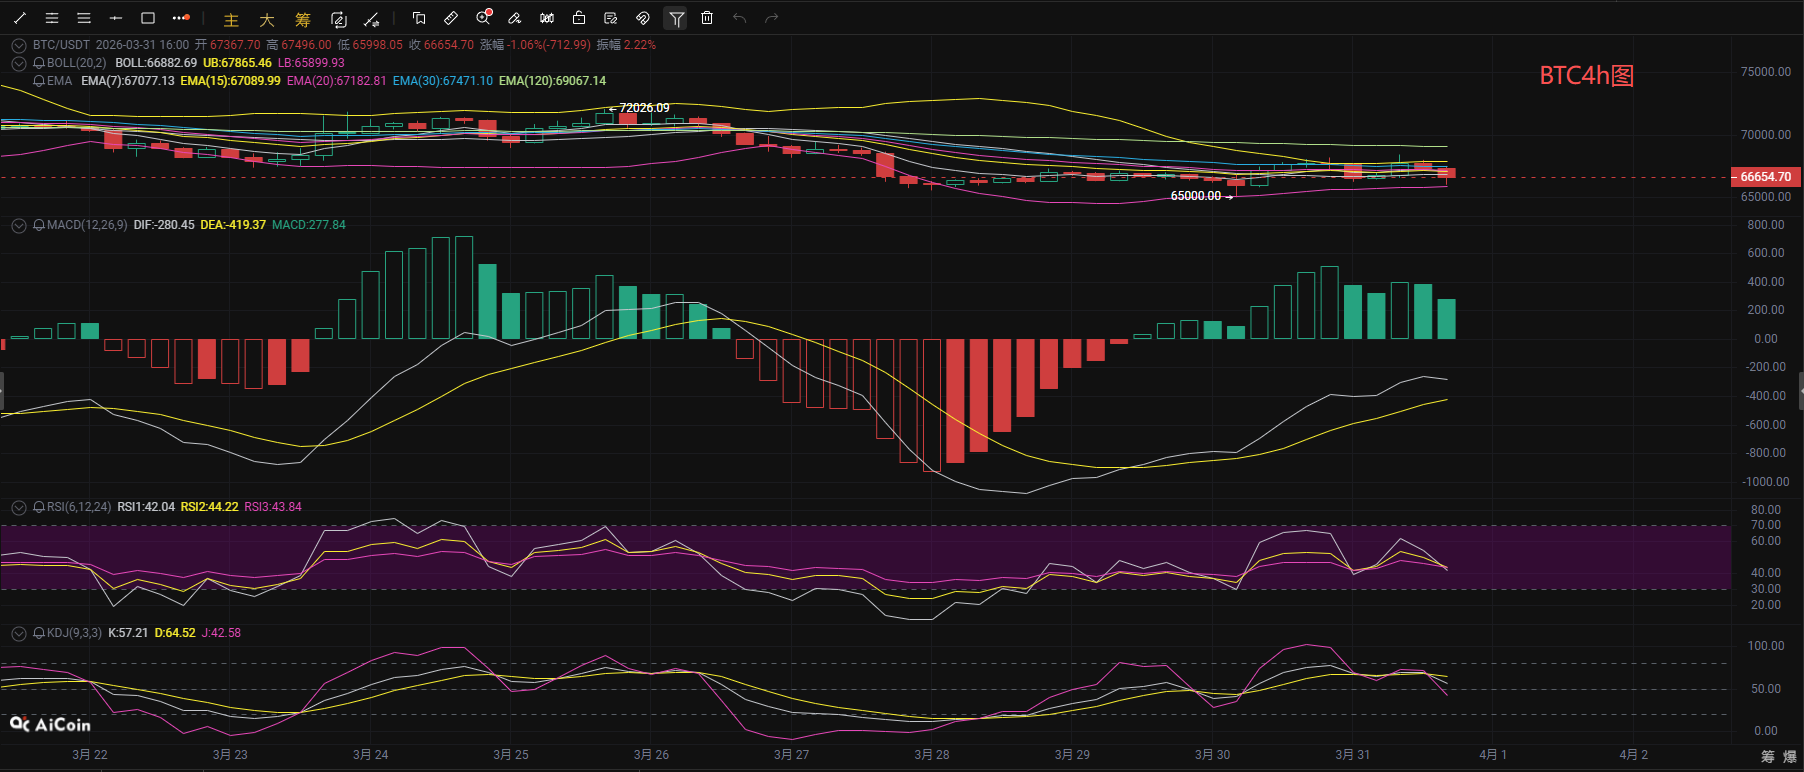
From the short cycle hourly chart, the 4-hour level moving average system shows a short-term suppression crossing below the long cycle, with the short-cycle EMA moving averages running downward and applying pressure on prices, maintaining a bearish framework; the Bollinger Bands indicate the price is operating below the middle track approaching the lower track, with the lower track forming short-term support, currently in a consolidation phase, and the narrowing of the Bollinger Bands suggests the market is about to choose a breakout direction. In the MACD indicator, both the DIF and DEA lines run below the zero axis, with a reduction in the histogram indicating a weakening of bullish momentum, while both the RSI and KDJ indicators have receded to low levels, with the pace of value momentum recovery being slow; there is a technical rebound demand in the short term, but if the rebound phase lacks effective volume support, the market is likely to weaken again and continue the downward rhythm. It is recommended to wait for a low price pullback to enter long positions for a more stable approach.
Coin Ocean Waves: 3.31 Bitcoin Short-term Reference:
Long Position: Buy in the 64900-65900 range, stop loss 500 points, targets 66800-67800-68800,
Short Position: Sell in the 67800-68800 range, stop loss 500 points, targets 66800-65800,
Coin Ocean Waves: 3.31 Ethereum (ETH) Market Analysis Reference:
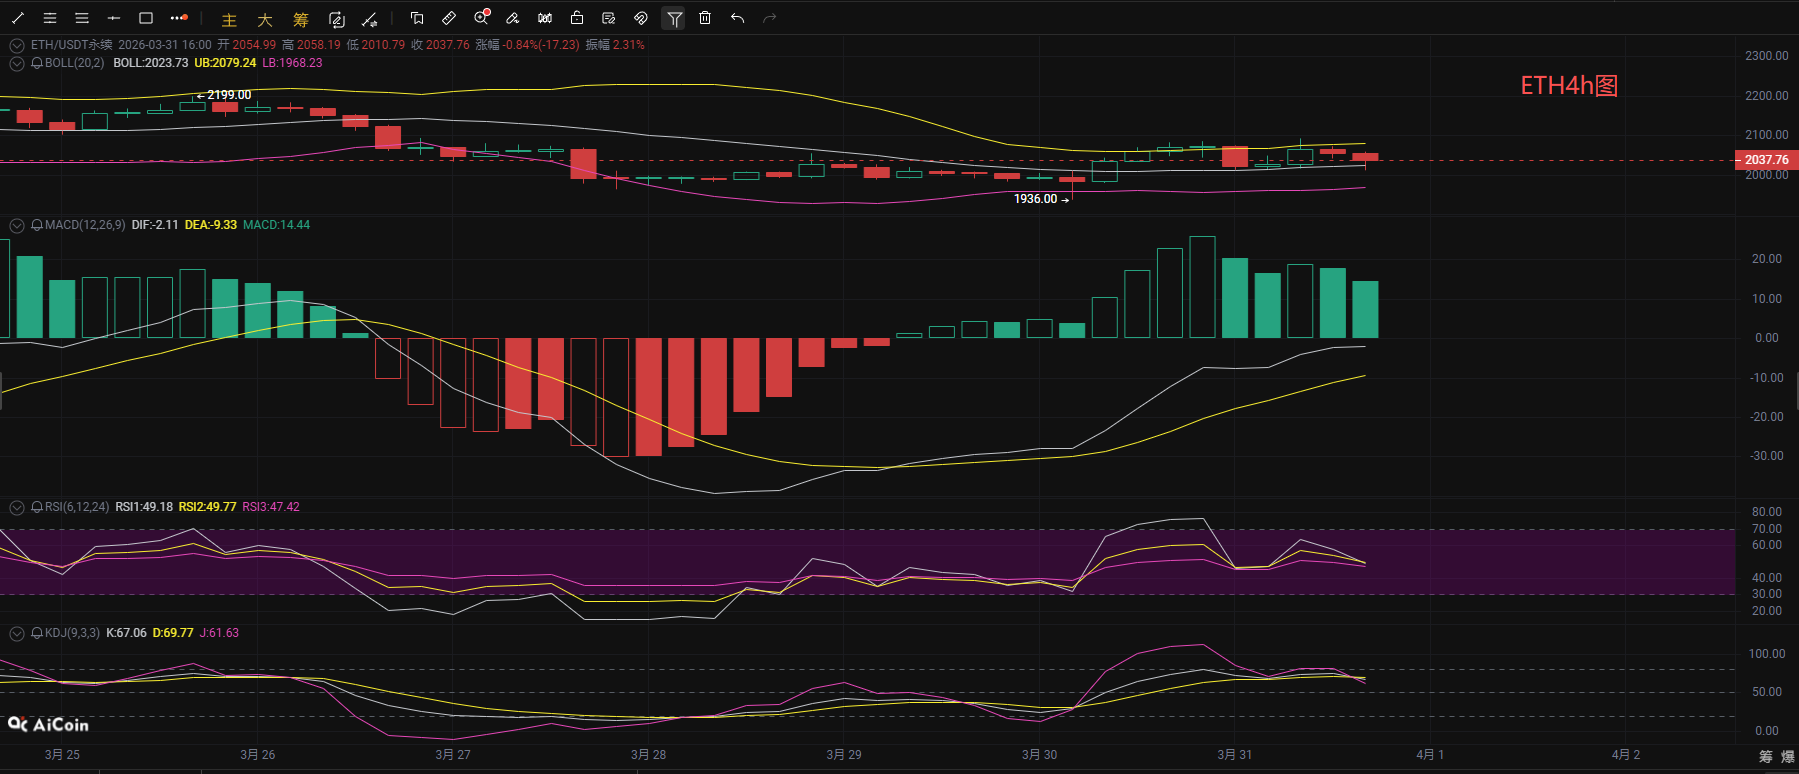
The trend of Ethereum is similar to that of Bitcoin, currently operating around the middle track of the BOLL band on the 4-hour level, the upper track forming short-term pressure, and the lower track at 1968 being key support. The current price has not yet broken through the boundary, continuing the oscillation rhythm. In the MACD indicator, the DIF is above the DEA, and the histogram is gradually reducing, with bullish momentum not forming strong releases, while bearish momentum still dominates; the RSI indicators are all in the weak area below 50, with insufficient bullish rebound momentum. The KDJ indicator shows the three lines contracting and diverging downwards, with the J value not entering the oversold area, indicating a lack of conditions to form a golden cross in the short term, meaning that bears still have some release space while bulls find it difficult to directly initiate a strong rebound. Subsequent attention needs to be focused on the breakthrough signals of the BOLL band boundaries.
Coin Ocean Waves: 3.31 Ethereum Short-term Reference:
Short Position: Sell in the 2075-2115 range, stop loss 30 points, targets 2035-1985,
Long Position: Buy in the 1965-2005 range, stop loss 30 points, targets 2035-2085,
[The above analysis and strategies are for reference only. Please bear the risks yourself, the article may have delays in review and publication, and strategies may lack timeliness. Do not operate blindly.]

This content is originally shared by 【Coin Ocean Waves】 and only represents personal opinions. The article is sent with delays, for reference only, and do not operate blindly! Want to get more daily real-time orders? Then follow my public account! Here, you can engage in online technical learning on the market and learn relevant knowledge about out-of-the-money strategies. I have years of research experience in the market and focus on the major trends in the coin circle. Mainly responsible for analyzing and guiding investment operations in BTC, ETH, SOL, BCH, and other coins. Welcome to study and research together.
免责声明:本文章仅代表作者个人观点,不代表本平台的立场和观点。本文章仅供信息分享,不构成对任何人的任何投资建议。用户与作者之间的任何争议,与本平台无关。如网页中刊载的文章或图片涉及侵权,请提供相关的权利证明和身份证明发送邮件到support@aicoin.com,本平台相关工作人员将会进行核查。