Trading Direction Strategy Suggestions
Idea: Look bullish in line with the trend, but do not blindly chase highs.
Entry/Position Increase Points
Entry on Pullback: The ideal short-term long position occurs when the price retests the 67400 - 67500 range and does not fall below it.
Breakout to Chase Long: If it can break through 68500 with volume, one may chase up to around 69800 .
Take Profit Point: First target 68800, second target 69800
Stop Loss Point: Strictly set below 66700. Falling below here means the short-term reversal signal is invalidated.
Key Levels
Strong Resistance: 68800 (recent high point suppression) 70000 (psychological barrier)
Strong Support: 67400 (short-term support) 66700 (MA120 support line)
News Summary
Quarter-End/Month-End Reallocation Pressure: Today is the last day of March and the first quarter, institutions and funds face settlement and weight adjustments. Historically, quarter-end often comes with intense volatility, and some profit-taking may occur.
Spot ETF Fund Flow Warms Up: After a continuous net outflow last week, the US spot BTC ETF recorded a slight net inflow over the past 48 hours, indicating strong institutional support below 66000.
Large On-chain Holder Dynamics: Data shows significant accumulation signs around 67000, with some whale addresses beginning to withdraw funds from exchanges, suggesting short-term selling pressure is decreasing.
Macro Data Outlook: The market is holding its breath for this weekend's non-farm payroll data, as well as the halving expectations in mid-April. Prior to major data releases, short-term long and short battles will lean more towards technical analysis.
Technical Analysis
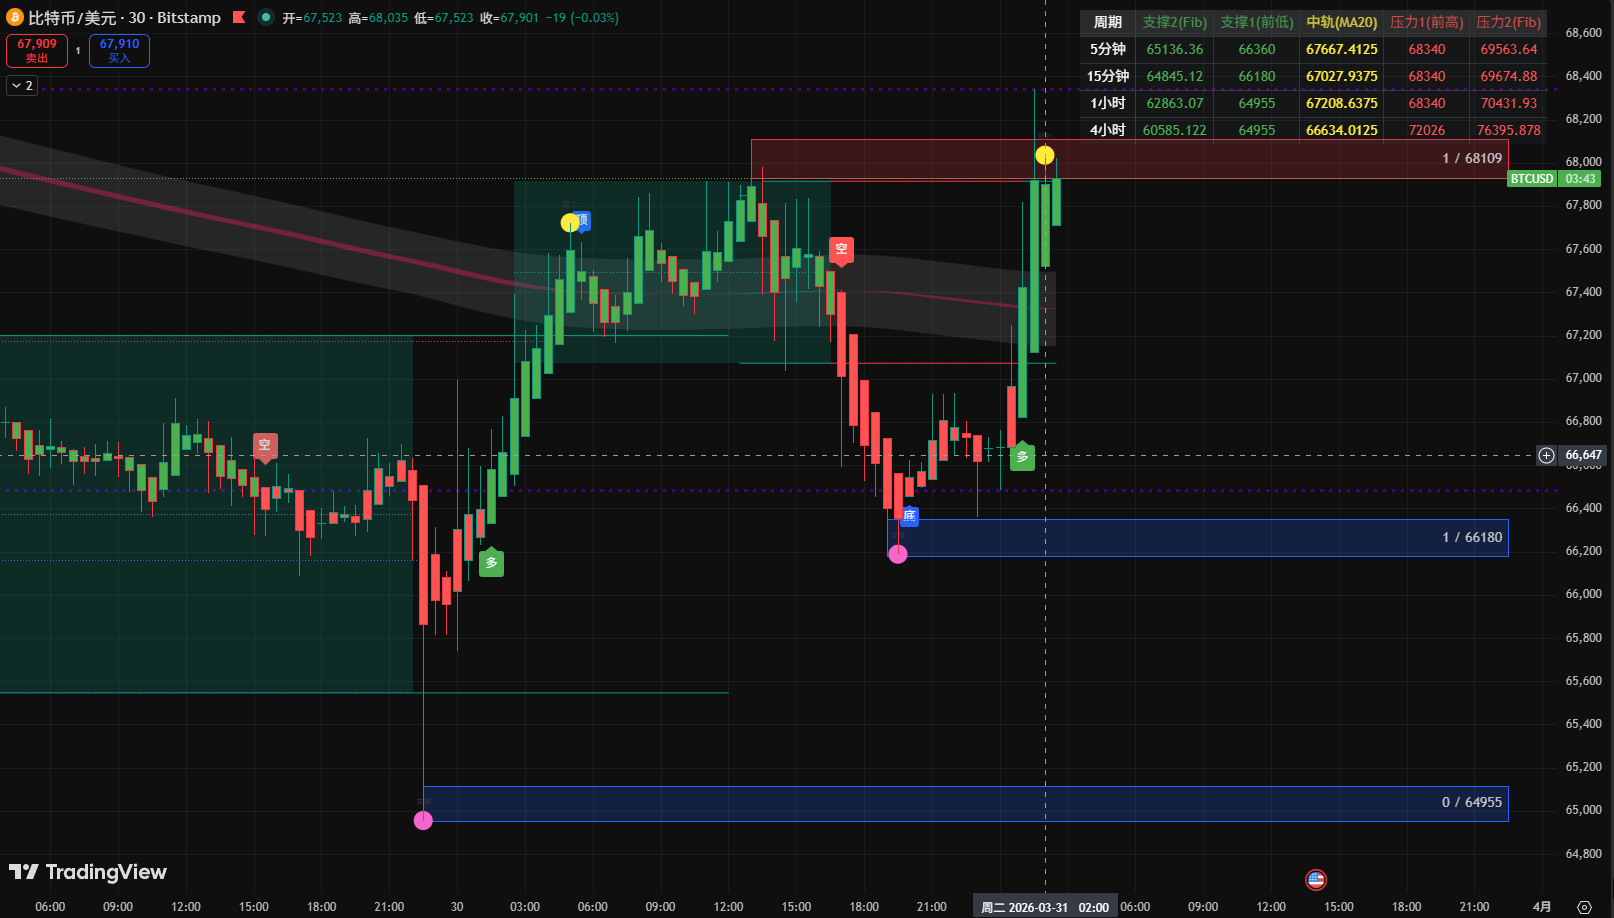
Current Price: Approximately 67900
Pattern Analysis
The chart shows that after retesting the 65000 support, a strong rebound started, reaching a peak of 68408. Currently, it is in a high position correction phase after the surge. The 30-minute chart displays a clear “ascending flag” or high position consolidation.
Moving Averages
MA120 (66700) has transformed from resistance to strong support.
The short-term moving average system is in a bullish arrangement, with the price operating above MA5, indicating that short-term bulls are still in control.
MACD: Above the zero line, although the red bars have slightly shortened, a dead cross has not occurred, showing that upward momentum is still present, just at a slower pace.
RSI: Currently in the mid-high position and has not entered the overbought zone, implying there is still room to rise.
Risk Warning
Major Risk Point - “Quarter-End Inducement”: Be cautious of the main force intentionally raising prices to attract retail investors before the close, followed by a “harvest” washout in early April.
Refuse to hold positions; if the price breaks down with volume below 66,500, decisively set a stop loss to prevent the market from further declining to the 64000 support area.
Lock in profits; currently holding long positions near 65000, it is recommended to close half near 68500, setting a “trailing break-even loss” for the remainder.
“Trading is not a technical issue, it is a human issue.” The current market is enticing, but it is also in a sensitive high position, maintain your “baseline” and do not fight against the market.
Free Authorized TV Long and Short Indicator to Help Beginners and Veterans Not Get Lost in the Market

免责声明:本文章仅代表作者个人观点,不代表本平台的立场和观点。本文章仅供信息分享,不构成对任何人的任何投资建议。用户与作者之间的任何争议,与本平台无关。如网页中刊载的文章或图片涉及侵权,请提供相关的权利证明和身份证明发送邮件到support@aicoin.com,本平台相关工作人员将会进行核查。