News: The bearish trend remains unchanged, liquidity games intensify
Federal Reserve and U.S. Treasury (significant negative news): The March FOMC meeting confirmed that interest rates will remain at 3.50%-3.75%, and the dot plot suggests only one rate cut in 2026 (original expectation was more than two). The yield on the 10-year U.S. Treasury has risen above 4.3%, significantly increasing the holding cost of gold.
Dollar movement (negative): The U.S. Dollar Index (DXY) is firmly above 105, as strong U.S. economic data (ISM manufacturing data exceeded expectations) has overshadowed gold, positioning the dollar as a “safe-haven + high-yield” asset.
Geopolitical situation and sentiment: The situation in the Middle East (especially the Strait of Hormuz) remains highly tense, pushing oil prices above $100. While this should boost gold, the market currently interprets it as “inflation threats leading to higher rates,” with investors taking profits in the gold market to cover crude oil margins, leading to a failure of safe-haven status and a liquidity-driven situation.
Summary: Overall fundamentals are significantly bearish
Technical Analysis: 4-Hour Level
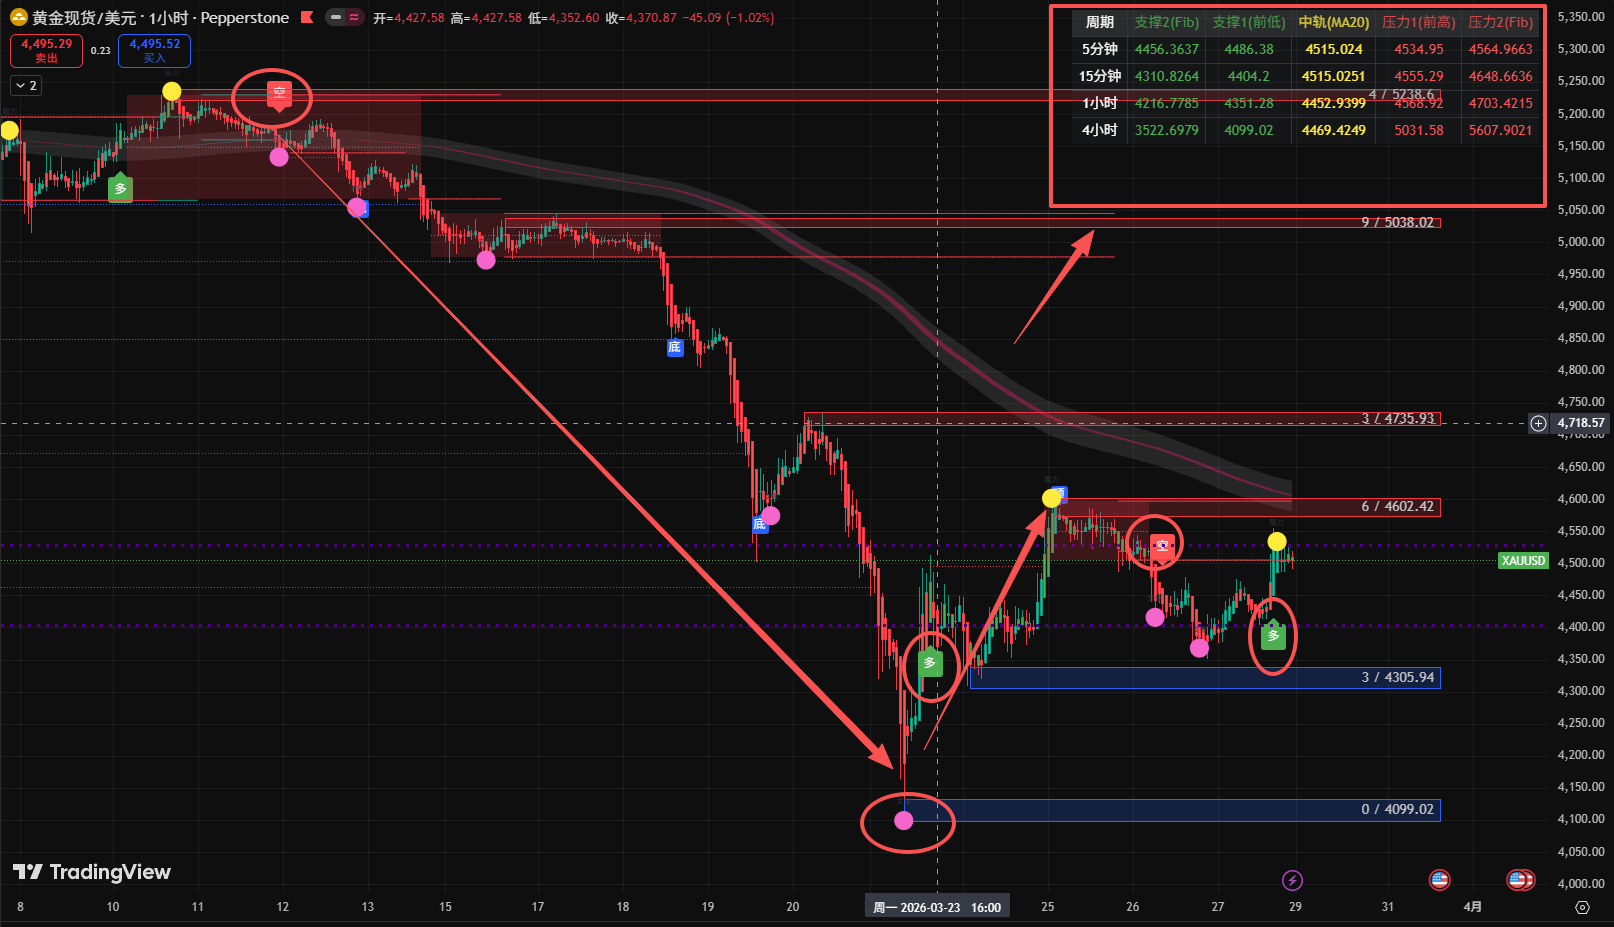
Current price: About 4499 Gold prices have experienced an 18% drop from 5400 in mid-March, and are currently in a low fluctuation zone.
Key levels
Resistance: 4560 - 4580 (MA52 suppression zone at the 4-hour level, also recent multiple highs during rebounds).
Support: 4400 integer level and 4350 (bottom of previous dense fluctuation range).
Moving Average System (MA): MA24 (4481) and MA52 (4424) provide short-term support below, but MA120 (4472) has been frequently breached, and the slope is downward.
Operational Direction: Mainly short positions
Entry Range: 4525 - 4550 (based on the 4-hour resistance zone).
Stop Loss: 4595 (if this level is breached, the bearish structure is disrupted).
Take Profit: First target 4440, second target 4385
Risk Warning
Maximum Risk Point: Liquidity squeeze. The volatility characteristic of March 2026 is “sharp drops and sharp rises.” If gold prices unexpectedly fall below 4400, it could easily trigger large-scale stop-loss sell-offs by institutions holding long positions, potentially pressing down to 4200 or even 4099
Absolute Taboo (Not a holding zone)
Short Position Holding: If it unexpectedly stabilizes above 4600 (with increased volume), it indicates that geopolitical risks have re-emerged as a dominant factor, and short positions need to be stopped out.
Today (March 29) is a Sunday, with market liquidity mainly concentrated on a few platforms; spreads may widen, and operations should leave points to prevent “false spikes.”
Follow to get the TV long-short fluctuation signal indicator for free

免责声明:本文章仅代表作者个人观点,不代表本平台的立场和观点。本文章仅供信息分享,不构成对任何人的任何投资建议。用户与作者之间的任何争议,与本平台无关。如网页中刊载的文章或图片涉及侵权,请提供相关的权利证明和身份证明发送邮件到support@aicoin.com,本平台相关工作人员将会进行核查。