Cryptocurrency Expert: The recent rebound of Ethereum at 3.25 is merely a flash in the pan, and the bearish trend will continue! Latest market analysis and thought references.
The current price of Ethereum is 2120, ETH2114 is grinding the bottom, don’t be fooled! This is not the bottom, just a bear's adjustment! The long-term trend is still bearish; blindly buying the dip will only get you trapped. The rebound is the best shorting opportunity; going with the trend is the key! I have said long ago that 2114 is merely a weak fluctuation after an overselling situation; the long-term downward trend hasn’t broken. Buying the dip now is like catching a falling knife! Instead of betting on a rebound, it is better to short along the trend; isn’t it nicer to secure profits steadily?
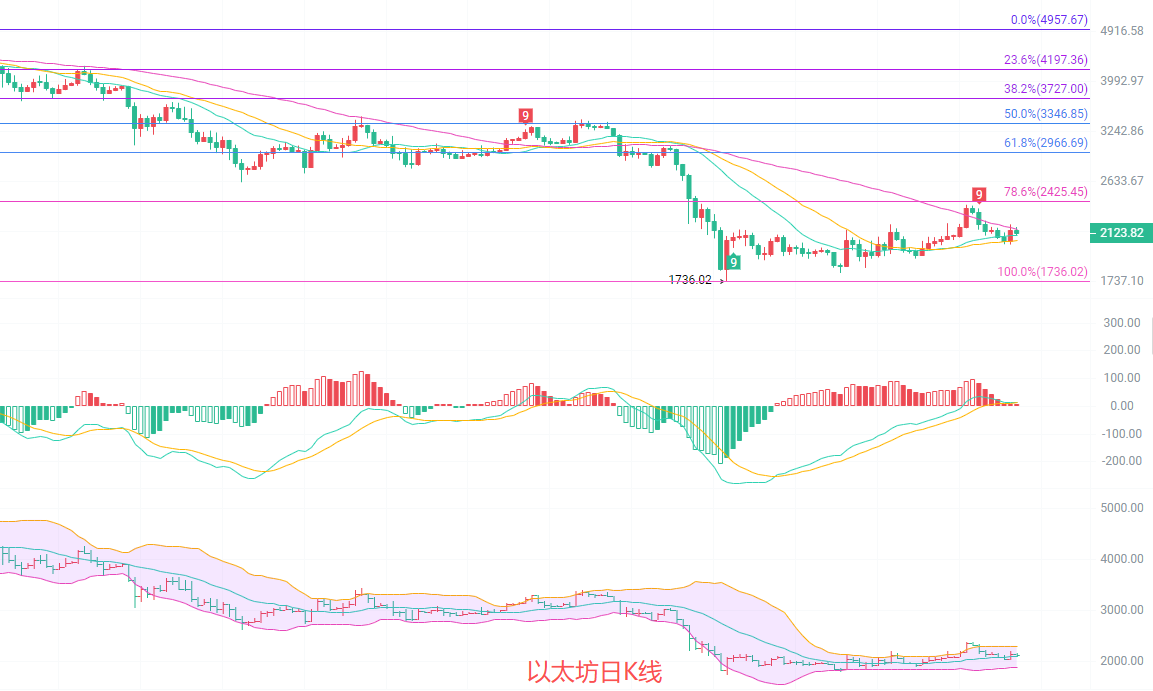
The daily line is dominated by a downward trend, and the rebound is weak. Overall, the daily trend of Ethereum is still within a downward framework: currently grinding the bottom around 2114, without breaking the previous descending trend line. The MACD green bars have narrowed, but the DIF is still hovering around zero, with insufficient northbound momentum and a dominant downward trend. The price is pressured below the MA20 and MA30 moving averages, with MA60 continuing to apply downward pressure; the arrangement of moving averages downward has not been broken.
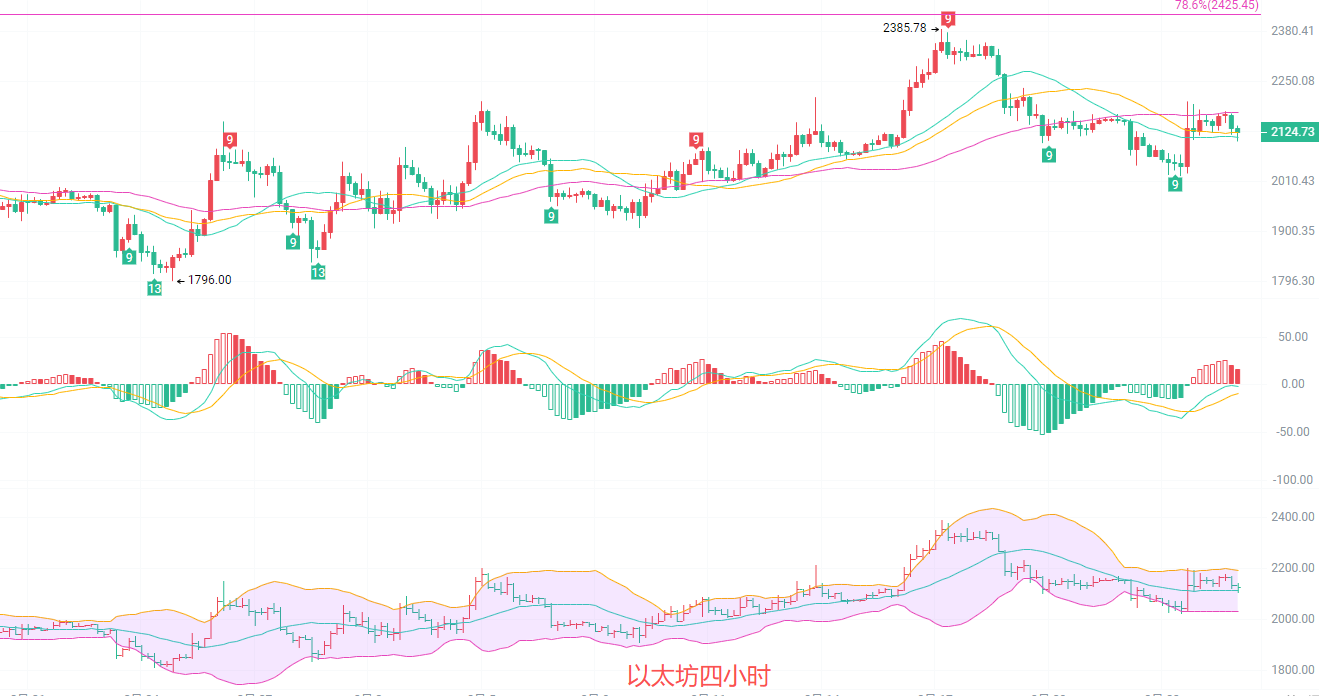
The four-hour chart shows a converging triangle at the end, and a change is imminent. The price has fallen from a high of 2385, with the lows gradually rising and the highs gradually lowering, forming a converging triangle pattern; the fluctuation range continues to narrow, and the window for change has been opened. The MACD red bars are continuously shrinking, and there are signs of a death cross between DIF and DEA. The RSI has dropped to around 50, indicating that the northbound momentum is waning, and the downward force is gradually accumulating. The upper triangular pressure is at 2170, and the lower support is at 2080. Once it breaks either side, a trending market will be triggered.
Short-term reference: (Real-time data has been updated; for details, consult the author)
Buy northbound from 2080 to 2100, with a stop-loss at 2050, target at 2160 to 2180.
Sell southbound from 2150 to 2170, with a stop-loss at 2245, target at 2100 to 2080. If it breaks below 2080, continue southbound to 2050 to 2020.
Specific operations should be based on real-time market data. For more detailed information, you can consult the author. The publication of the article has a delay; it is advised for reference only, and risks are to be borne by yourself.

Warm reminder: The above content is solely created by the author of the public account. The advertisements at the end of the article and in the comment section are unrelated to the author; please be cautious in your discernment. Thank you for reading.
免责声明:本文章仅代表作者个人观点,不代表本平台的立场和观点。本文章仅供信息分享,不构成对任何人的任何投资建议。用户与作者之间的任何争议,与本平台无关。如网页中刊载的文章或图片涉及侵权,请提供相关的权利证明和身份证明发送邮件到support@aicoin.com,本平台相关工作人员将会进行核查。