Everyone, we meet again. I'm Sister Qinglan. Today, let's break down the data at hand and see what story the market is really telling. Remember, price action is the most honest language of the market, and we need to learn to listen.
Market Structure Identification: "Twisted Twists" in Multiple Timeframes
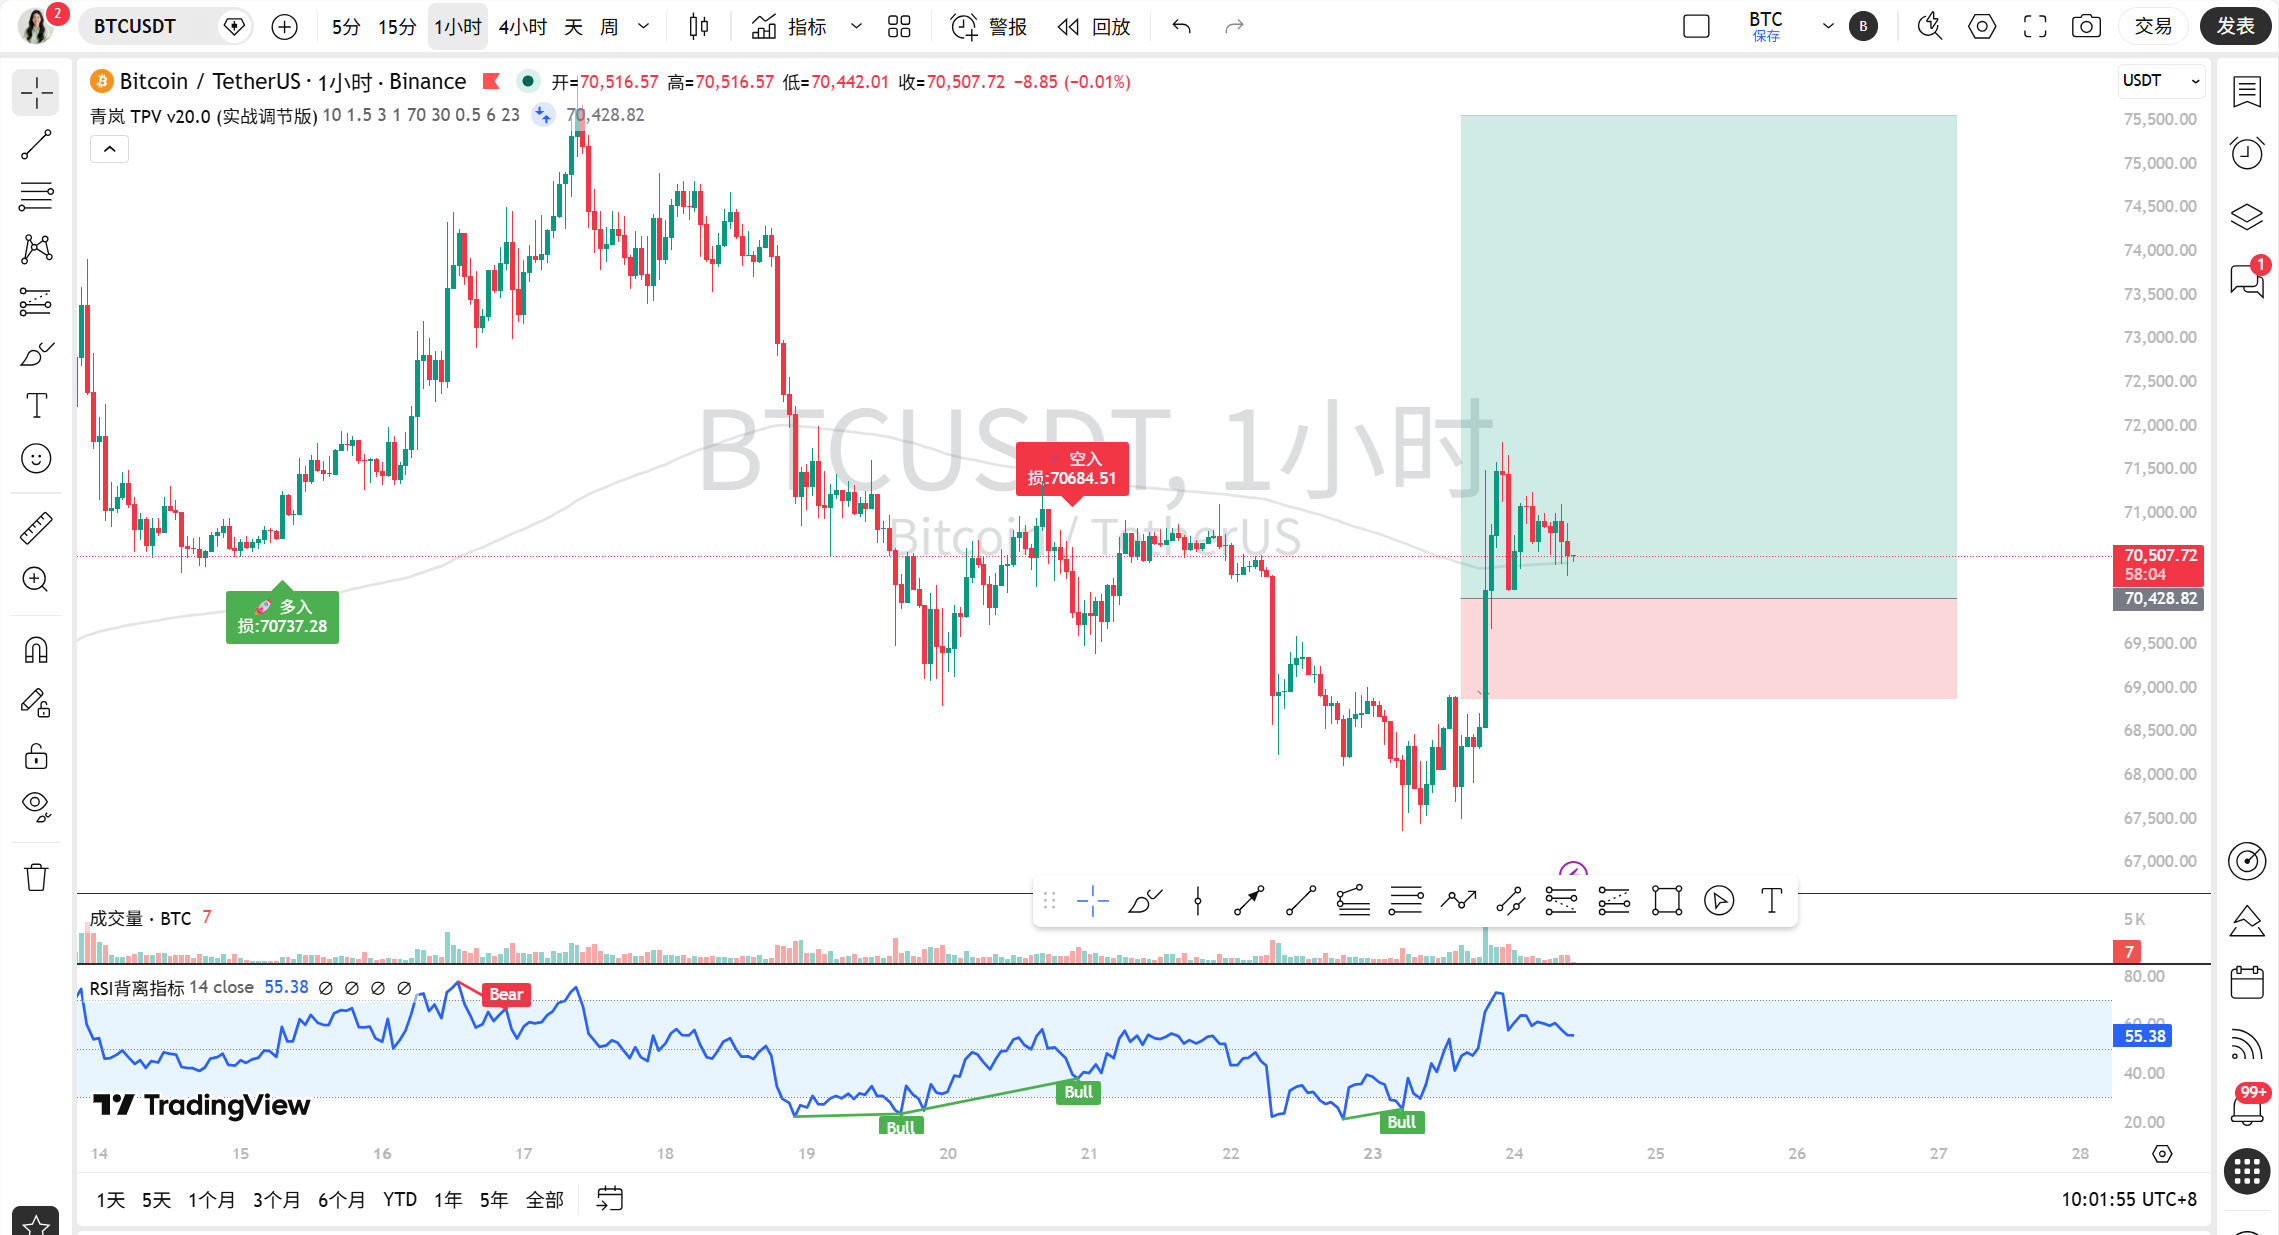
Let's start by looking from a larger perspective to a smaller one. On the daily chart, the latest closing price is 70518.84. Looking back, the high was 70906.45, before that it was 67859.0, and even earlier it was 68918.12. As for the lows, the most recent one is 70278.46, while before that it was 67445.18. You see, the highs have not continuously made new highs, and the lows have not continuously made new lows. The price is fluctuating back and forth between the range of 67445.18 and 70906.45, a typical oscillating structure, with unclear direction.
The 4-hour chart is similar. The latest closing price is 70518.84, with recent highs at 71099.96 and 70998.0, and lows at 70278.46 and 70404.39. The price is consolidating in the narrower range of 70278 to 71100, also oscillating.
The 1-hour chart starts to get interesting. Looking at the latest 20 candlesticks, the high is at 71099.96 (the fourth candlestick before the latest) and the low is at 70278.46 (the fifth candlestick before the latest). However, the latest price of 70518.84 is higher than the previous low of 70396.0 (the ninth candlestick before the latest) but has not broken the previous high, which can temporarily be seen as a weak rebound structure with a raised low, while still being confined within the oscillating range of the 4-hour chart.
The 15-minute chart is the most detailed but also the most "entangled." The price fluctuates between 70289.58 and 71499.0, with the latest closing price at 70518.84, situated in the lower-middle of this range. MA5 (70596.80), MA10 (70675.69), and MA30 (70784.23) are in a bearish arrangement, indicating short-term downward pressure. However, overall, the high of 71499.0 and the low of 70289.58 form a clear oscillating range.
Therefore, the conclusion is very clear: the market presents a "twisted twists" state across multiple timeframes, with daily and 4-hour charts showing wide oscillation, and 1-hour and 15-minute charts reflecting small-range tug-of-war within a larger range, without a unified trend direction.
Key Levels and Price Rejection Signals
In the data from the past 24 hours, several price levels were repeatedly tested. 👉 One is the area above 71000 USD. On the 1-hour chart, 71099.96 (the fourth candlestick before the latest) and 70998.0 (the tenth candlestick before the latest) form significant resistance. The price has approached here several times but has been pushed back, as seen with the candlestick that hit 71099.96 but closed at 70906.45, with a long upper shadow showing selling pressure.
Another is the 70300-70400 area. On the 15-minute chart, 70365.02 (the second-lowest price of the latest candlestick) and 70404.39 (the lowest price of the latest 14th candlestick) provided repeated support. The latest price of 70518.84 is currently holding above this area.
As for the typical Pin Bar or engulfing pattern, there are no prominent formations in the current data sequence. The latest few candlesticks have small bodies and not extreme shadows, with no textbook-level strong reversal signals found. No typical price rejection patterns were identified.
Volatility Nature Judgment: Typical Oscillation Exhaustion
Let's take a look at the latest 10 15-minute candlesticks (from a closing price of 70592.21 to 70518.84). Their bodies are very small; for example, from 70720.55 to 70592.21, the body is only about 128 USD; from 70679.2 to 70565.48, the body is about 114 USD. At the same time, the upper and lower shadows are also generally not long, such as the highest price of 70891.53 to the lowest price of 70365.02, which shows a fluctuation range of about 526 USD, which is narrow for Bitcoin.
This characteristic of small bodies, short shadows, and narrowing fluctuation range is a typical sign of oscillation exhaustion (Consolidation). Both the bulls and bears have temporarily reached a weak balance at this position, waiting for new information to break the deadlock. This is not the calm before a trend rush but rather a rest after exhaustion of strength.
Bull-Bear Strength Comparison: Collision of Emotional Freezing Point and Technical Stalemate
On-chain data has a lot of information. First is the Fear and Greed Index, which currently stands at only 11, entering the "extreme fear" level. Looking back historically, it dropped from 26 (fear) on March 18 to 11 on March 24, indicating that market sentiment has reached the freezing point. This is usually a contrarian indicator, suggesting that the market may be overly pessimistic. BTC's dominance has reached 56.64%, indicating that funds are still highly concentrated in Bitcoin, and the altcoin season has not arrived yet. The total market value is 2.49 trillion USD, with a 24-hour change of +2.88%, showing a slight overall warming trend in the market, but not significant. Overall, on-chain sentiment is extremely low, but funds have not massively withdrawn from Bitcoin, presenting a "fear-based clustering" state.
As for the news front, I distilled three core points. The first is geopolitics (easing of US-Iran tensions), which temporarily eliminates a risk of uncertainty and is a positive factor that triggered the earlier rebound from 67669.99 to 71499.0. The second is institutional dynamics (Core Scientific obtaining financing, Hostplus pension fund's interest), which is a medium to long-term positive factor providing potential buying interest for the market. The third is internal market signals (shrinking trading volume, massive whale sell-offs, bearish derivatives), which are short-term bearish or warning signals, indicating a lack of sustained upward momentum, with large players taking profits at highs. Currently, the news front is mixed, lacking a single strong directional push.
At this moment, the technical and news fronts are in a state of "divergence." The technical aspect is a stalemate of oscillation, lacking direction; while on-chain sentiment is in extreme fear, which often indicates a possible reversal. However, the mixed signals on the news front lack an immediate catalyst to trigger this reversal. Thus, there is a collision between stalemate and freezing point emotions, waiting for sparks.
Least Resistance Trading Direction: Maintain Caution, High Sell Low Buy within Range
In summary, the market hasn't provided a clear directional trend. Therefore, the safest strategy is to remain cautious or only engage in high sell low buy trading within strictly defined ranges.
If you want to operate more aggressively:
Key resistance area: 71000-71100 area (referencing the 1-hour highs of 71099.96 and 70998.0). If the price tests this area again and shows signs of weakening upward momentum (such as long upper shadows), consider lightly shorting.
Key support area: 70300-70400 area (referencing the 15-minute lows of 70365.02 and 70404.39). If the price falls back to this level and shows signs of halting the decline, consider lightly longing.
Stop-loss basis: set the stop-loss for shorting above the recent high, such as at 71200; set the stop-loss for longing below the recent low, such as at 70200.
Target areas: in an oscillating market, targets should not be set too far. Look upward toward the previous high around 71499, and downward look at the 69800-70000 area.
Remember, in an oscillating market, chasing upsurges and falling prices is a major taboo. Be patient and wait for prices to reach the boundary of the range, and look for entry signals based on smaller candlestick patterns.
Conclusion and Golden Words
The core contradiction in the current market is the confrontation between the extremely fearful on-chain sentiment and the directionless technical stalemate.
Here’s a golden phrase for everyone: the market establishes a bottom in fear, rises in hesitation, and collapses in frenzy. Now that fear has reached its peak, what you need besides courage is the patience to wait.
[Qinglan's Personal View]
Personally, I feel that the market is like a tight rubber band. The on-chain sentiment has stretched to the limit of "extreme fear," yet prices are stuck and reluctant to fall. This is usually not a bad thing, indicating that selling pressure may be exhausting. However, just having a sentiment low is not enough; a strong bullish candle with volume is needed to confirm the return of bulls. There have been various small moves by institutions in the news, indicating unseen currents. What we need to do now is to closely monitor the support area of 70300-70400. If it can hold alongside increasing volume, then perhaps we can look forward to the second half of the spring season. Of course, if it breaks down, we will need to reassess. The market is never short of opportunities; what is lacking is prepared individuals.
For more quantitative dissection of real-time news impacts on market sentiment, visit my Qinglan Crypto Classroom: www.qinglan.org
免责声明:本文章仅代表作者个人观点,不代表本平台的立场和观点。本文章仅供信息分享,不构成对任何人的任何投资建议。用户与作者之间的任何争议,与本平台无关。如网页中刊载的文章或图片涉及侵权,请提供相关的权利证明和身份证明发送邮件到support@aicoin.com,本平台相关工作人员将会进行核查。