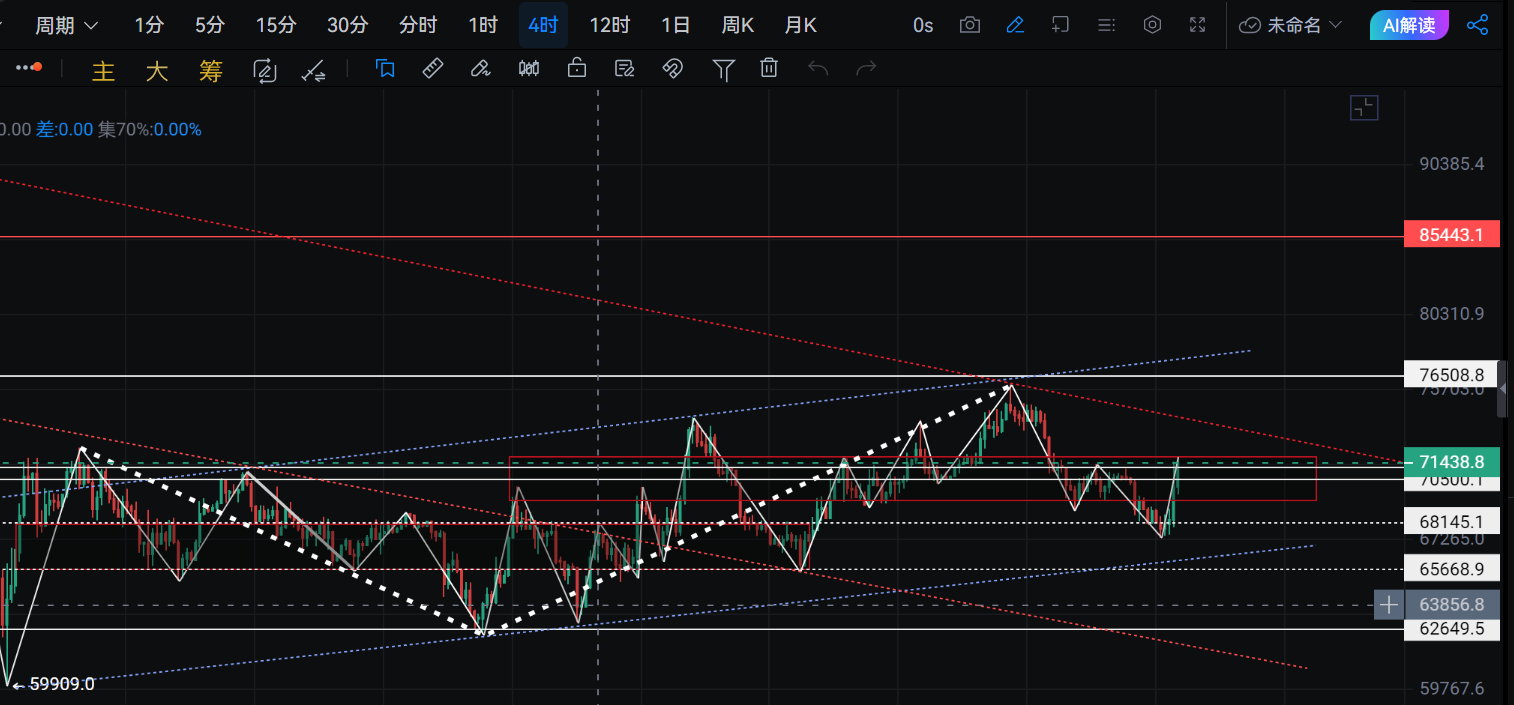
Good evening everyone, I am Xin Ya. Let's do a brief recap. Starting from the early morning of March 23rd, the big coin had six consecutive hourly bearish candles, dropping from around 69,000 to 67,300. The trading volume in the first few candles was not large, but there was divergence. Only the last candle showed an increase in selling pressure. In the morning, it consolidated with a weak trend, then rebounded. It faced pressure again around 69,000 and tested 67,500 once more. In fact, this consolidation process is quite normal; the only variable was that at seven o'clock in the evening, after some nonsense from Trump, the big coin surged 3,000 points to 68,500. Then the next candle pushed it up to around 71,800 after a pullback to around 69,600. The first bearish candle appeared. The important levels during this process were 68,500, 69,500, and 71,500. Now the big coin has entered the previous one-hour consolidation range of 69,500-71,800 and is around the one-hour MA200. Below, the one-hour EMA120 and 144 are between 70,000 and 70,300.
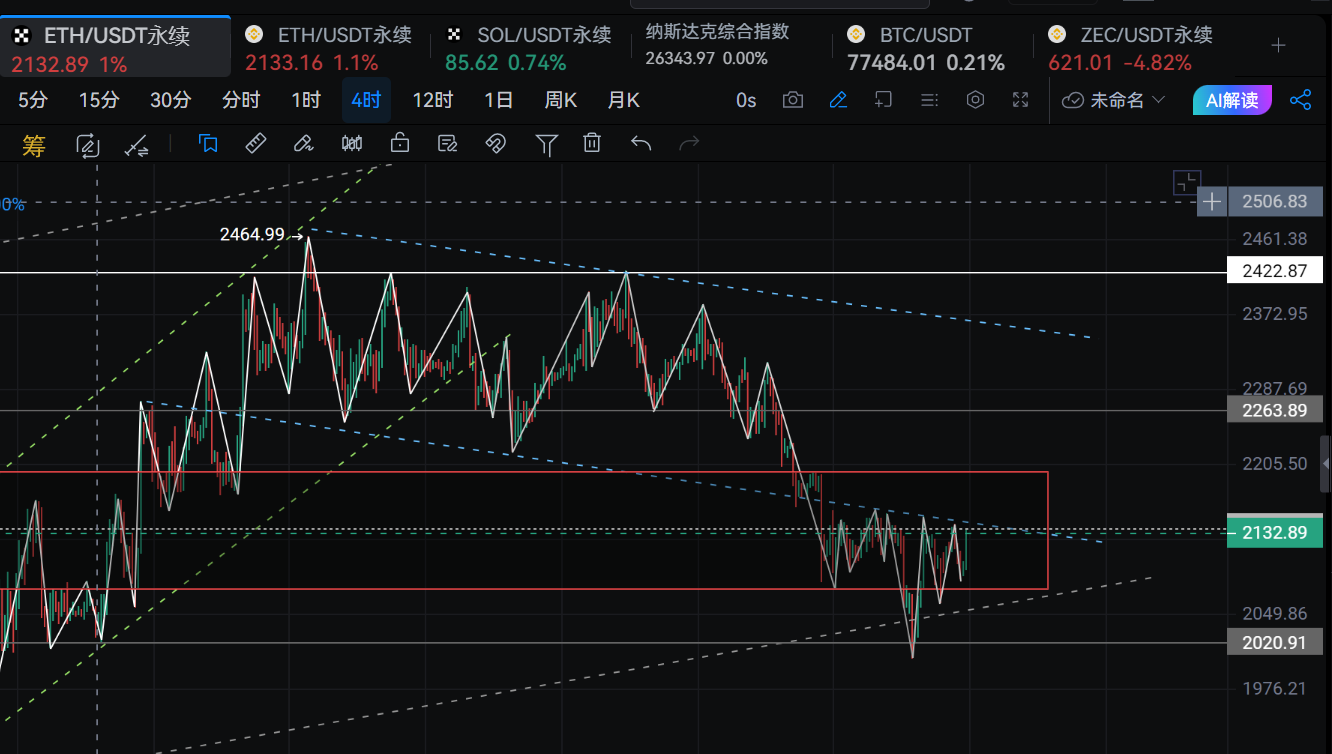
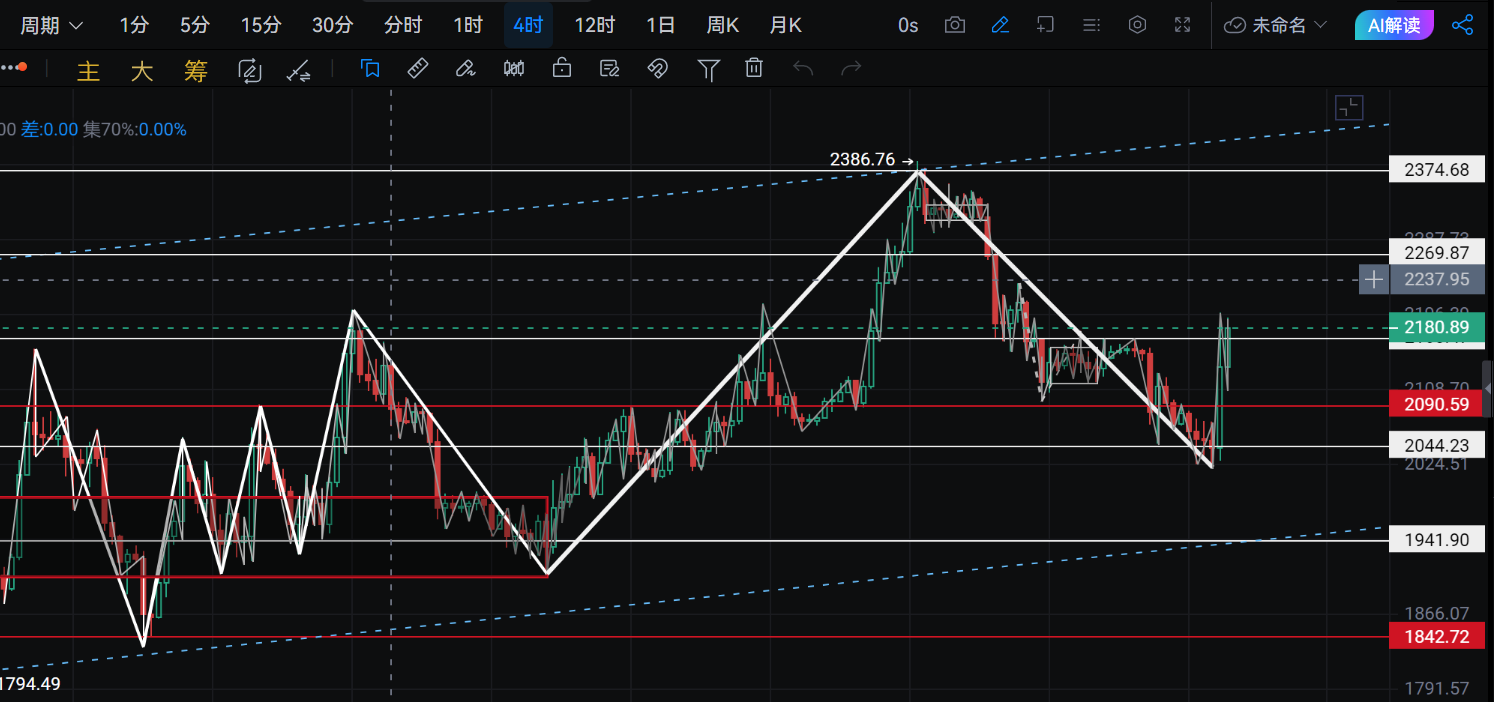
Today, Ethereum's lift-off point was around 2,050. The bullish candle at seven o'clock reached a spike at 2,200, closing in the one-hour EMA120, 144, and 2,130 range. The next candle tested the four-hour EMA120, 144 around 2,110 for confirmation. The evening push-up was different from the big coin as it did not refresh the high above again, instead, the first bearish candle appeared around 2,089. The bullish momentum started to weaken.
You can clearly see today's trend is completely the result of artificial manipulation. In this rebound, the big coin and Ethereum each exploded with 150 million shorts. The next step is that long positions will take profits and pull back first. The MACD on the hour and four-hour looks strong but is obviously a bit lagging.
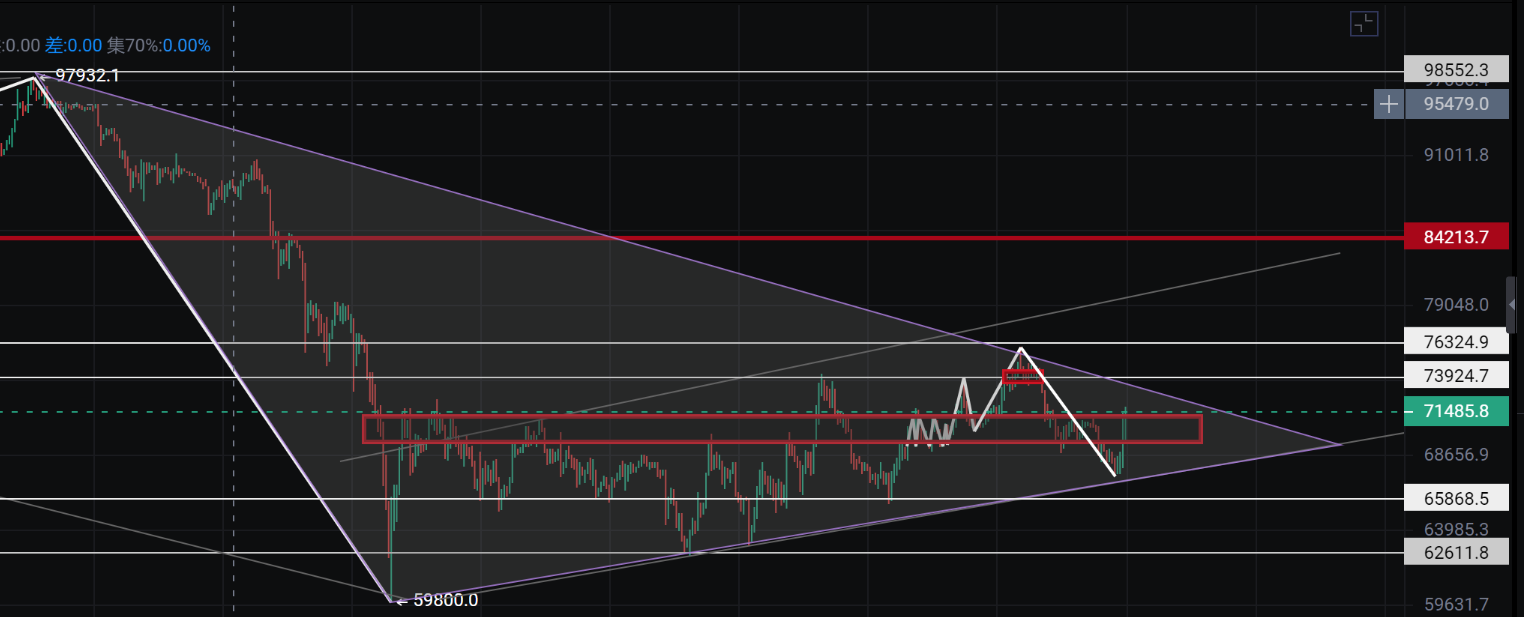
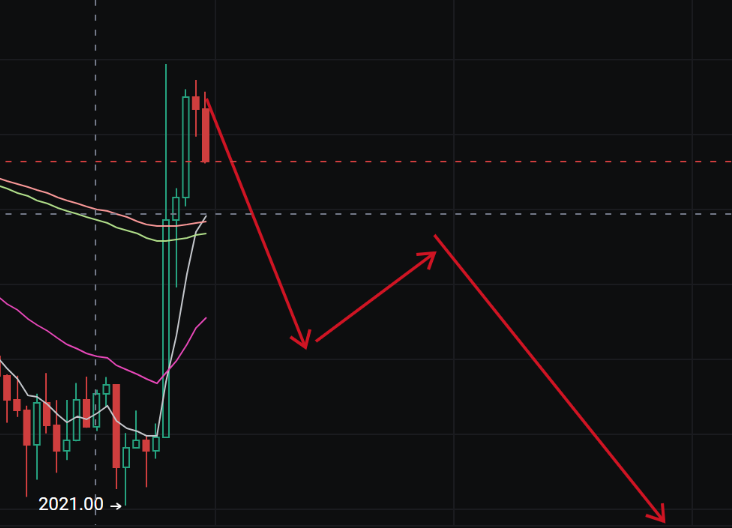
Recently, the market has been dealt with using short-term game strategies, leaving no possibility for two structures. Only tendencies are given. My thinking is to first test the moving averages and then seek support. For Ethereum, it is very obvious in the crossover area of multiple EMA moving averages, in the 2,110-2,130 range. For the big coin, it is 70,000-70,300. The structural changes in the future market need to be focused on. The market is experiencing a rebound, and whether this becomes the starting point for a relay or the last segment of a rebound before a bearish sweep needs to be observed in this area. I see the big coin and Ethereum first breaking below the moving averages, finding support, and then confirming whether the rebound turns that moving average into resistance. Finally, we will test the channel line and the first rising consolidation range. The charts and positions have been marked in these days. You can refer to them yourself.
Follow the official account: Xin Ya Talks about Trading.

免责声明:本文章仅代表作者个人观点,不代表本平台的立场和观点。本文章仅供信息分享,不构成对任何人的任何投资建议。用户与作者之间的任何争议,与本平台无关。如网页中刊载的文章或图片涉及侵权,请提供相关的权利证明和身份证明发送邮件到support@aicoin.com,本平台相关工作人员将会进行核查。