Cryptocurrency Scholar: Perspective on Capital Flow in Ethereum on 3.23, the Game of Major Players Escaping and Retail Investors Bottom Fishing! Latest Market Analysis
The current price of Ethereum is 2063. The Ethereum market in recent days has been a feast for us, while it has been a lesson for those trying to bottom fish. From warning not to bottom fish above 2200 as it directly plummeted south, to now continuing to fall around 2065, those who caught the rhythm have made profits, while those who didn’t listen are still being washed out repeatedly. Trading has never been about gambling; it’s about controlling risk before discussing profits. I hope you can remember this lesson! The current continued decline around 2065 is merely a continuation of the trend. It is clear on the chart: bearish momentum is still being released, the weak downward pattern remains unchanged, and any rebound is a trap for more buyers, so do not blindly bottom fish!
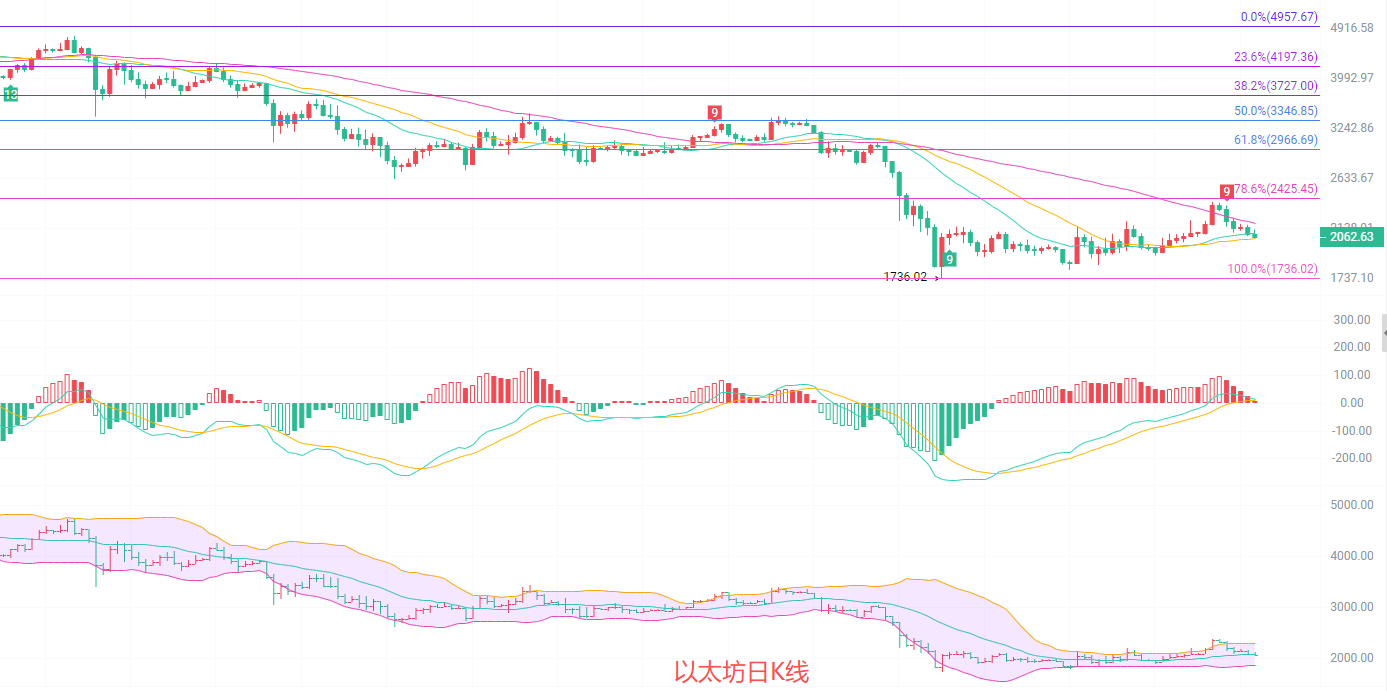
The daily bearish trend continues, after the high volume bearish candle was formed from the high of 2385, it is currently declining near 2065. The high forms a dark cloud cover, which currently belongs to the continuation of the trend after breakdown. The price has broken below the middle Bollinger Band at 2093, the MACD green bars have turned red and continue to increase, and the RSI has fallen from high levels to below 50, indicating that bullish momentum is completely exhausted, and bears dominate the market. The range from 2280 to 2385 has turned from support to strong resistance, with strong support below at 2050 to 2060, and resistance above at 2100 to 2120.
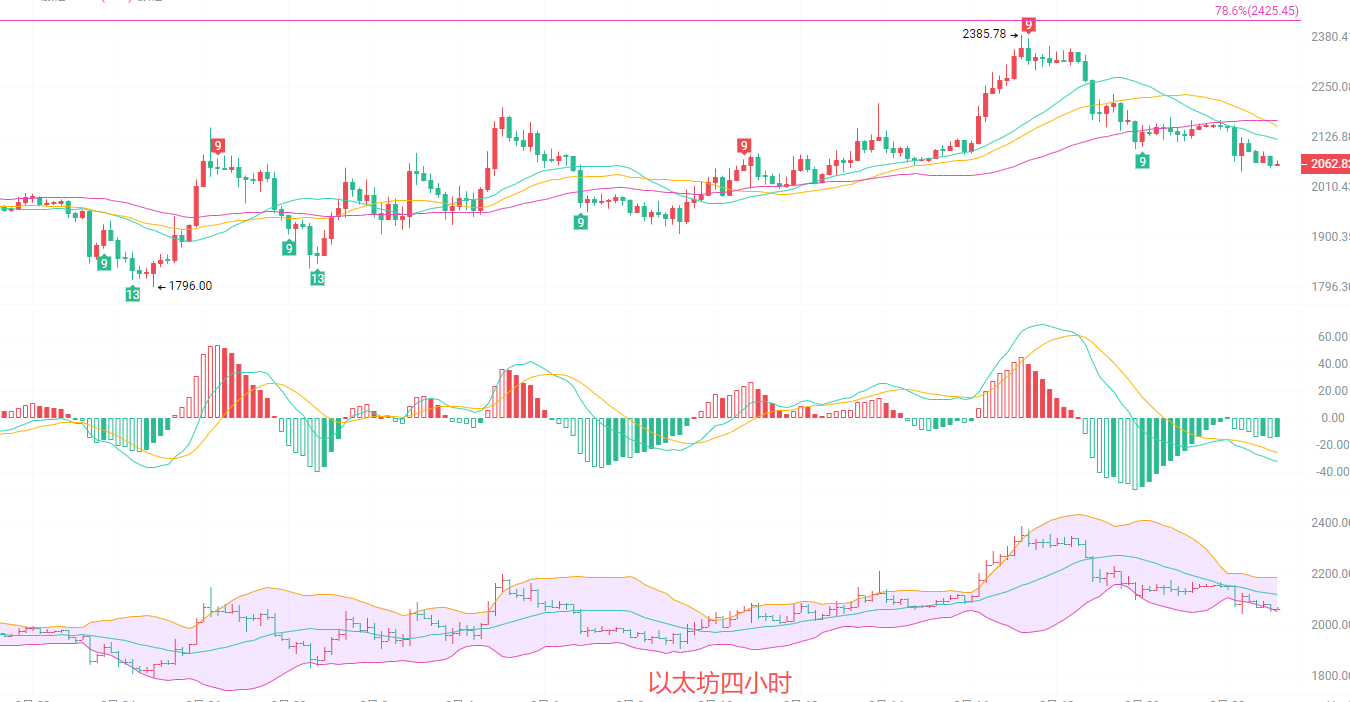
The four-hour moving average is in a bearish arrangement, the weak downward movement has clearly sustained a drop since the peak at 2385, currently trading near 2065. The EMA moving average has formed a bearish arrangement, with the price firmly pressed below the middle track at 2123. Any rebound is just a trap for more buyers and is definitely not a reversal signal. The MACD green bars continue to increase, with the RSI dropping to around 45, indicating that short-term bearish momentum is still being released, and the weak downward pattern is clear. The resistance above is at the middle Bollinger Band at 2120, and support below is at 2050. If the recent low breaks below 2050, it will further probe towards the 2000 mark.
Short-term reference: (Real-time trading data has been updated, please consult the author for details)
Below, from 2050 to 2060 go long, stop loss at 2030, target watch for a rebound to the resistance level of 2100 to 2120, and exit without holding on.
Above, from 2120 to 2100 go short, stop loss at 2140, target watch for a drop to 2060 to 2050, break below 2050 and continue down to 2020 to 2000.
Specific operations rely mainly on real-time data from the market; for more information, you can consult the author. There may be delays in article publication, so it is suggested for reference only, and risks are to be borne by yourself.

Friendly reminder: The above content is solely created by the author of the official account. Any advertisements in the comments section or at the end of the article are not related to the author. Please be cautious in distinguishing them, thank you for reading.
免责声明:本文章仅代表作者个人观点,不代表本平台的立场和观点。本文章仅供信息分享,不构成对任何人的任何投资建议。用户与作者之间的任何争议,与本平台无关。如网页中刊载的文章或图片涉及侵权,请提供相关的权利证明和身份证明发送邮件到support@aicoin.com,本平台相关工作人员将会进行核查。