Cryptocurrency Scholar: If Ethereum rebounds on March 22, it may exhibit characteristics of inducing longs! Daily level signals of a top and the logic of a mid-term correction are analyzed! Latest market analysis and thought reference
Current price of Ethereum is 2150, and it has been proven that following the trend is always safer than betting on a rebound. There are still people asking if they can catch the bottom? The answer is simple: the long-term bearish cycle has not changed, any rebound is a shorting opportunity, don’t confront the trend head-on! Yet some still want to hold onto positions and catch the bottom! Now that they are losing, they come asking what to do? Where were they earlier? The cryptocurrency world does not believe in regret; it only recognizes execution and understanding!
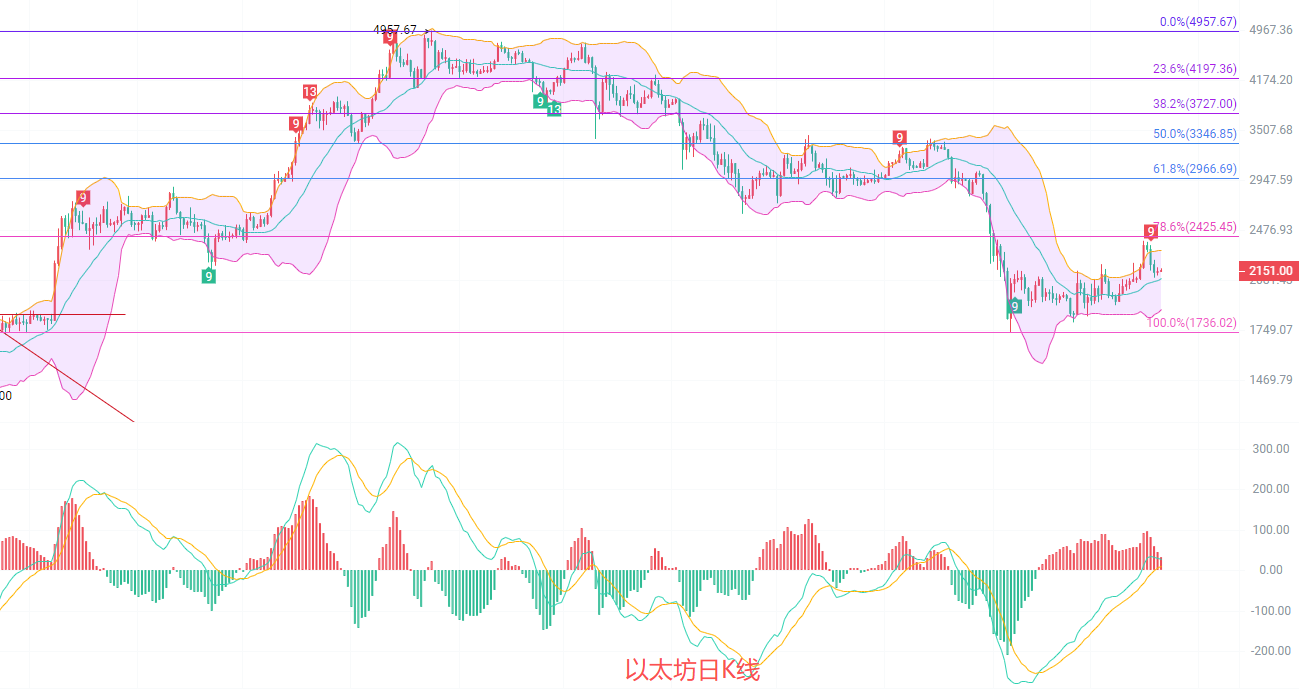
Daily weakness continues, after large volume selling at the high of 2385, currently weakly oscillating around 2150. The daily K-line formed a dark cloud cover, piercing the key support at 2280. The current situation is a technical recovery after an oversold condition, not a trend reversal. The price is operating above the middle track of the Bollinger Bands at 2095, with the MACD red bars turning green, DIF trending downward, and RSI retreating from highs to around 52, indicating a significant weakening of bullish momentum, while bears still dominate the market.
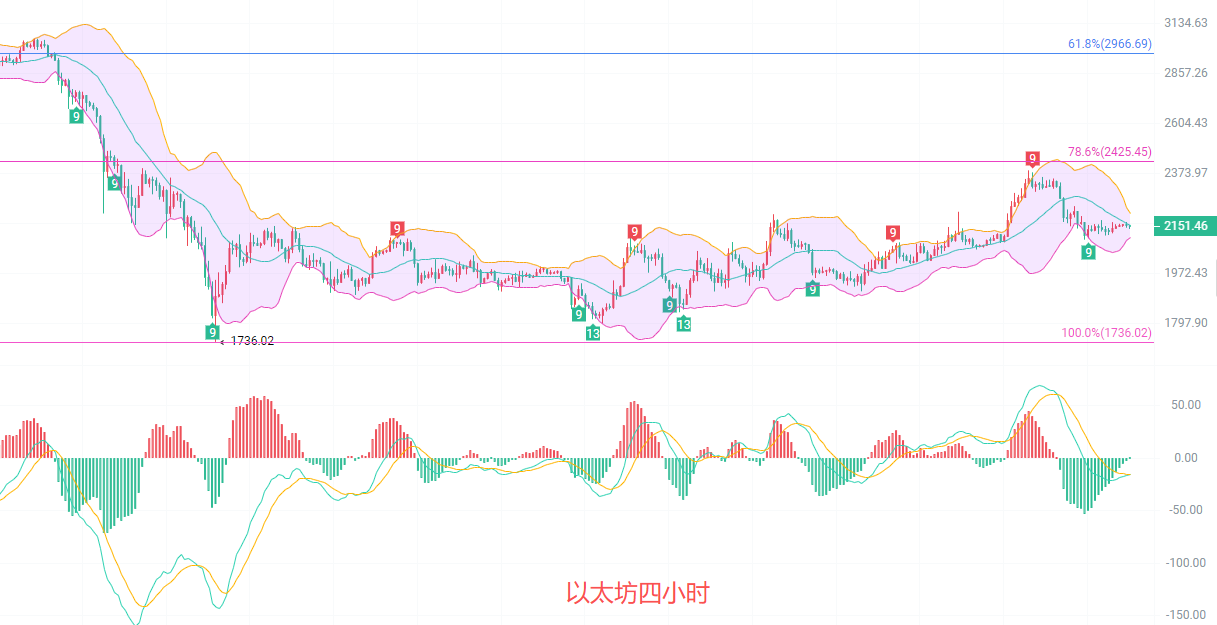
Four-hour weak rebound is inducing longs, with bears not exhausted. After a sharp drop, it bottomed at 2098 and is currently oscillating around 2150; the EMA moving averages form a bearish arrangement, with the price firmly held below the middle track at 2156. Any rebound is a setup to induce longs, the MACD green bars are narrowing approaching the zero axis, and RSI has risen to around 42, indicating short-term bearish momentum is somewhat weakened, but bulls have not yet formed an effective offensive, creating a temporary balance between bulls and bears, likely maintaining a fluctuating market for the day.
Short-term reference: (Practical data has been updated; for details, consult the author)
In the range below 2120 to 2100, go long, stop loss at 2080, target looking at 2160 to 2180 for rebound to resistance before exiting without attachment

In the range above 2180 to 2200, go short, stop loss at 2220, target looking at 2150 to 2120; if it breaks below 2120, continue south to 2100 to 2080
Specific operations should be based on real-time market data. For more information, you may consult the author. The article is published with delay; it is recommended for reference only at your own risk
Warm reminder: The above content is solely created by the author of the public account. The advertisements at the end of the article and in the comment section are unrelated to the author. Please discern cautiously. Thank you for reading
免责声明:本文章仅代表作者个人观点,不代表本平台的立场和观点。本文章仅供信息分享,不构成对任何人的任何投资建议。用户与作者之间的任何争议,与本平台无关。如网页中刊载的文章或图片涉及侵权,请提供相关的权利证明和身份证明发送邮件到support@aicoin.com,本平台相关工作人员将会进行核查。