Written by: Gate Research Institute
Core Summary
- After the joint airstrikes by the US and Israel on Iran, gold and oil opened significantly higher on Monday, global stock markets opened lower, and Bitcoin experienced increased volatility, causing a market value fluctuation of approximately $80 billion within hours.
- Gold is supported by real interest rates and central bank purchases, while oil is influenced by OPEC+ production capacity and geopolitical risks, both exhibiting traditional safe-haven and inflation-hedging characteristics amid turmoil.
- The market predicts a low probability of a full-scale war, but risks associated with the Strait of Hormuz are not low; short-term asset volatility is dominated by risk premiums, while medium to long-term trends depend on the duration of the conflict and monetary policy paths.
- If the situation eventually leads to compromise or a temporary easing, commodity prices may significantly retrace; conversely, there is a risk of further surges in gold and oil prices.
1. Short-term and Long-term Trends of Bitcoin, Oil, and Gold
1.1 Market Opening on March 2, 2026
On Saturday, the US and Israel launched joint airstrikes on Iran, causing Bitcoin prices to plummet to $63,000. Shortly thereafter, Iranian state media confirmed the death of Iran's Supreme Leader Khamenei during the airstrikes, leading Bitcoin prices to rebound strongly from the low of $63,000 to around $68,000. This move caused an $80 billion fluctuation in market value within just a few hours, coinciding with a weekend of very low liquidity, resulting in approximately 157,000 traders being liquidated, collectively losing $657 million.
During the sell-off, traders flocked to decentralized platforms to engage in round-the-clock trading of oil and gold perpetual contracts in search of hedging opportunities while traditional markets were closed. This capital flow weakened the buying depth of cryptocurrency, intensifying the downward pressure on Bitcoin when support was critically needed. The interaction between cryptocurrency spot sell-offs and commodity perpetual contract buying during the weekend geopolitical shocks is a relatively new market dynamic.
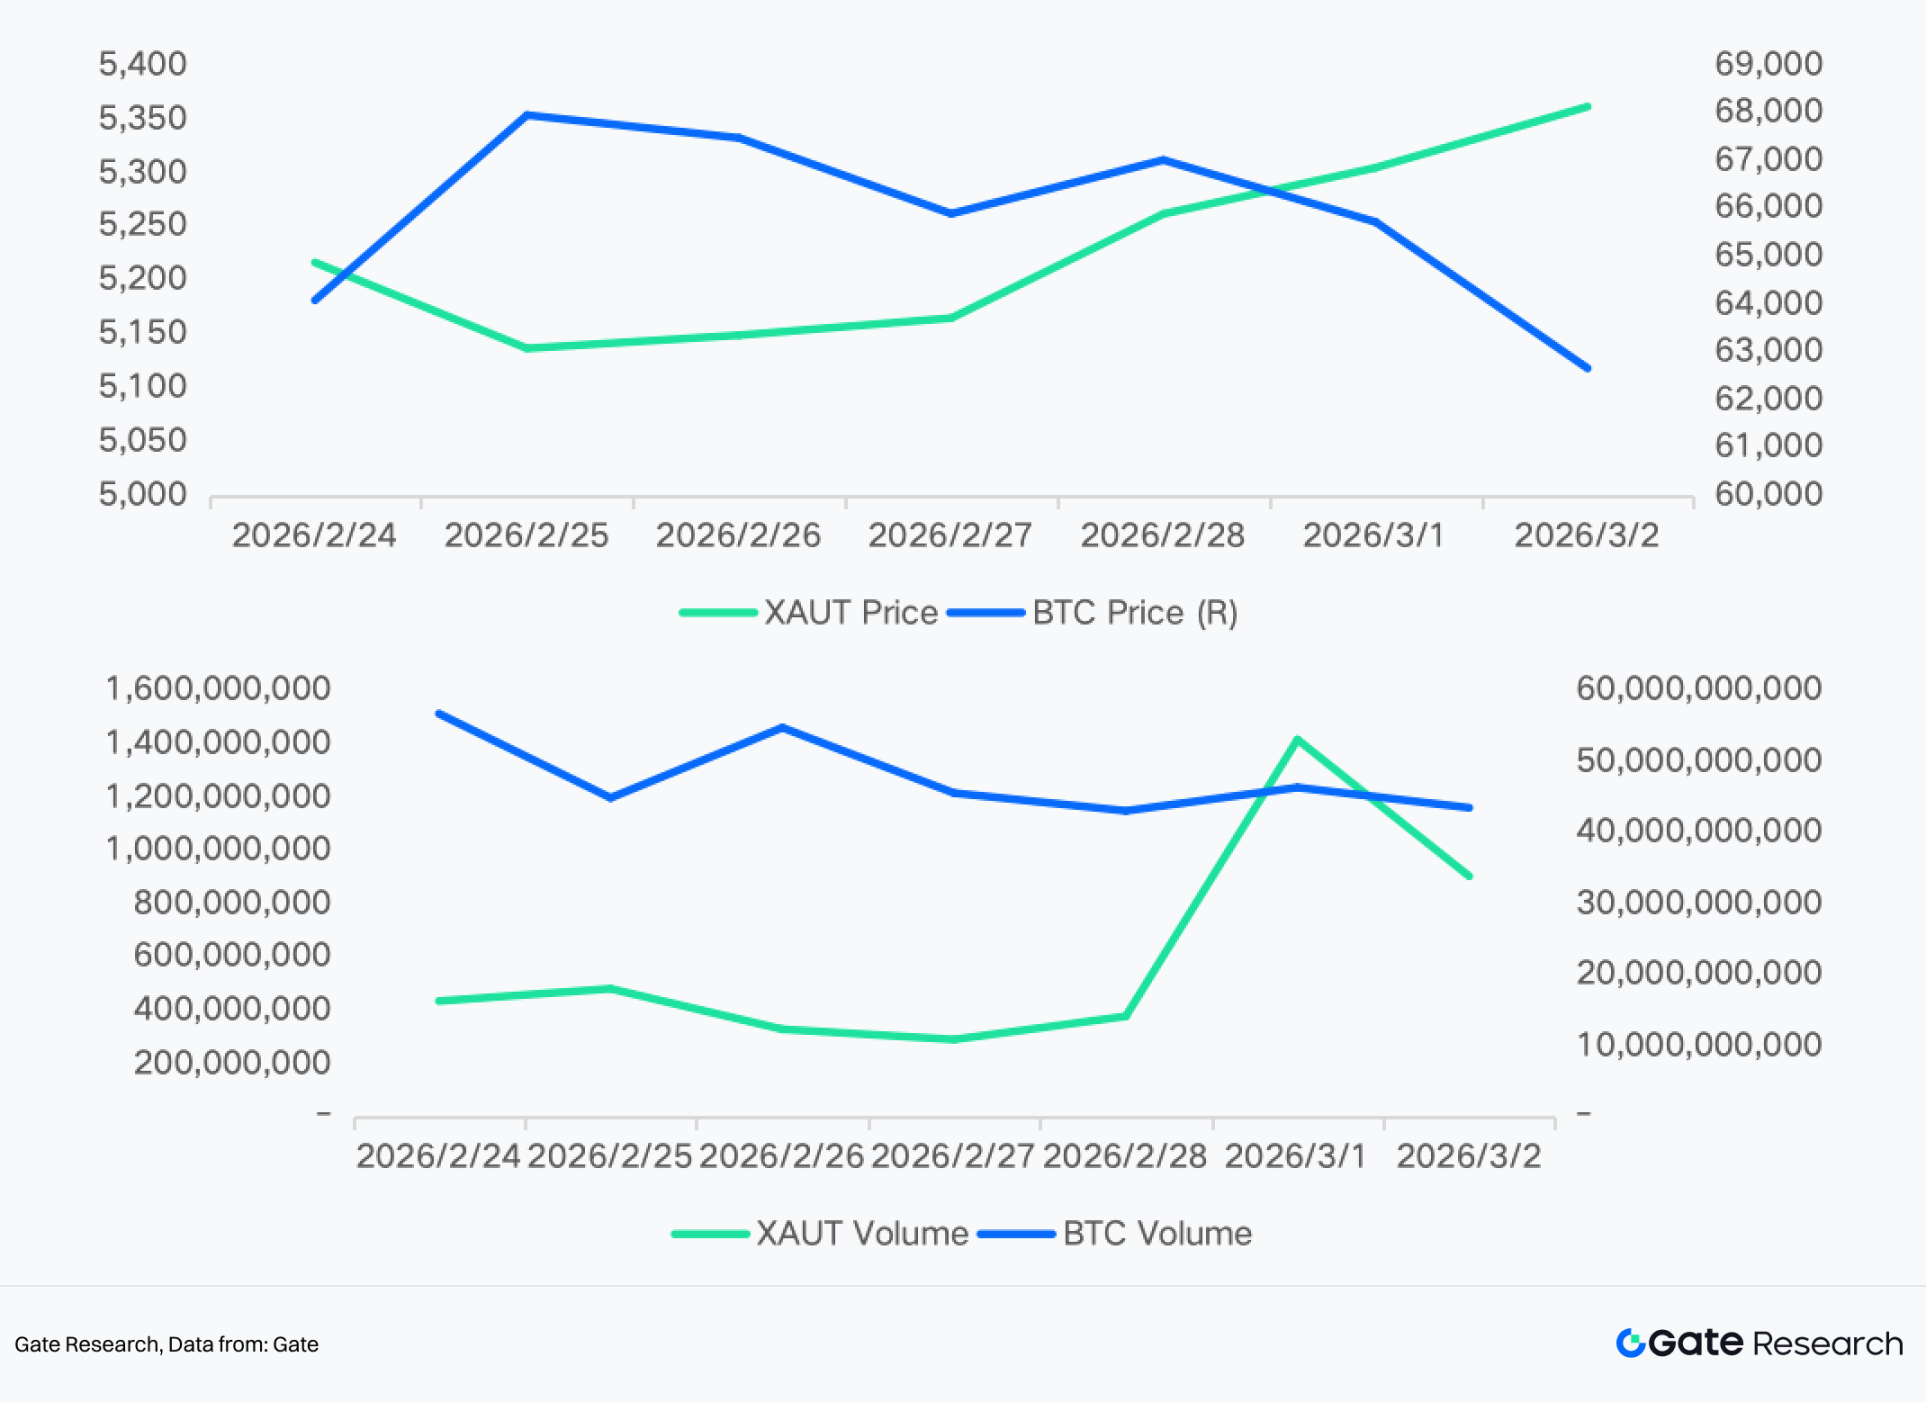
Figure: 7-day trading of tokenized gold and Bitcoin
1.2 Long-term Trends and Correlation Analysis
For a long time, Bitcoin has been regarded as a safe-haven asset, also known as "digital gold." For instance, at the end of February 2022, when the Russia-Ukraine conflict broke out, the market once believed that Russian funds might turn to crypto assets, and Bitcoin surged approximately 20% in a short period, surpassing $45,000. In June 2025, when geopolitical risks between Israel and Iran escalated, Bitcoin also showed a noticeable short-term increase. Subsequently, in October, amid discussions regarding "currency devaluation concerns" and sovereign debt issues (the so-called "debasement trade"), Bitcoin saw synchronized increases with gold prices, reaching new highs driven by macro uncertainty that resonated across assets.
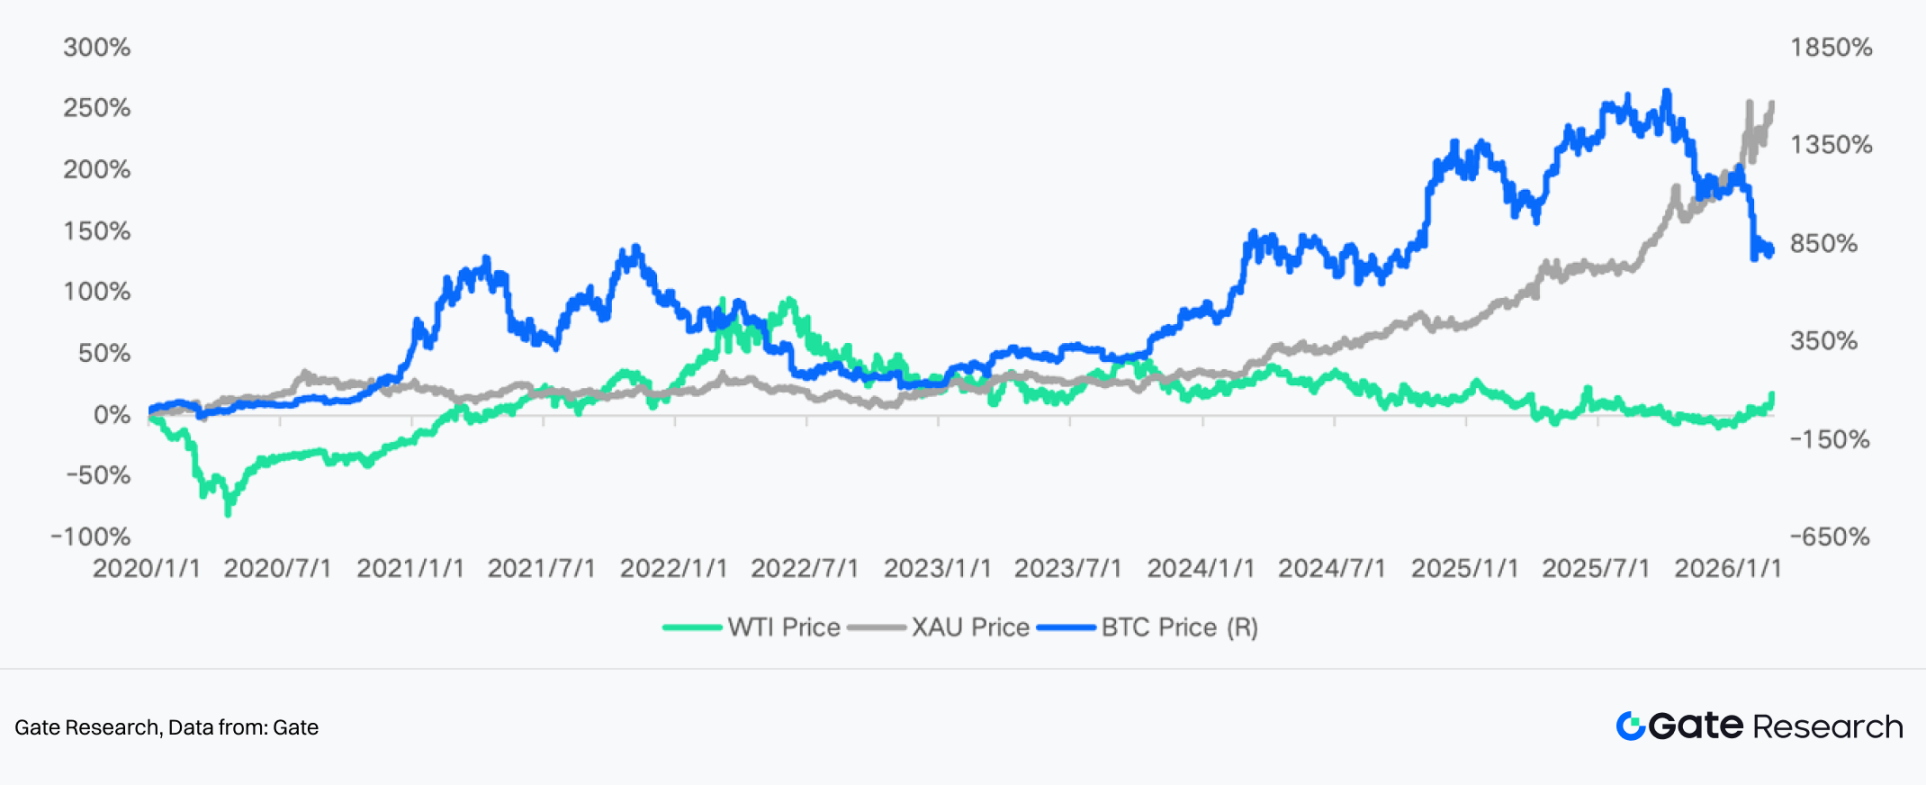
Figure: Price trends of Bitcoin, Gold, and WTI crude oil
However, since late 2025, Bitcoin’s safe-haven property has weakened significantly. Multiple analyses indicate that Bitcoin's performance during risk events has diverged notably from that of gold. The significant decline in October 2025 reflected Bitcoin's characterization as a risk asset rather than a safe haven during major macro shocks, contrasting sharply with the performance of gold and US Treasuries. In scenarios of inflation or macro pressure, gold tends to continue rising, while Bitcoin prices often decline or fall in sync, indicating that the "digital gold" narrative has not fully materialized under real market conditions. Latest macro shock cases illustrate that trade policy risks and global uncertainties lead to declines in Bitcoin and increases in gold, further undermining Bitcoin's reputation as a safe haven.
From the perspective of weekly fluctuations since 2020, Bitcoin has exhibited a clear "risk asset" characteristic. Its correlation with NASDAQ stands at 0.43, the highest in the matrix, showing a high degree of interlinkage with tech stocks, particularly during the period of global easing post-2020 pandemic, the liquidity bull market in 2021, and the AI and tech-stock-led market phase from 2023 to 2025 when risk appetite increased. In contrast, Bitcoin presents a negative correlation of -0.24 with the US dollar index, facing significant pressure during the aggressive Fed rate hikes and strengthening dollar phase in 2022, validating its high sensitivity to global liquidity. Gold (XAU) shows the strongest negative correlation with the dollar (-0.53), reflecting traditional safe-haven logic, while Bitcoin's correlation with gold is only 0.15, indicating that its "digital gold" attribute is unstable. Overall, since 2020, Bitcoin has become closer to a high-beta macro risk asset, with its core price drivers remaining liquidity cycles and risk preferences rather than purely geopolitical safe-haven demand.
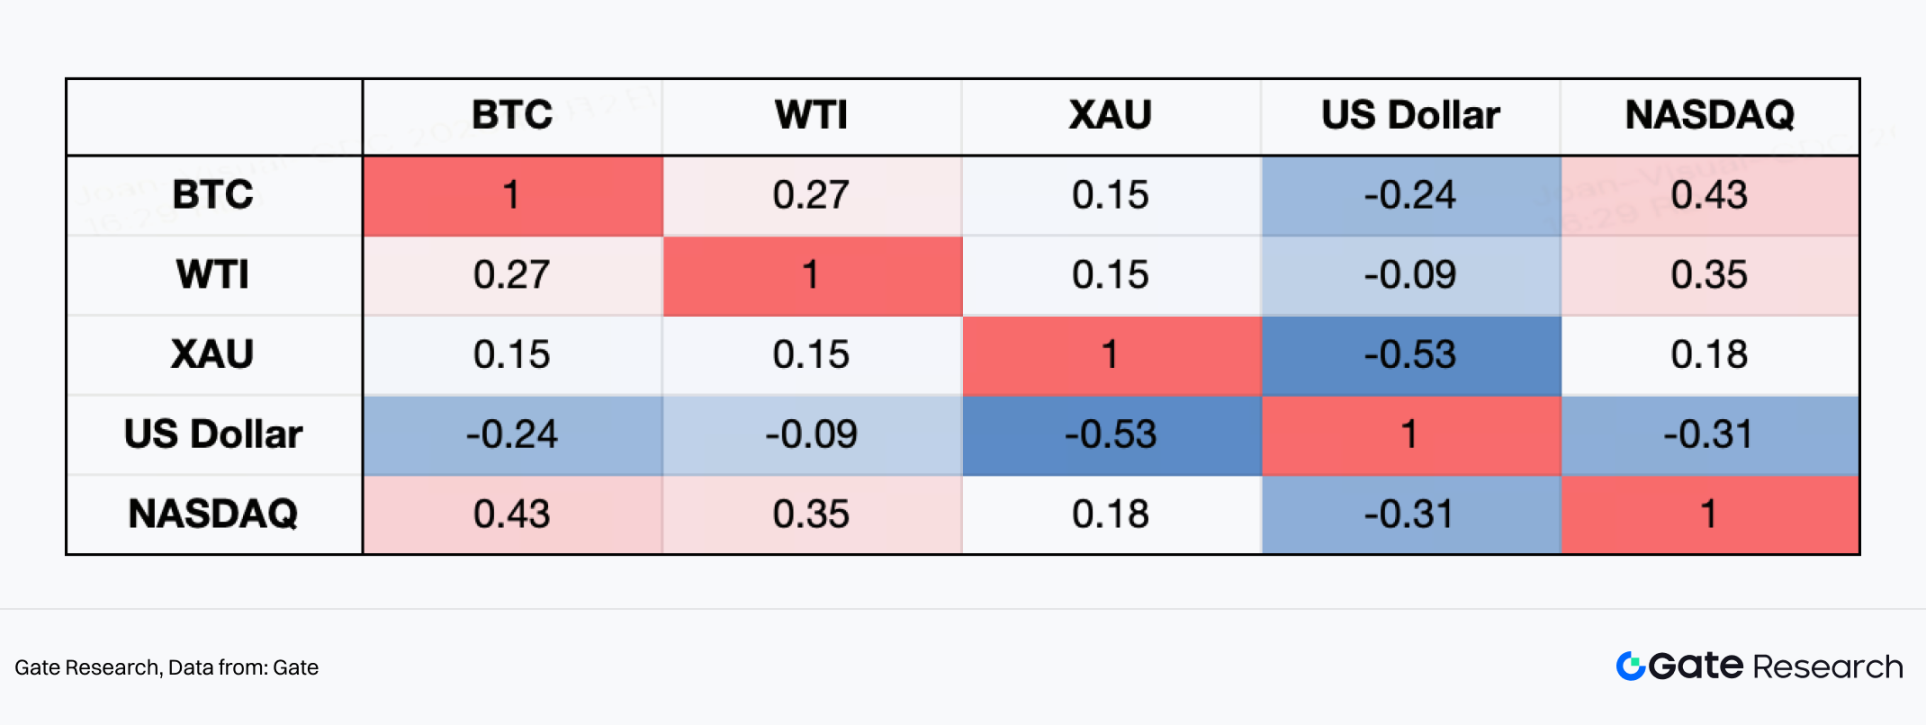
Table: Correlation analysis of BTC, WTI, and Gold
In contrast, gold and oil price trends are more dominated by real interest rates, dollar strength, and geopolitical risk premiums. Under the pandemic shock in 2020, global central banks' massive easing and rapid declines in real interest rates propelled gold to reach historical highs that year; subsequently, between 2021 and 2022, gold prices were suppressed by aggressive Fed interest rate hikes and a strengthening dollar, leading to high-level fluctuations. Later, as global geopolitical tensions escalated, coupled with continued increases in central banks' gold reserves, the safe-haven and reserve properties of gold were reinforced, enabling gold prices to operate within high ranges and repeatedly refresh phase highs. From the supply side, global gold production has maintained moderate growth overall, with limited new large mines, while extraction costs have risen amidst increasing energy and labor prices; simultaneously, stricter environmental regulations have also restricted the pace of capacity expansion. Overall, since 2020, the gold market has exhibited characteristics of "rigid supply, financialized demand."
The oil market experienced a historic shock in 2020, where WTI briefly showed negative prices during the pandemic, subsequently quickly recovering under global economic recovery and OPEC+ large-scale production cuts. In 2022, concerns about energy supply led oil prices to briefly exceed $100 per barrel; afterward, they fell back under the influence of global growth slowdown and weakened demand expectations. From the supply side, OPEC+ has long managed prices through proactive production cuts, with idle capacity in the Middle East becoming a key buffer; while US shale oil production gradually recovered from 2021 to 2023, capital discipline has significantly slowed the pace of expansion compared to the 2010s. From 2024 to 2025, oil prices are expected to fluctuate between geopolitical conflicts, shipping risks, and global demand slowdown, presenting a high-volatility pattern. Overall, since 2020, the core feature of the oil market has been the cyclical switching of "demand shocks - supply games - geopolitical premiums," with price centers significantly raised from pandemic lows, yet highly sensitive to macro cycles and policy changes.
2. Future Outlook
2.1 Impact Analysis of Various Assets
In the initial phase of the global financial market opening on Monday, the Iranian issue concentrated panic sentiment through the high opening of gold and oil and the low opening of global stock markets. From the main transmission paths, the impact of the Iranian crisis on the global economy and macro markets primarily concerns energy disruptions, where the severity of the crisis and its expected duration are key determinants of the depth of the impact.
Typically, during rising uncertainty and expanding tail risks, the market's first response is to raise risk premiums. For instance, during the weekend, short-term inflation expectations increased, reflecting concerns over rising energy prices, though the market has partly digested the risks of economic slowdown and rising inflation to some extent.
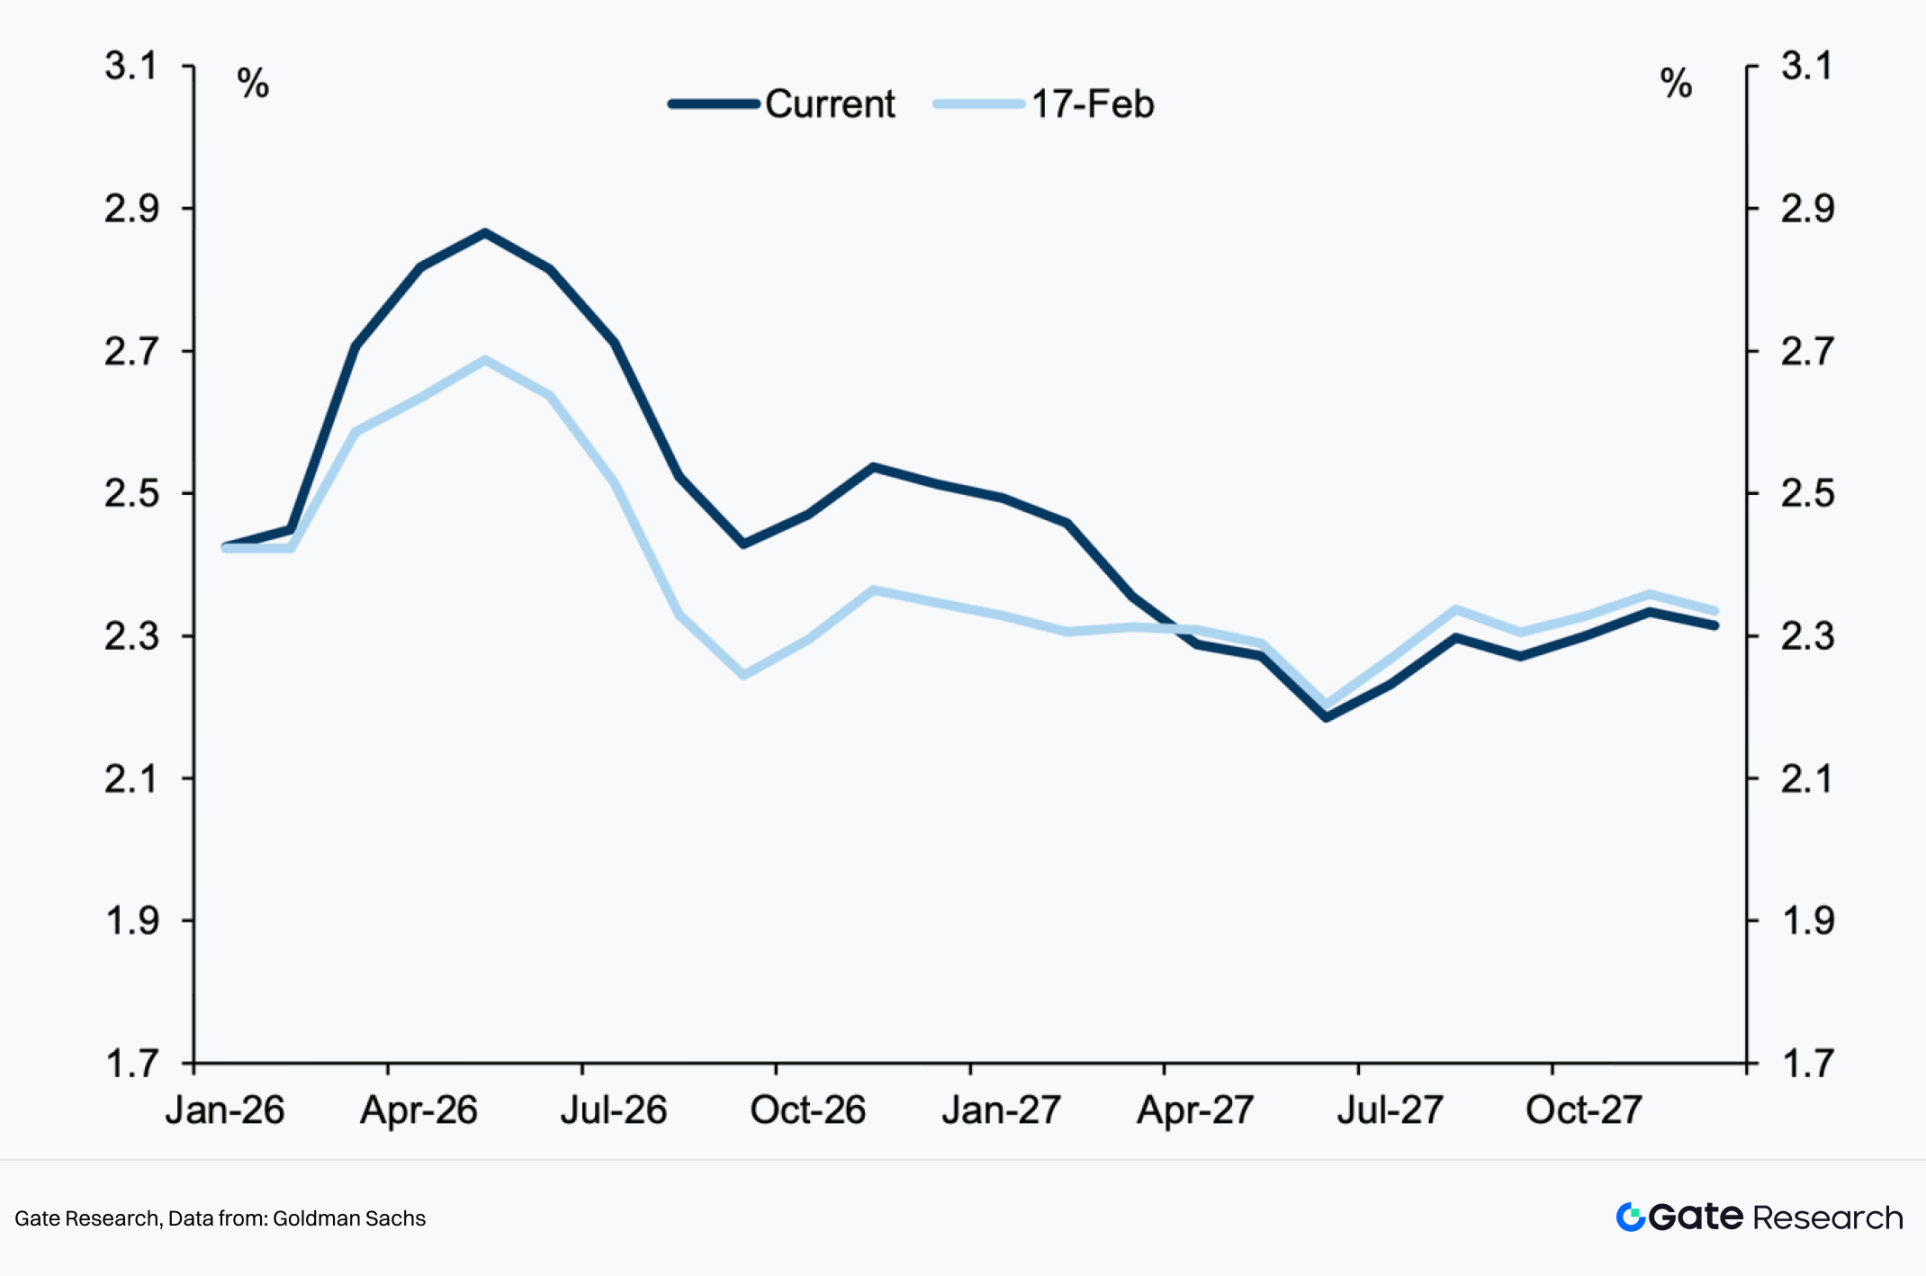
Figure: Comparison of US implied CPI year-on-year growth expectations
The current market pricing logic is in a highly sensitive swinging phase: if the situation ultimately leads to compromise or a phase of temporary easing, akin to the early-year "Venezuela incident" script, the previously accumulated geopolitical premium may quickly reverse, triggering significant corrections in commodity prices; conversely, if the conflict escalates in a spiraling manner and spreads to deeper issues, there is a risk of further surges in gold and oil prices.
2.1.1 BTC and Other Crypto Assets
Impact Already Seen:
During the intensification of the US-Iran conflict news, Bitcoin prices exhibited significant volatility. From a market structure perspective (15-minute level), BTC quickly dipped to around $63,000 before rebounding above $68,000, subsequently entering high-level oscillation. The short-cycle moving averages (MA5/MA10) repeatedly crossed with medium-term moving averages (MA30), indicating a rapid shift in market sentiment. The overall behavior is more aligned with "high-volatility risk assets" rather than stable safe-haven assets—dipping sharply during the onset of conflict due to liquidity crunch, followed by a rebound alongside risk asset recovery. This suggests that short-term capital prioritizes reducing leverage and risk exposure amidst geopolitical shocks.
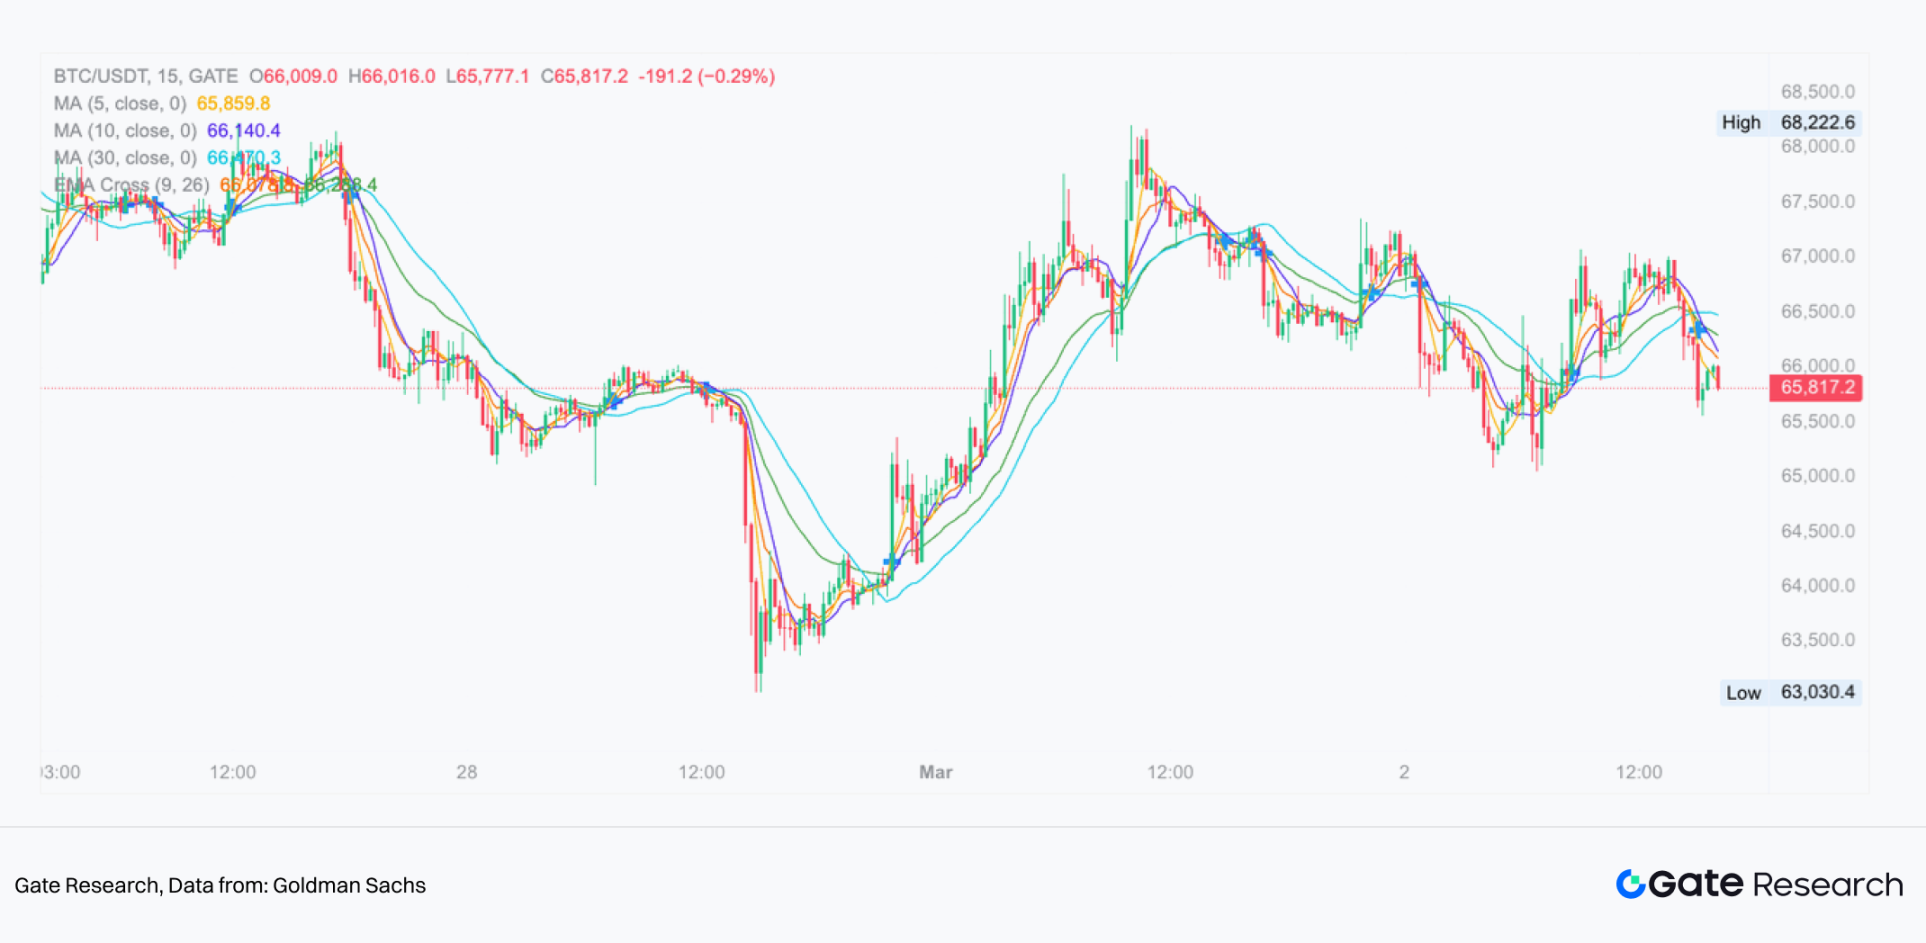
Figure: BTC/USDT 15min K-line
Institutional Predictions:
Mainstream institutions have differing views on BTC, but overall lean towards a "short-term pressure, mid-term depending on liquidity" logic:
•Bloomberg Intelligence points out that in the early stages of geopolitical conflict, the market typically adopts a "haven-first strategy," prioritizing the purchase of traditional safe-haven assets, with crypto assets often fluctuating in line with risky assets like stocks and possibly facing short-term pressure.
•JPMorgan's digital asset team mentioned in earlier geopolitical conflict studies that Bitcoin behaves more as a "risk-on asset," with its price correlating more closely with liquidity conditions, the dollar index, and real interest rates rather than purely as a safe-haven asset.
•CoinShares Research indicated in their weekly fund flow report that if the conflict drives up oil prices and leads to a resurgence in inflation expectations, delaying the Fed's easing cycle, the crypto market could face phase-out pressure.
•Standard Chartered's digital asset research department previously argued that in extreme financial instability or rising sovereign risk scenarios, BTC may regain appeal as an "alternative asset," though this logic typically lags behind initial risk sell-offs.
Comprehensive Judgement:
•If the conflict remains regional with limited oil price rise → BTC may oscillate within a high-volatility range.
•If oil prices rise sharply, delaying rate cut expectations → BTC might face liquidity constraints.
•If the conflict raises fears of systemic global financial issues → BTC could gain "hedging credit risk" buying in the second phase.
2.1.2 US Stocks
Impact Already Seen:
In the context of the escalating US-Iran conflict, the Nasdaq clearly shows characteristics of risk assets coming under pressure. From a market structure perspective, the index experienced a rapid drop after previously climbing above 25,400 points, followed by a single-sided large bearish candle during the news fermentation phase, breaking through earlier oscillation platforms and dipping to around 24,500 points.
The 15-minute level demonstrated a typical "high position weakens → structural support breaks → weak rebound → new lows" trend, with diminishing rebound heights and a clear bearish rhythm. Tech stocks are sensitive to liquidity and interest rate expectations; amidst rising oil prices and inflation worries triggered by geopolitical conflicts, funds have clearly reduced risk exposure, heavily pressuring growth sectors.
Overall, this round of conflict has formed phase risk premium compression for the Nasdaq, with the market switching from "risk preference driven" to "defense priority."
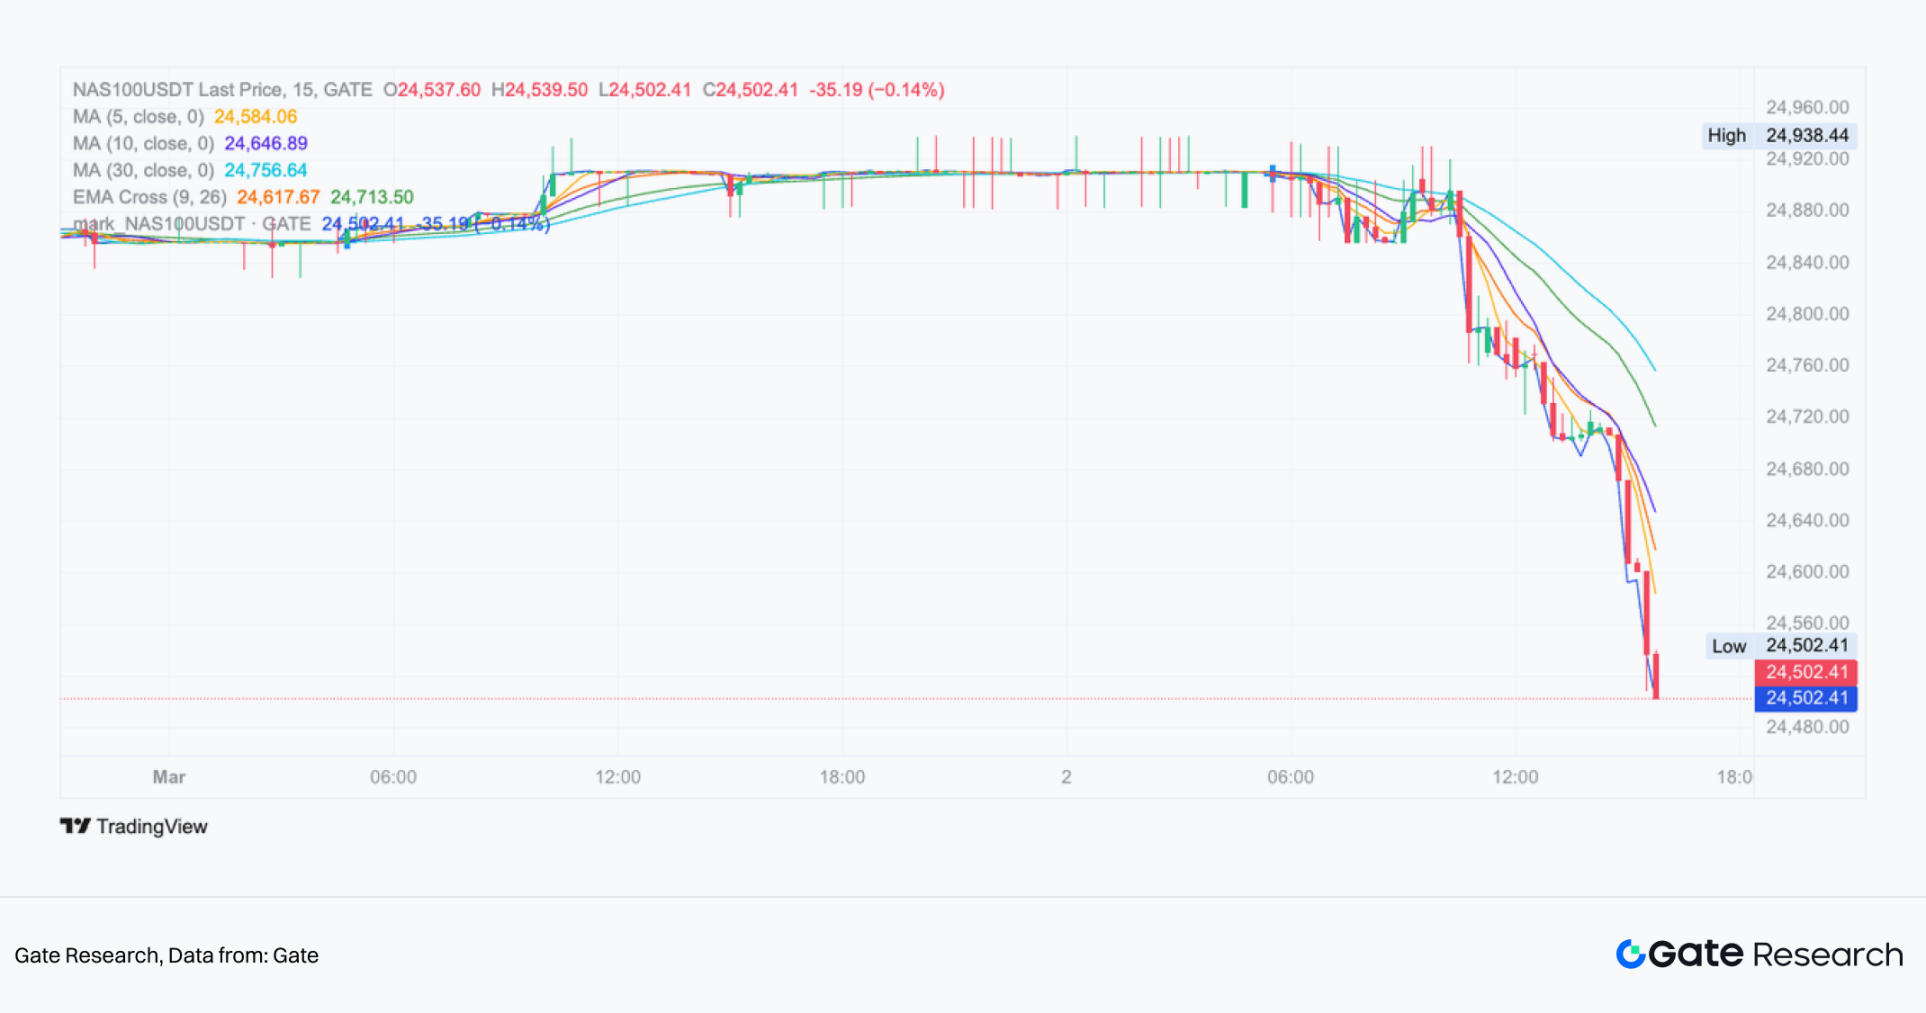
Figure: NAS100/USDT 15min K-line
Institutional Predictions:
•Bloomberg Intelligence notes that during the escalation phase of the Middle Eastern conflict, the market typically adopts a "risk-off + haven-first" strategy, leading tech growth sectors to prompt the first decline.
•JPMorgan’s global strategy team believes that if oil prices continue to rise and inflate inflation expectations, it could limit the Fed's space for rate cuts, thus applying valuation pressure on highly valued tech stocks.
•Goldman Sachs’s strategy report states that volatility usually increases in the early stages of geopolitical shocks, with growth index pullbacks often exceeding those of the S&P 500.
•Morgan Stanley’s prior risk scenario models indicated that if energy prices continue to exceed a certain threshold, the risk of valuation compression for growth stocks increases.
Comprehensive Judgement:
•If the conflict remains regional and oil prices stabilize → Nasdaq may enter high-volatility oscillations.
•If oil prices breach key ranges and inflate inflation expectations → tech stocks may continue to face pressure.
•If the conflict quickly eases → risk preference may recover, and Nasdaq could experience a technical rebound.
From the current structure, the Nasdaq has entered a short-term bearish trend channel, and the subsequent direction will depend on oil price trends, the dollar and US bond yield variations, as well as whether the conflict escalates further. US stocks are slightly disturbed by geopolitical sentiment in the short term; in the long run, they will return to fundamentals and valuations, with low risks of an AI bubble burst. In contrast, due to the application of AI technology in warfare, this has positively benefitted the US stock AI sector.
2.1.3 Gold (Gold / XAUT)
Impact Already Seen:
In the context of the escalating US-Iran conflict, gold has quickly displayed typical characteristics of a safe-haven asset. From a market structure perspective, gold prices experienced vertical surges during the news fermentation phase, breaking above previous highs within a short time and reaching new phase highs, subsequently entering high-level oscillation consolidation.
On the 5-minute and 15-minute levels, moving averages exhibit a bullish diverging structure, with prices repeatedly retesting short-term averages before continuing to surge, indicating determined fund inflows. Especially during periods of sharp volatility in risk assets (like BTC), gold has maintained relative strength, illustrating the migration path of capital seeking safety amidst rising geopolitical uncertainties. Overall, the current conflict has significantly elevated the "risk premium" of gold.
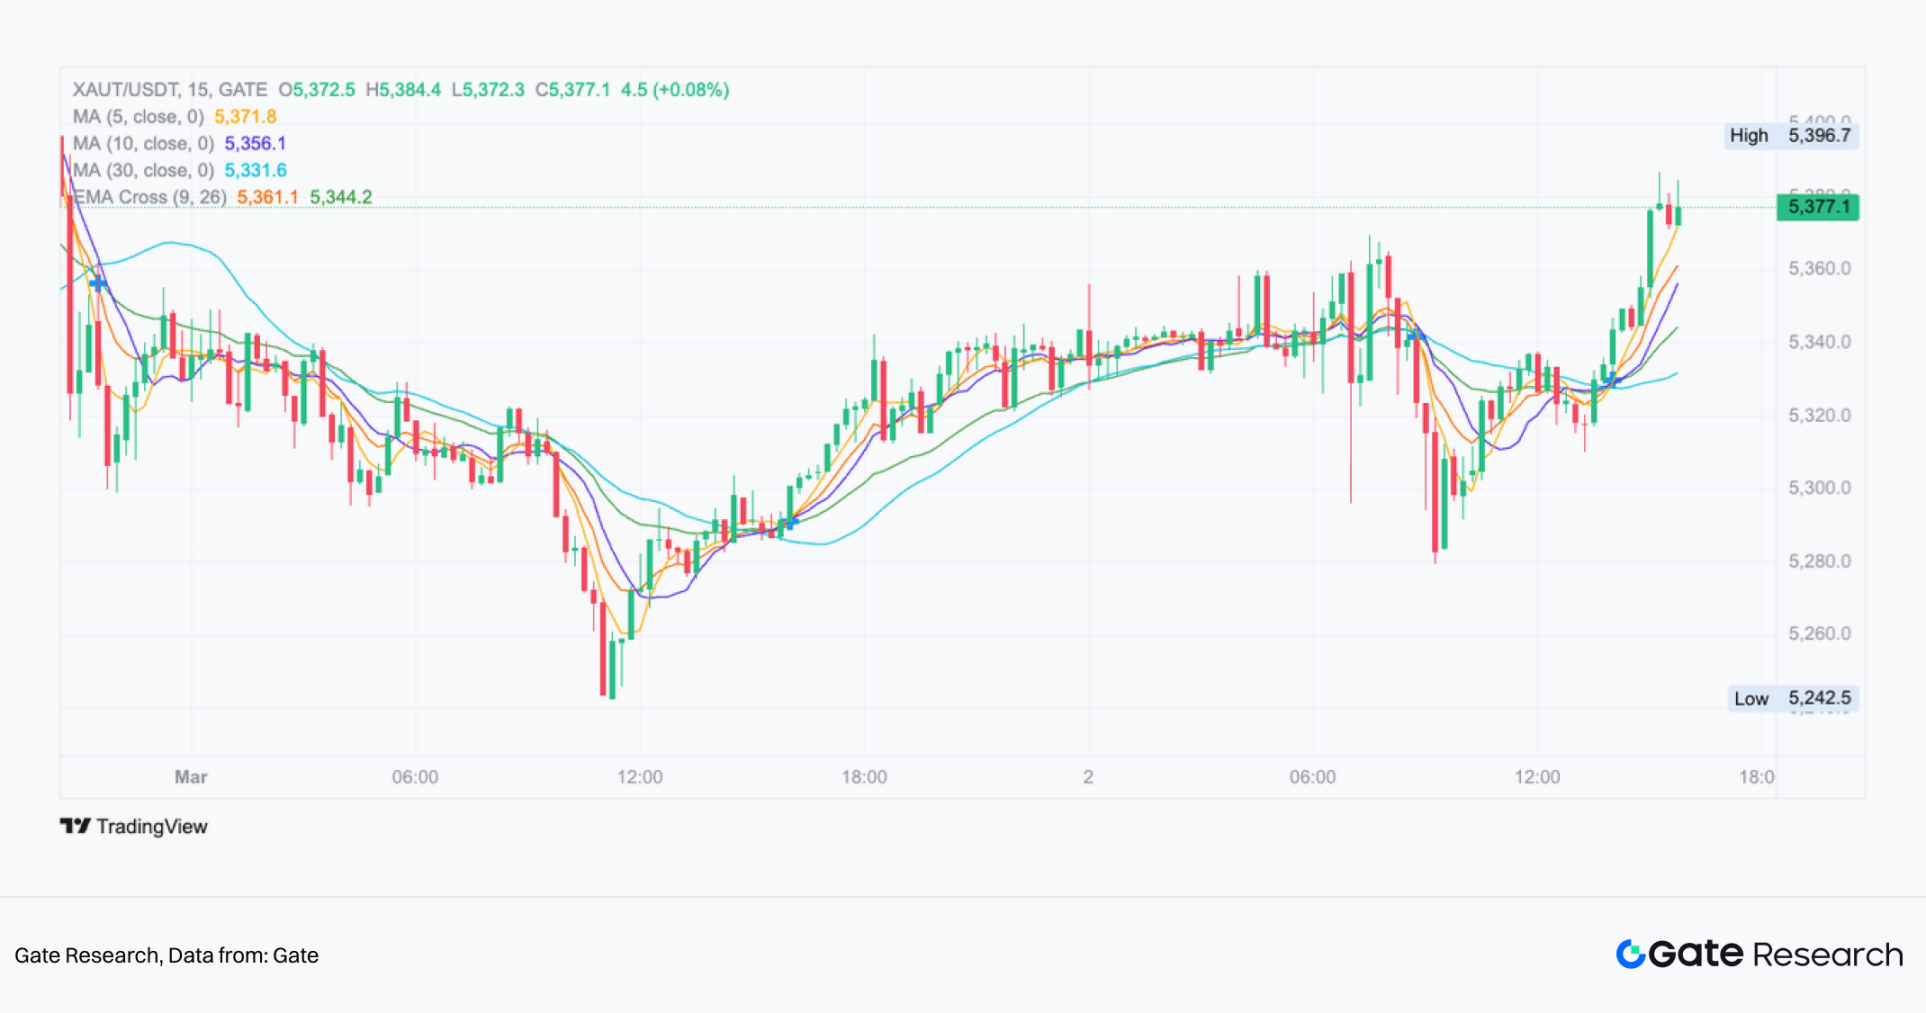
Figure: XAUT/USDT 15min K-line
Institutional Predictions:
•Bloomberg Intelligence indicates that in scenarios of escalating Middle Eastern conflict, gold is typically the preferred safe-haven asset, with capital flowing primarily into gold and US Treasuries rather than crypto assets.
•Goldman Sachs's commodity team previously noted in their geopolitical conflict models that if energy supply risks persist, gold will benefit from the dual driving forces of "safe-haven demand + rising inflation expectations."
•JPMorgan's global macro strategy report suggests that if oil prices rise and push real interest rate expectations downward or lead to a weaker dollar, gold may further explore historical high ranges.
•The World Gold Council has indicated in past geopolitical research that significant military conflicts typically sharply boost ETF inflows and net long positions in gold futures.
Comprehensive Judgement:
•If the conflict remains regional → gold may maintain a strong high-level oscillation structure.
•If the conflict continues to escalate and raise inflation expectations → gold could enter a trend of upward movement, being likely to surpass $6,000 per ounce.
•If the conflict rapidly eases → risk premiums may retrace, leading prices to retest critical moving average supports.
2.1.4 Oil
Impact Already Seen:
In the context of the escalating US-Iran conflict, WTI crude oil has exhibited a typical "risk premium spike" pattern. From a market structure perspective, oil prices surged quickly following the triggering of news, momentarily spiking above $75 before experiencing sharp pullbacks, dropping to around $69 before entering a technical rebound phase, currently recovering to the $72–73 range.
The 15-minute level's movement exhibits a structure of "emotional spikes → quick profit-taking → second repair," with volatility significantly amplified. At the onset of the conflict, the market rapidly incorporated risks associated with Middle Eastern supply (especially regarding the safety of transport through the Strait of Hormuz), raising risk premiums; afterward, prices retreated, reflecting a perception that supply has not been substantively interrupted. Overall, this round of conflict has clearly heightened the volatility range of oil prices.
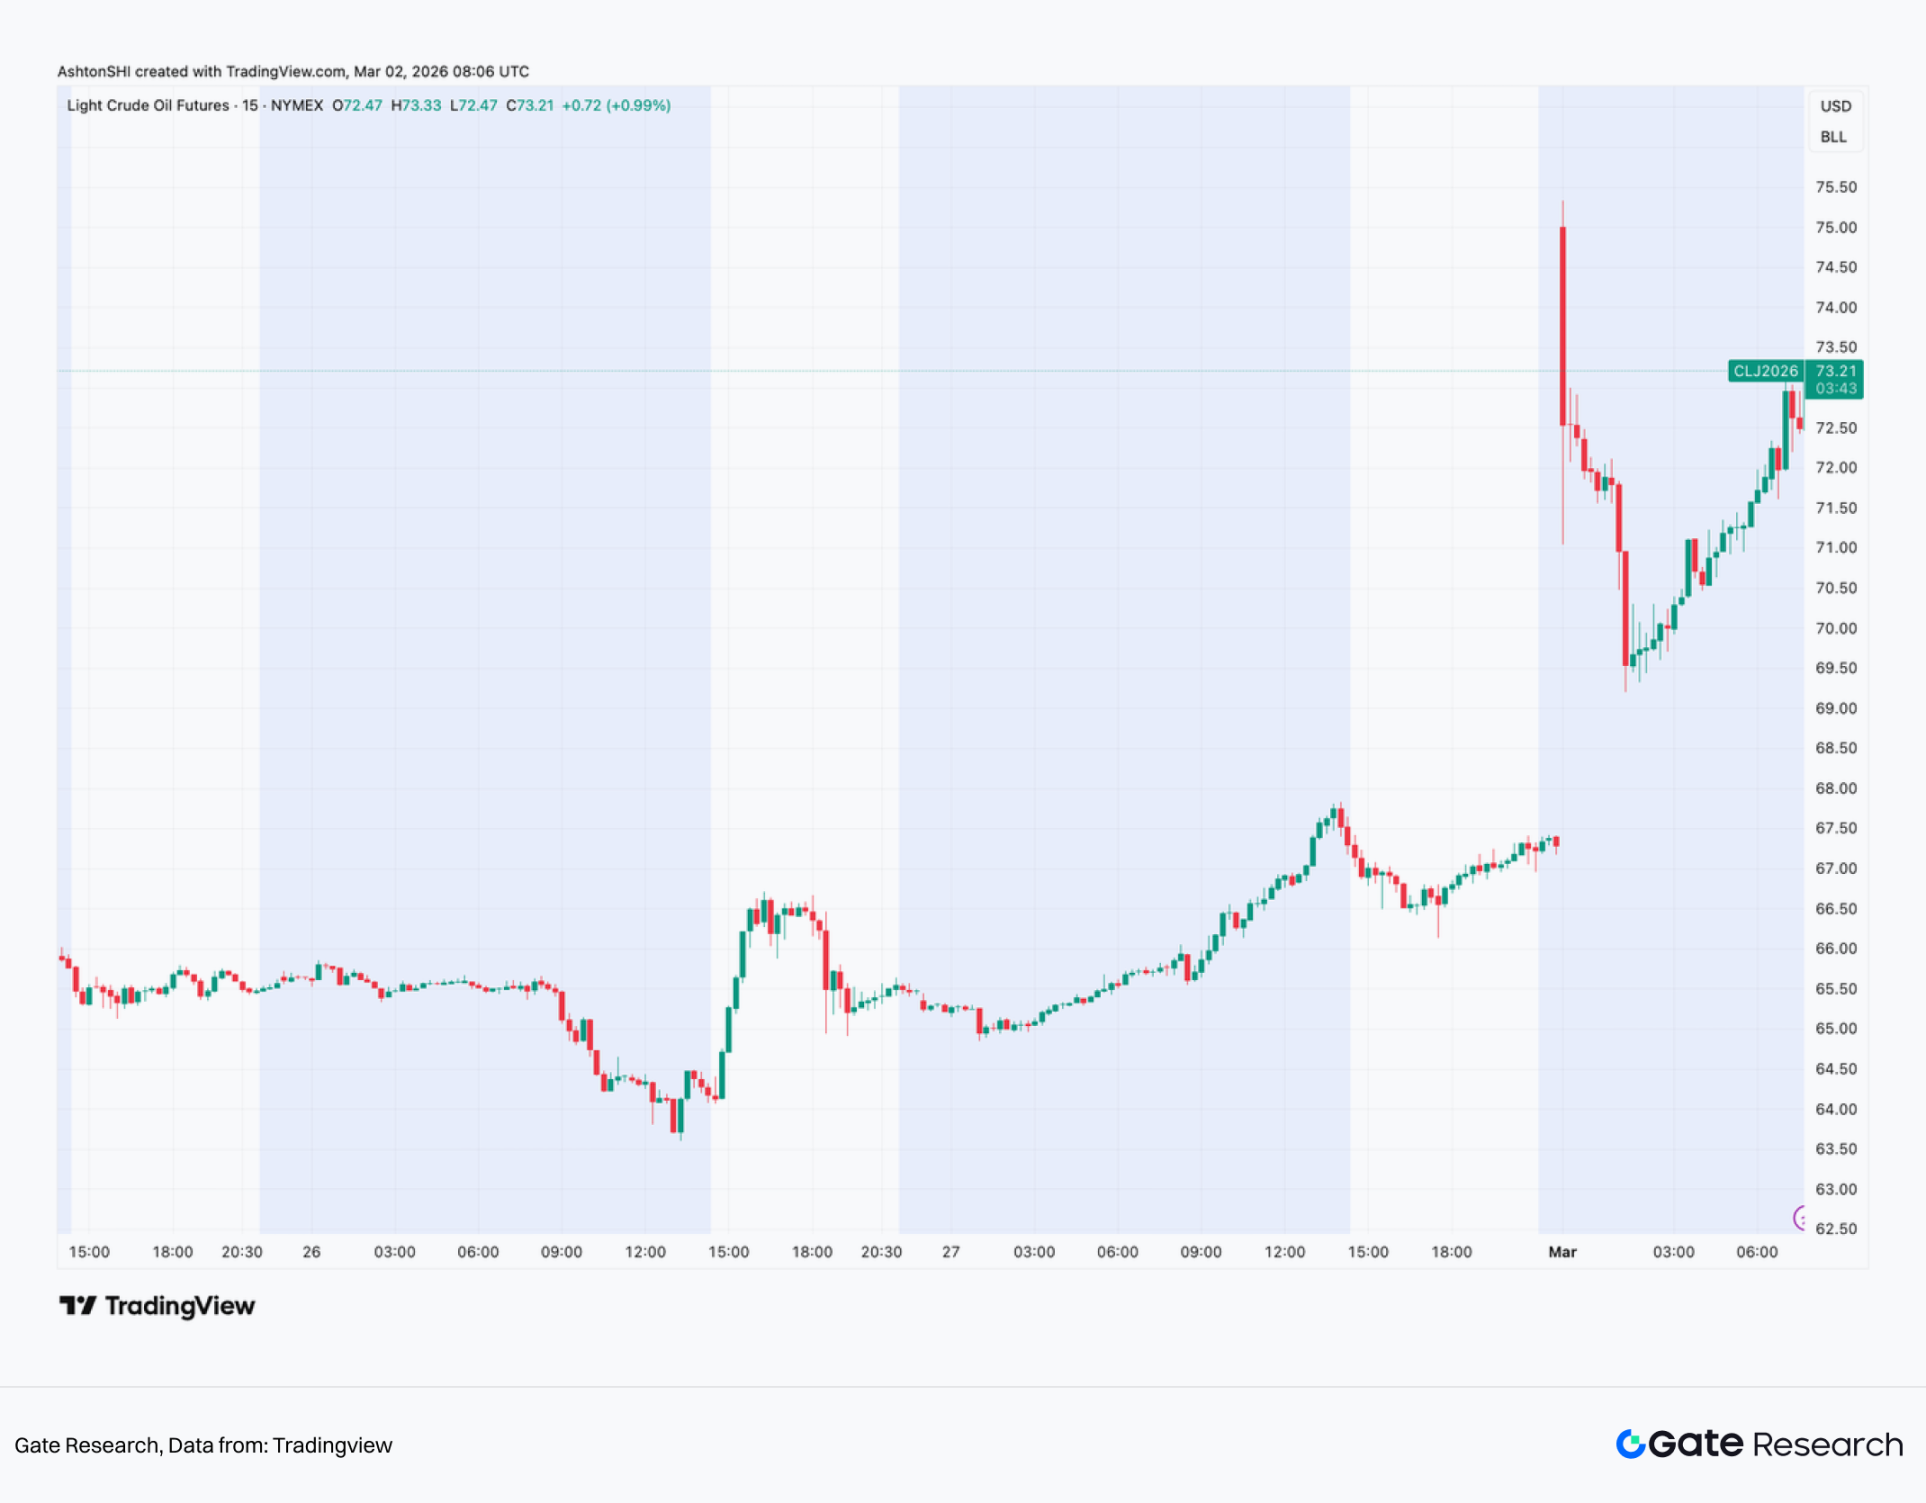
Figure: Light Crude Oil Futures 15min K-line
Institutional Predictions:
•Goldman Sachs's commodity team states that if the conflict continues but does not impact physical supply, oil prices may maintain oscillations within the risk premium range; if supply chains are disturbed, prices may rise further.
•JPMorgan Energy Research believes that during the geopolitical conflict phase, the key variable for oil prices is whether the Strait of Hormuz is substantively threatened; if transportation is constrained, prices may have significant upward potential.
•Rystad Energy analysis indicates that if Middle Eastern supplies experience intermittent disruptions, oil prices may enter a high-volatility state, potentially pushing into higher ranges.
•Bloomberg Intelligence notes that the current rise in oil prices primarily results from risk premiums rather than inventory changes, with future trends dependent on whether the conflict adversely impacts exports.
Comprehensive Judgement:
•If the conflict maintains localized military strikes without impacting oil exports → WTI may oscillate within the $70–75 range.
•If transportation or production capacity faces substantive impacts → oil prices may break through phase highs and enter a rapid rising trend.
•If the conflict rapidly eases → risk premiums may retreat, and oil prices may pull back to historical operating centers.
From the current structure, oil prices have completed the first round of emotional shock and are now in a "high-volatility correction phase," where future directions will depend heavily on news flow and the actual degree of supply damage. If the conflict escalates and shipping through the Strait of Hormuz is hindered, international oil prices may reach new highs.
2.2 Predictions from Market Perspective
Based on the latest odds from Polymarket's relevant markets as event trees, the US-Israel invasion or escalation of strikes on Iran can be broken down into several key branches.
2.2.1 Event Tree
(1) Market predicts a very low probability of a "full-scale invasion."
Polymarket gives a Yes probability of about 7% for "the US invading Iran before March 31." This market defines "invasion" as the US launching a military offensive and establishing control over parts of Iran. This definition distinguishes between brief airstrikes, targeted strikes, proxy conflicts, and "ground invasion-style occupations," implying that the latter is seen as a low-probability tail risk by the market.
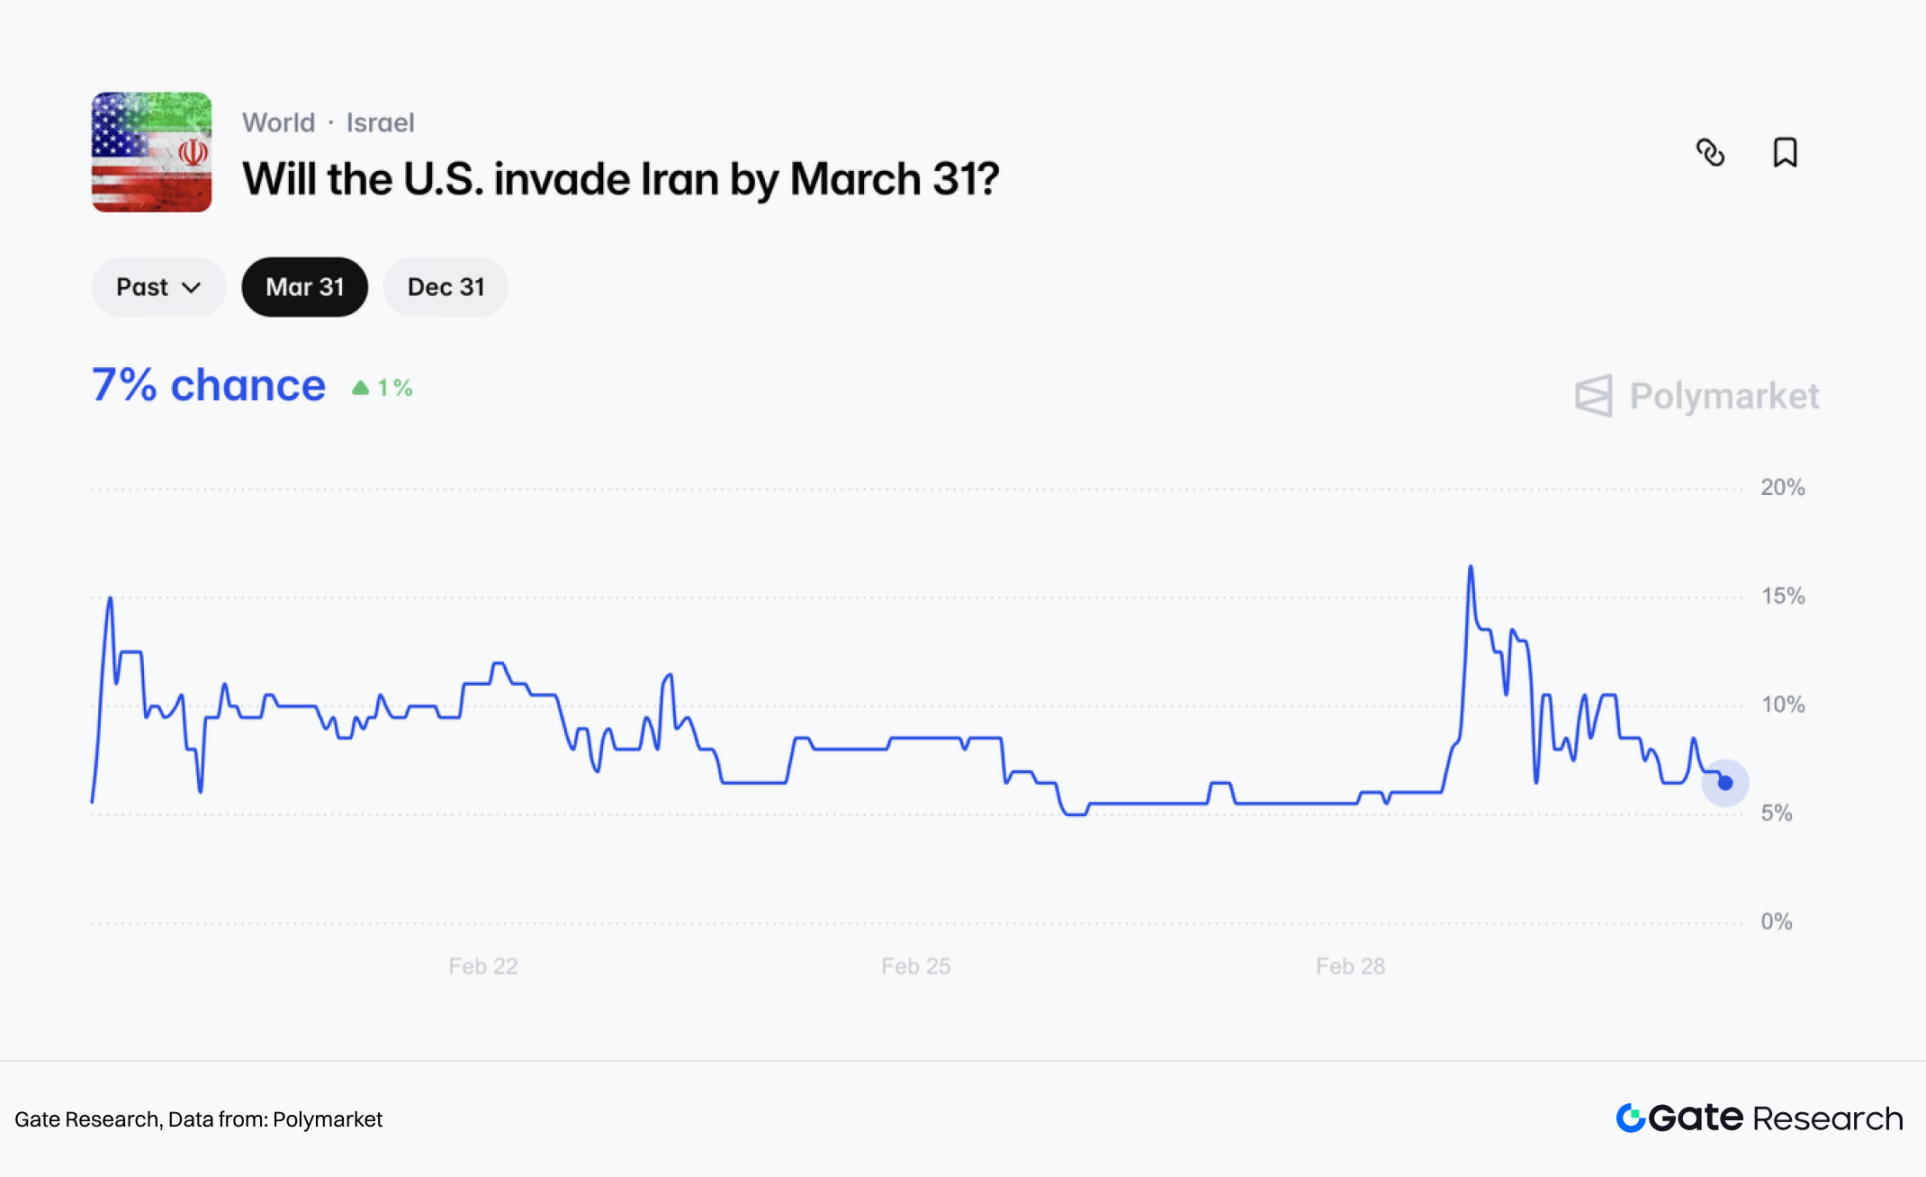
Figure: Prediction of whether the US will invade Iran before March 31
(2) Macroeconomic core: the tail risk of the Strait of Hormuz being cut off is not low.
Compared to a full invasion, Polymarket prices a much higher probability for "Iran closing or severely restricting the passage of the Strait of Hormuz before March 31": approximately 42% by March 31, about 44% by June 30, and around 49% by December 31.
This is the core reason why the commodity market is highly sensitive to geopolitical news. The Strait of Hormuz is a crucial energy chokepoint, with over 20% of global oil passing through, and if there are sustained interruptions,油价可能被推向接近甚至超过 $100/ 桶的量级。
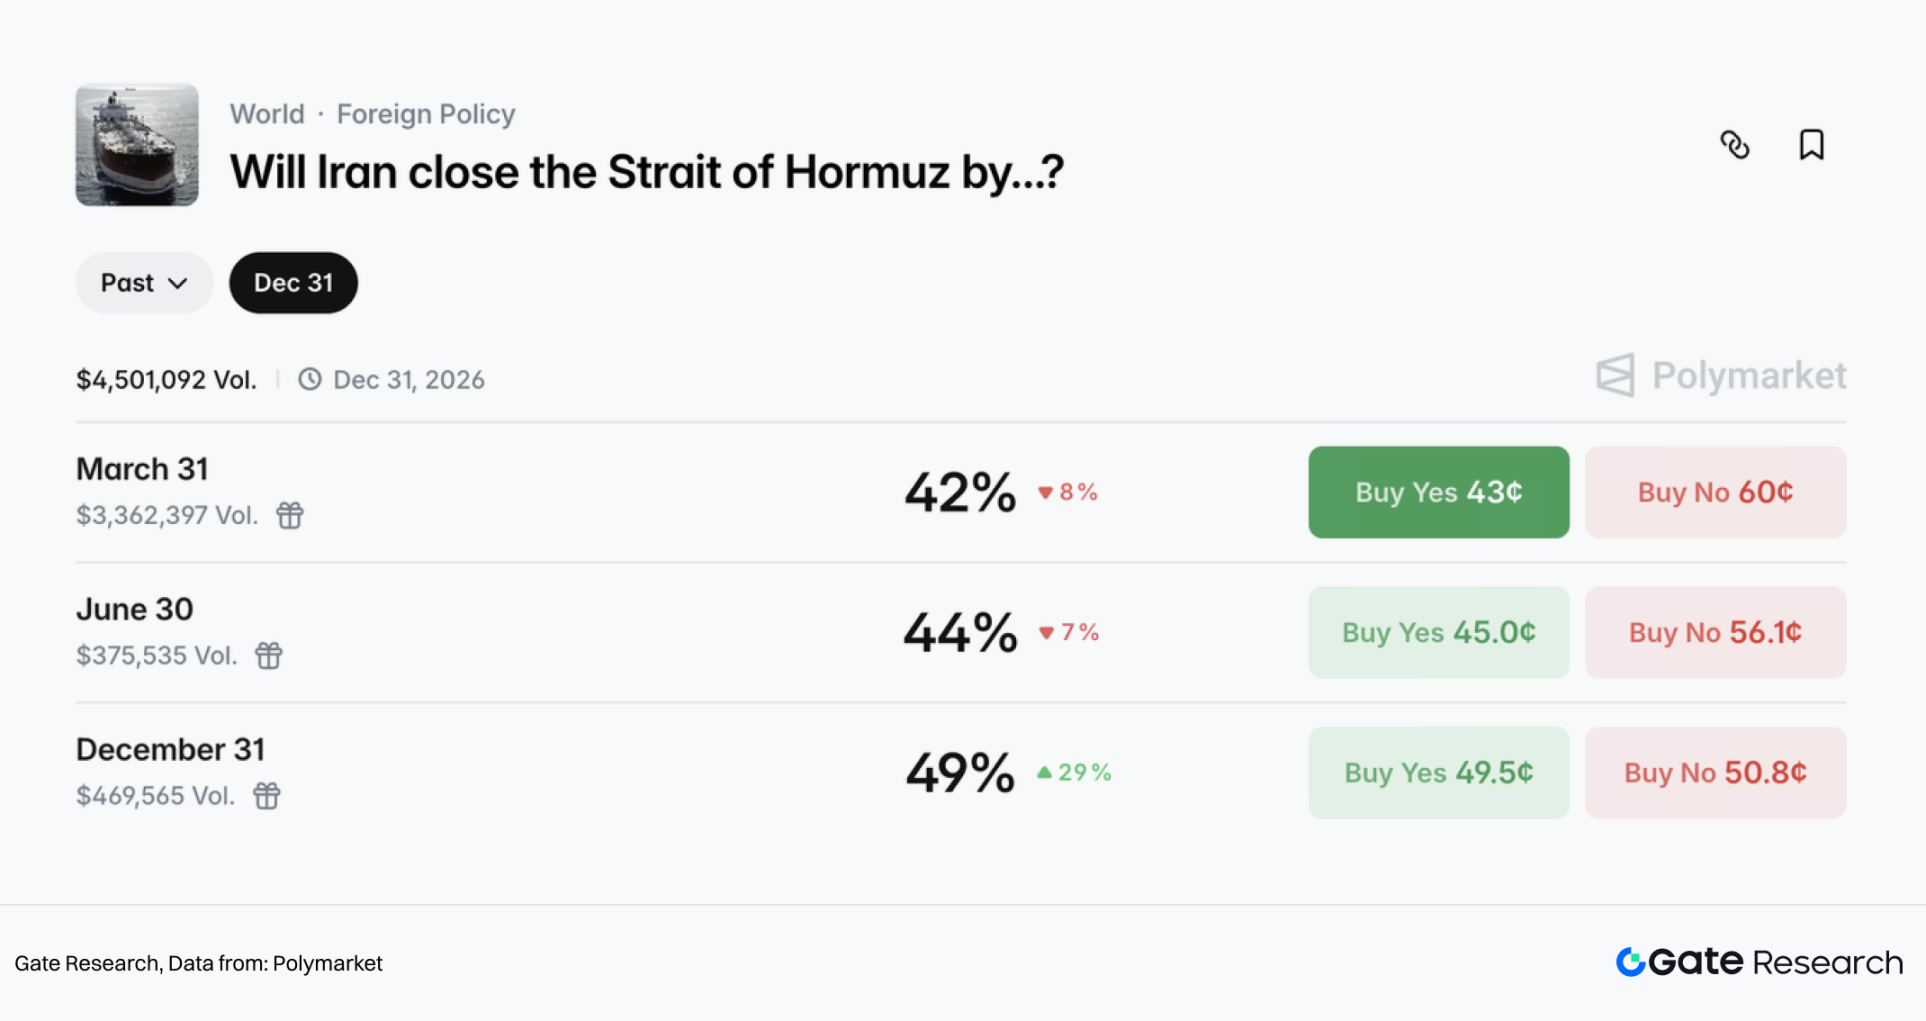
Figure: Prediction of Iran closing or severely restricting the passage of the Strait of Hormuz before March 31
(3) The duration of the conflict is expected to cool within weeks, but an official cease-fire will come later.
In terms of timing, Polymarket estimates about a 47% chance of "the conflict ending before March 31," but it is essential to note that this rule stipulates that there must be a continuous absence of new military actions for 14 days.
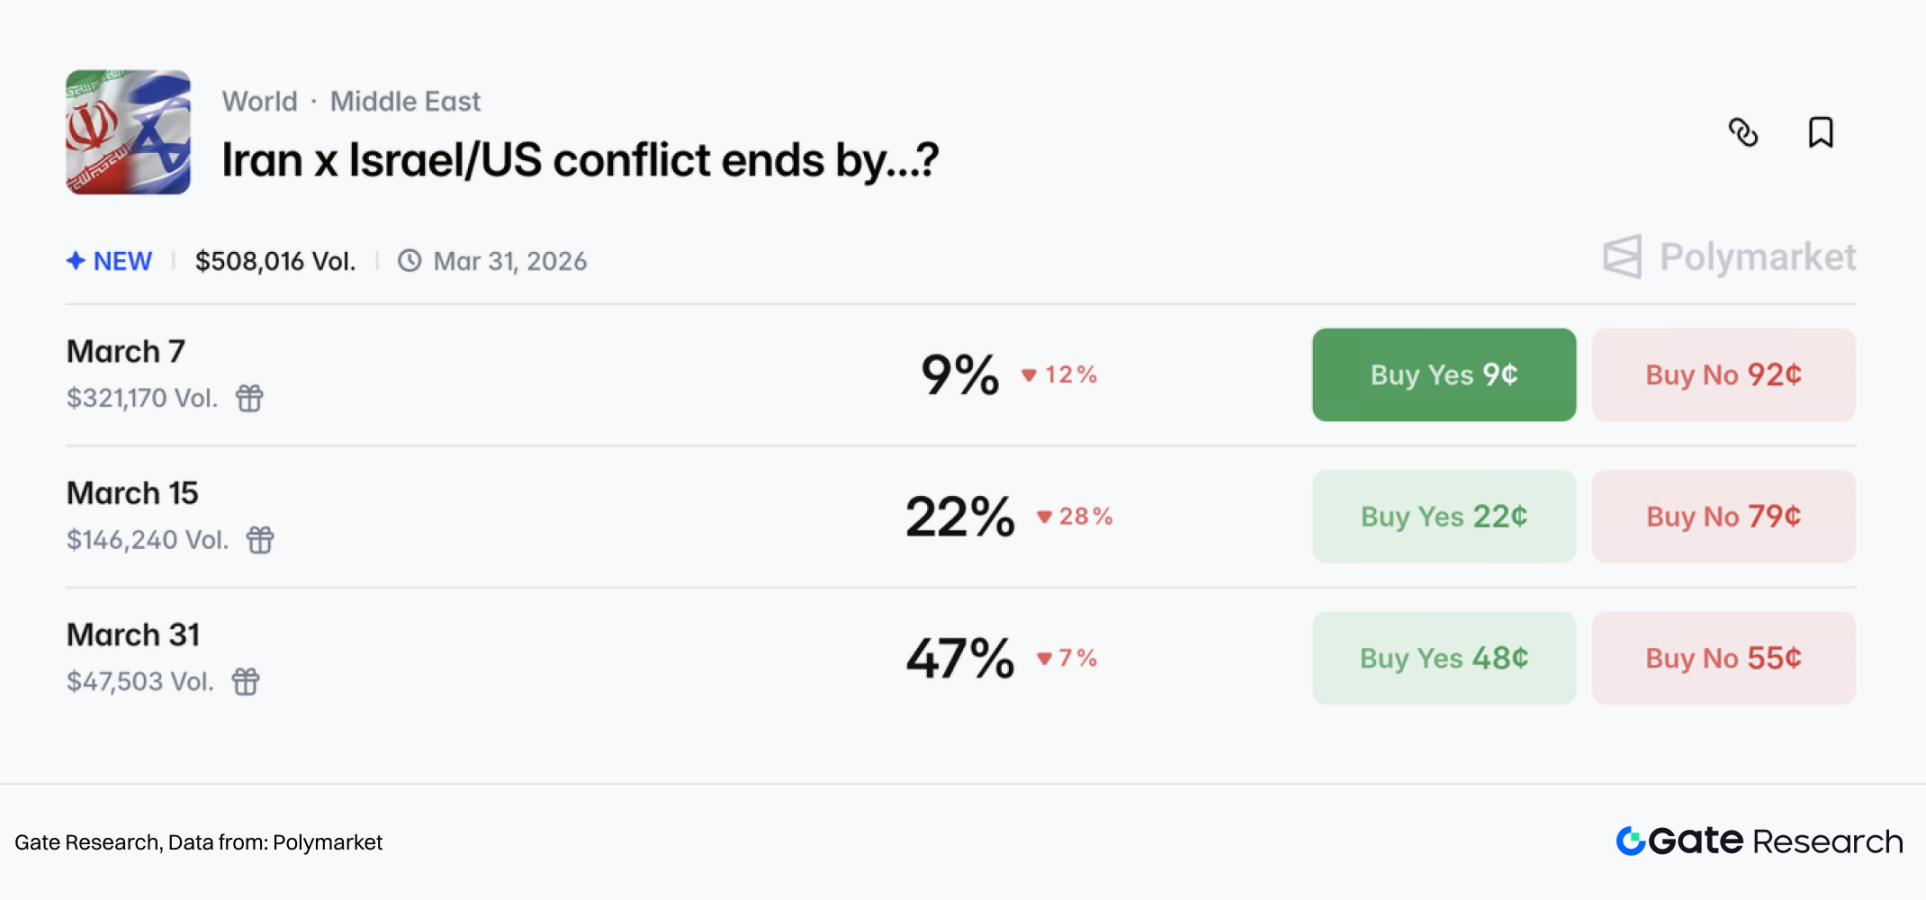
Figure: Prediction of the conflict ending before March 31
Another more official prediction event for the ceasefire would be "when will the US and Iran reach an official ceasefire agreement," with the market giving about 55% before March 31 and approximately 71% before April 30.
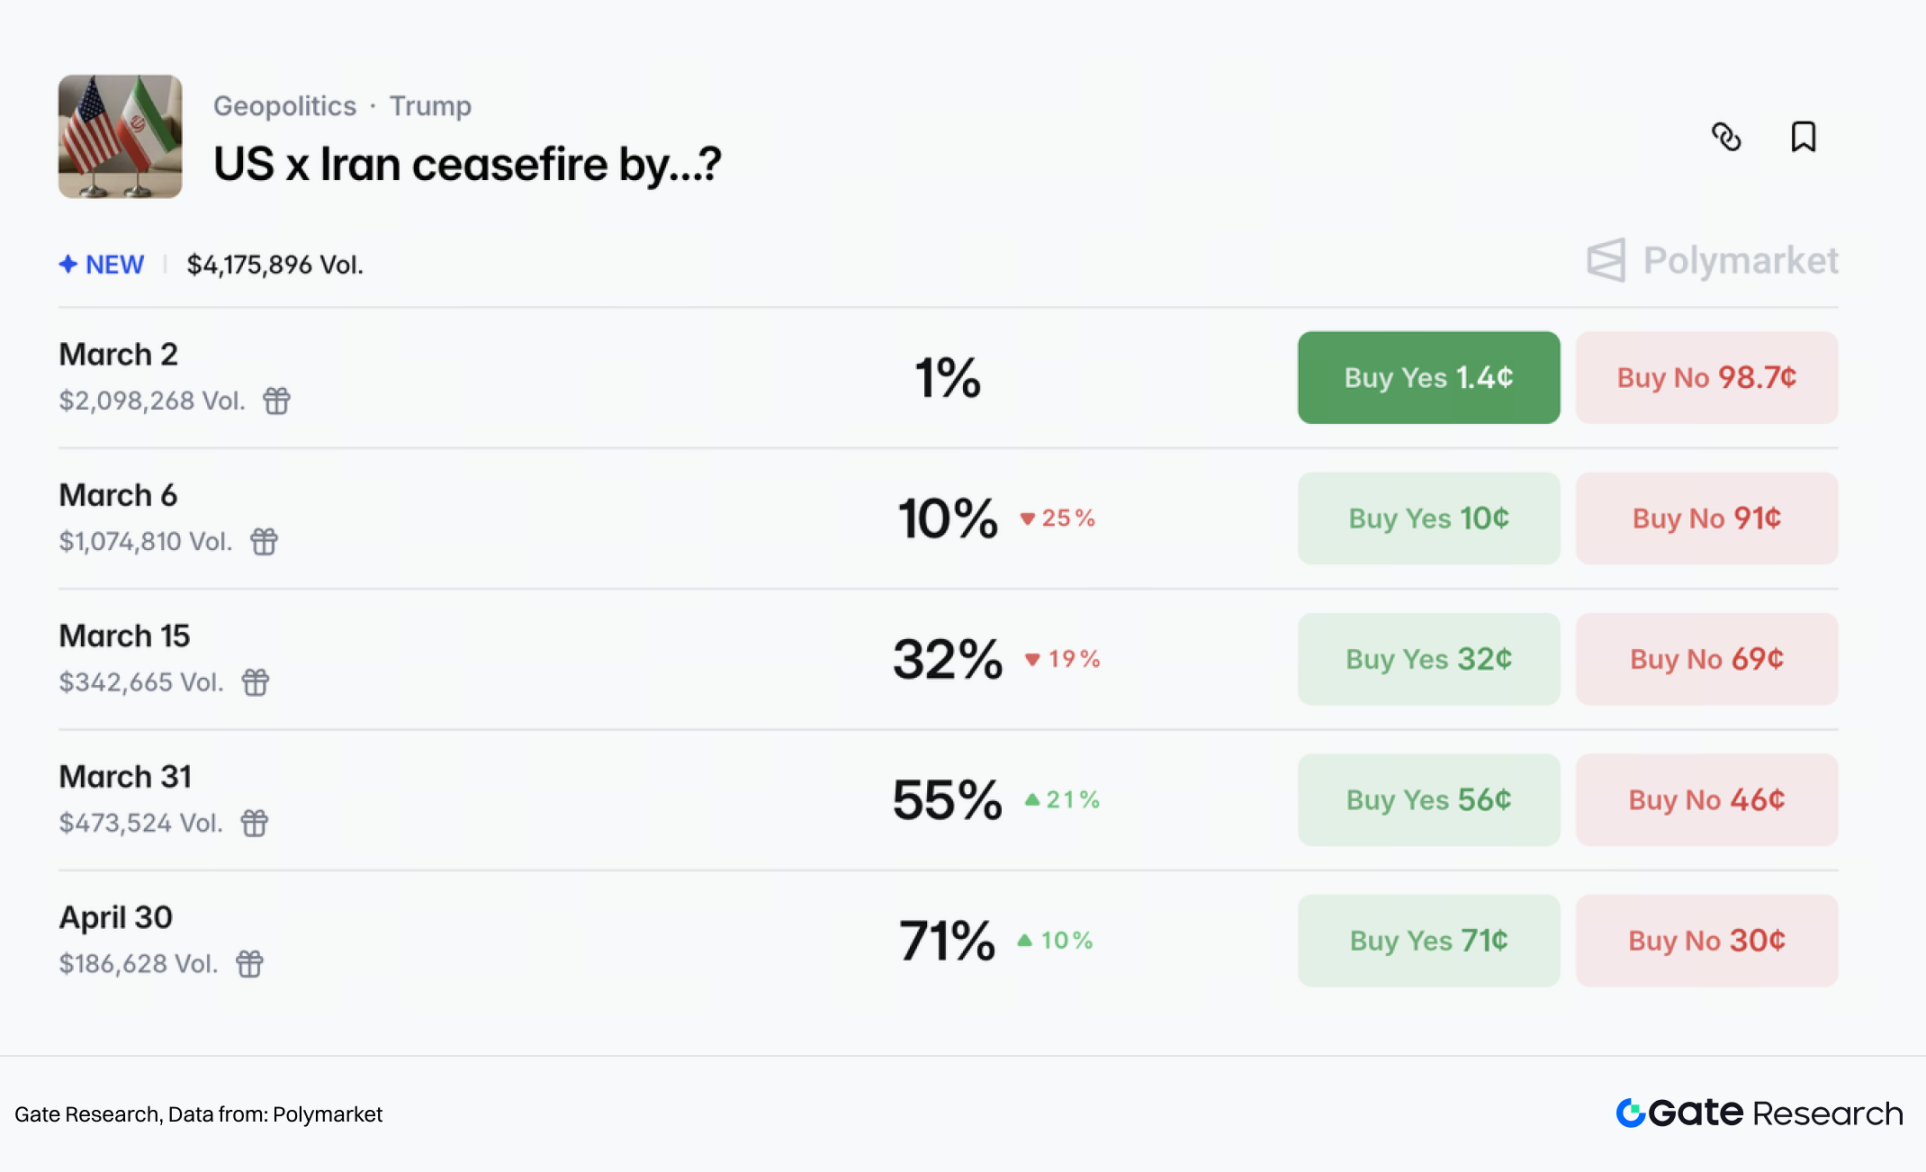
Figure: Prediction of when the US and Iran will reach an official ceasefire agreement
The combined messages from these two markets imply that traders are betting that the intensity of this conflict will decrease within weeks, but pricing for a formal ceasefire will be set at a later date.
2.2.2 Asset Impact Predictions
(1) Oil is the most directly priced asset amid geopolitical tensions.
In this conflict event, the pricing of oil combines two layers of logic: geopolitical risk premium and supply transport disruptions; the former is elevated by the escalation of the conflict and rising shipping risks, while the latter depends on whether the Strait of Hormuz is constrained or oil and gas facilities are attacked, influencing whether oil prices could push to more extreme right tails.
In the short term, the market views continued oil price increases as a "consensus"; even if a complete blockade does not occur, as long as "shipping/insurance/diversion costs" rise, oil's risk premium will significantly elevate in the short term. Polymarket predicts a 99% chance of oil increasing on this day (March 2); simultaneously, probabilities of reaching $80 by end of March stand at 64%, $90 at 32%, $100 at 16%, and $110 at 10%.
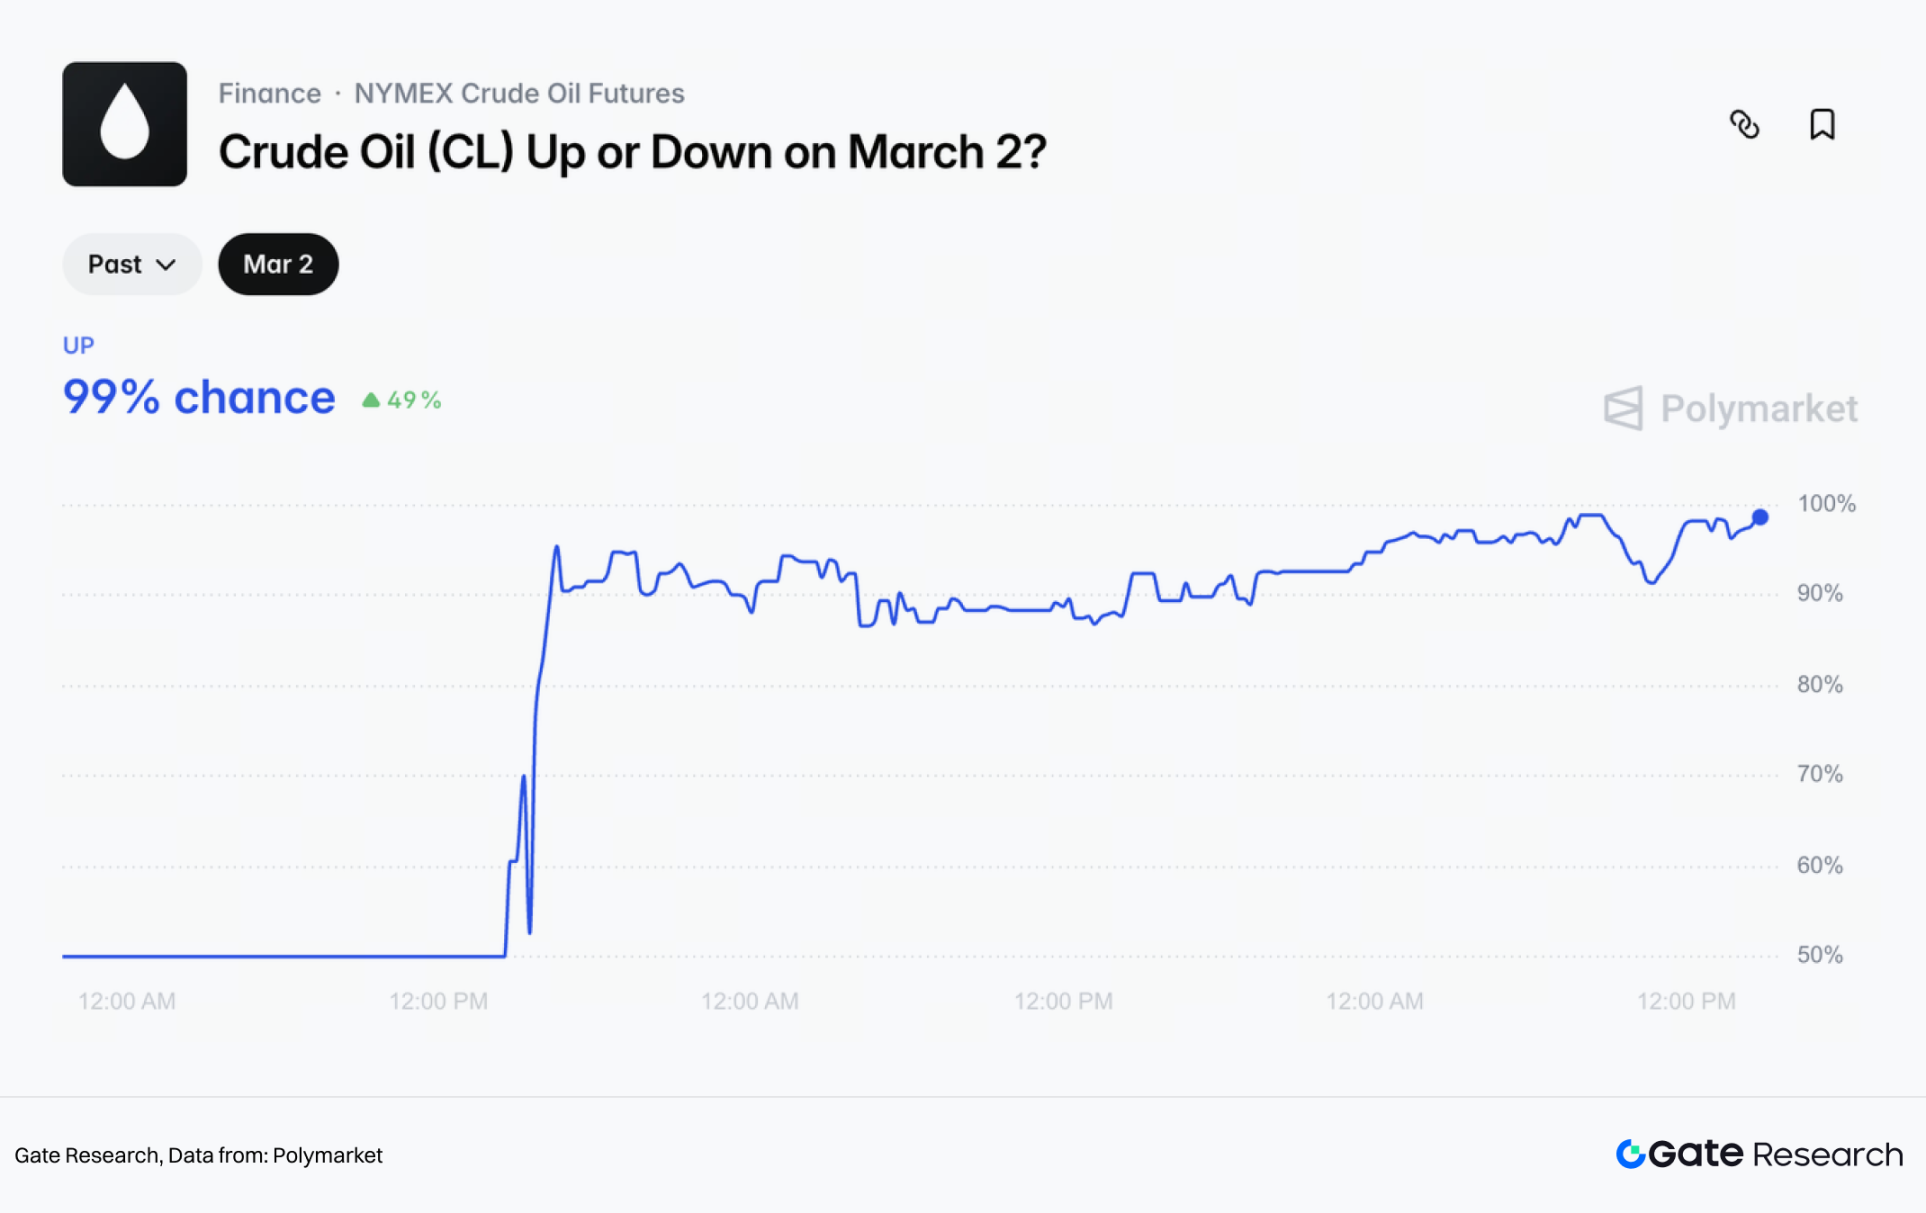
Figure: Probability of oil increasing on March 2
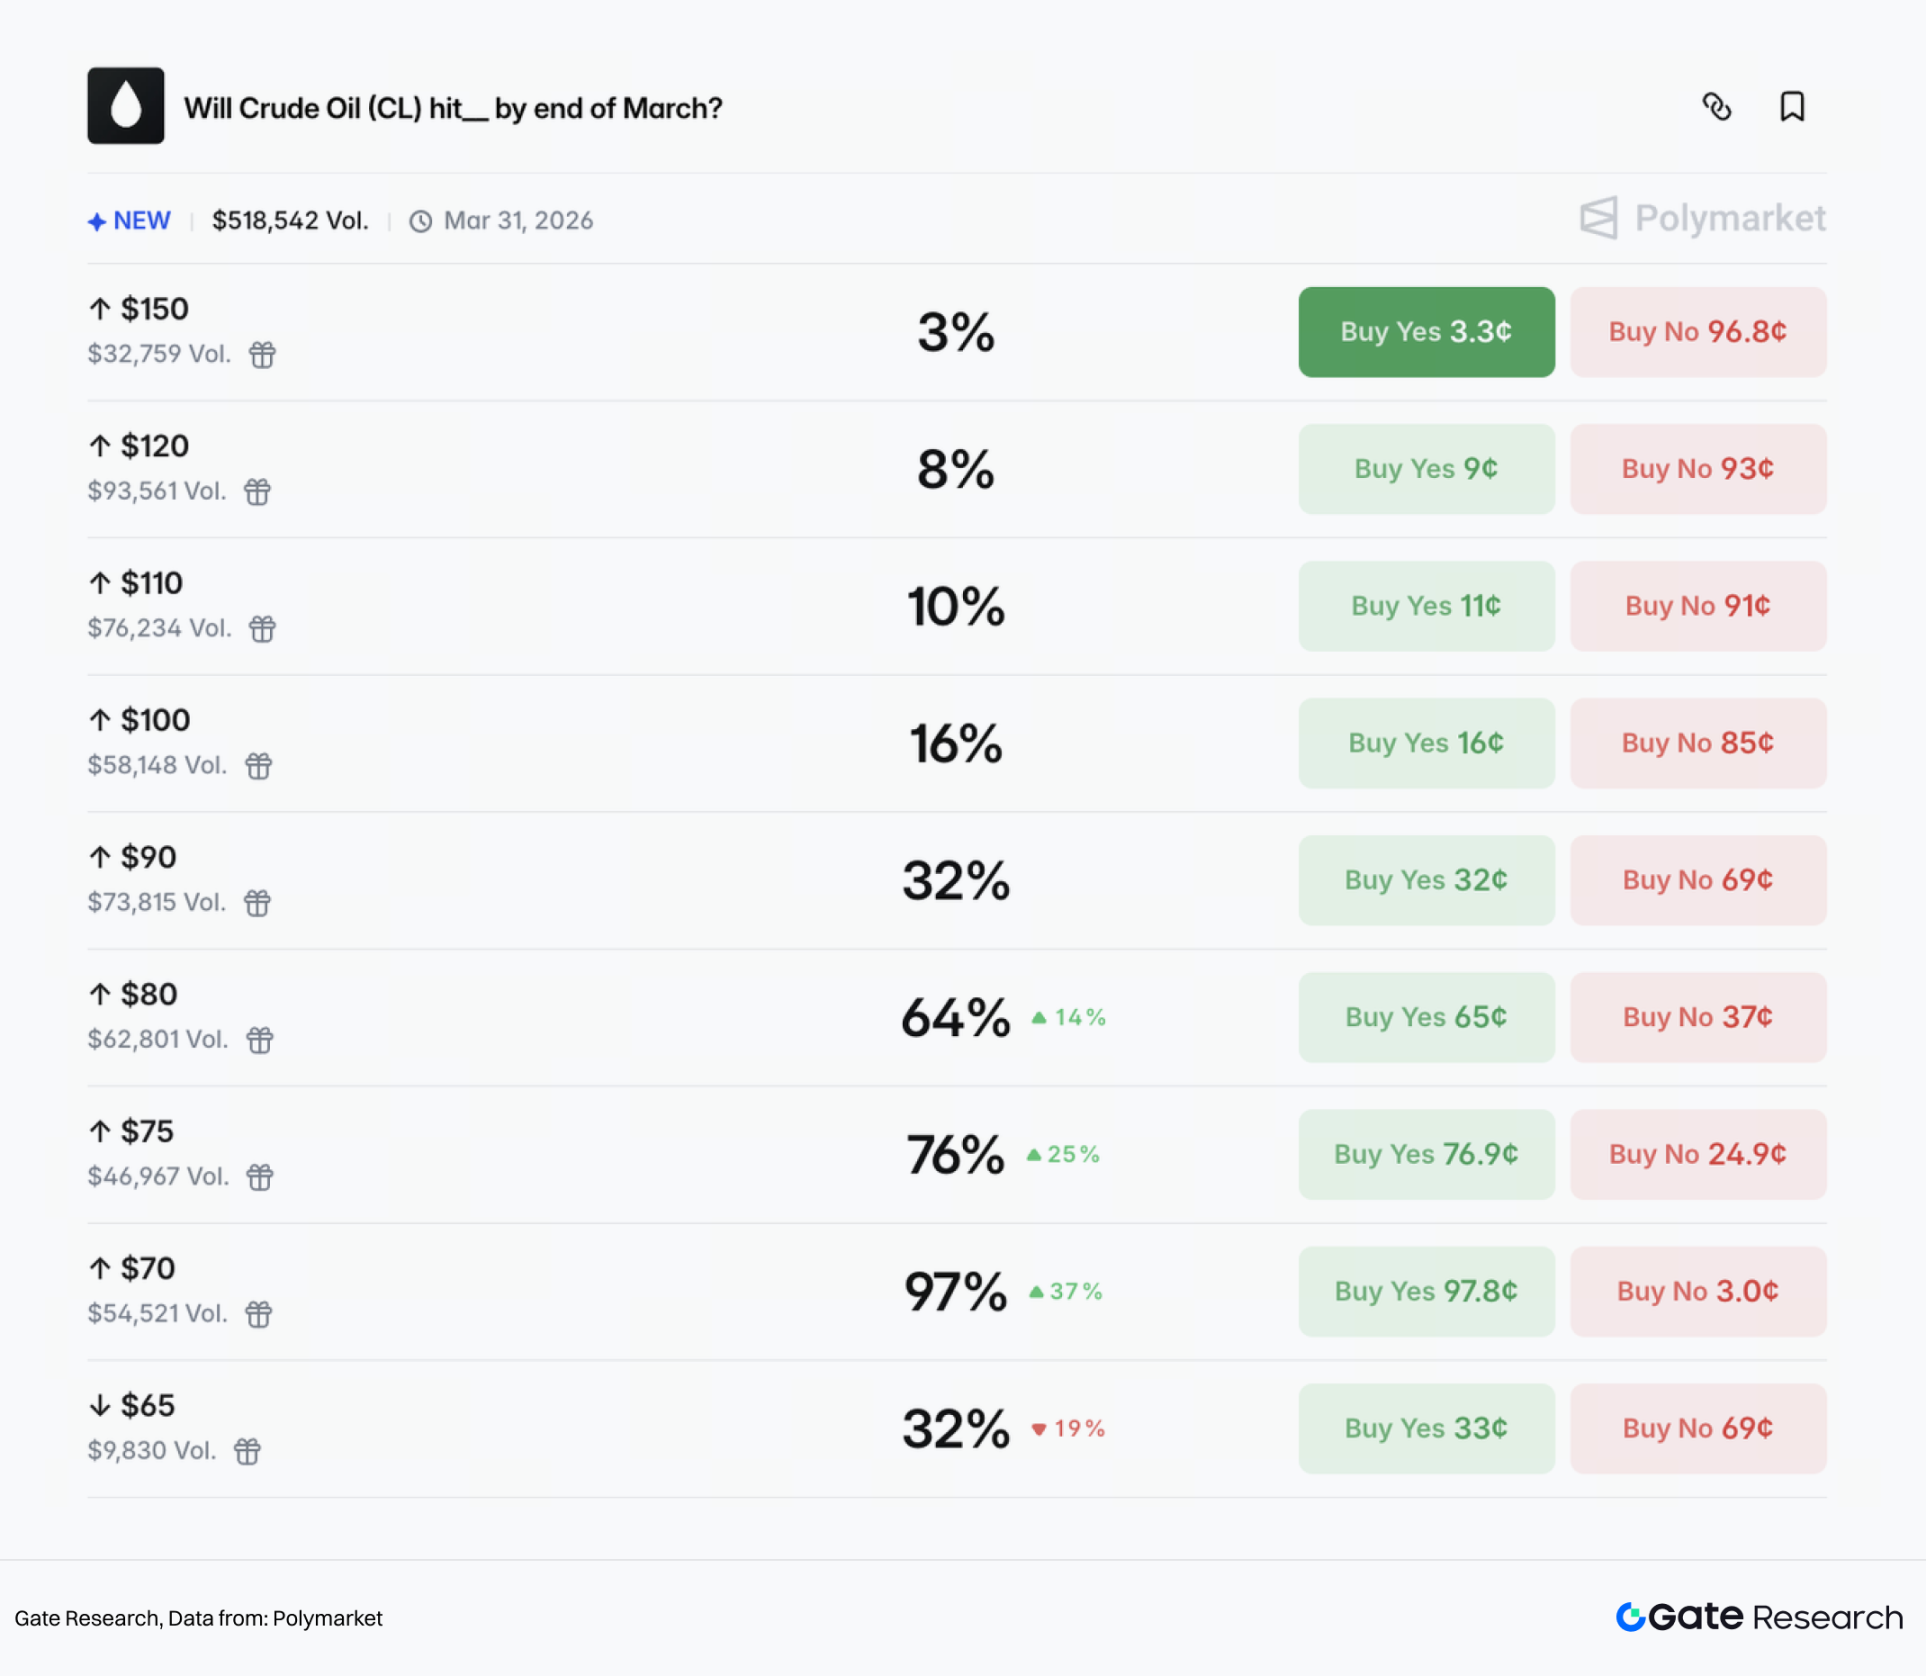
Figure: Oil price prediction for the end of March
(2) Gold benefits.
As geopolitical risks rise and macro uncertainties increase, capital will first seek traditional safe havens, such as gold. After the escalation of the conflict, spot gold has risen to approximately $5,350 per ounce. The market forecasts a positive long-term price outlook for gold, with a probability of reaching $5,500 before the end of June estimated at 85%, $5,700 at 77%, $6,000 at 60%, and $6,200 at 44%; conversely, the probability of retreating to $4,200 or lower is less than 20%.
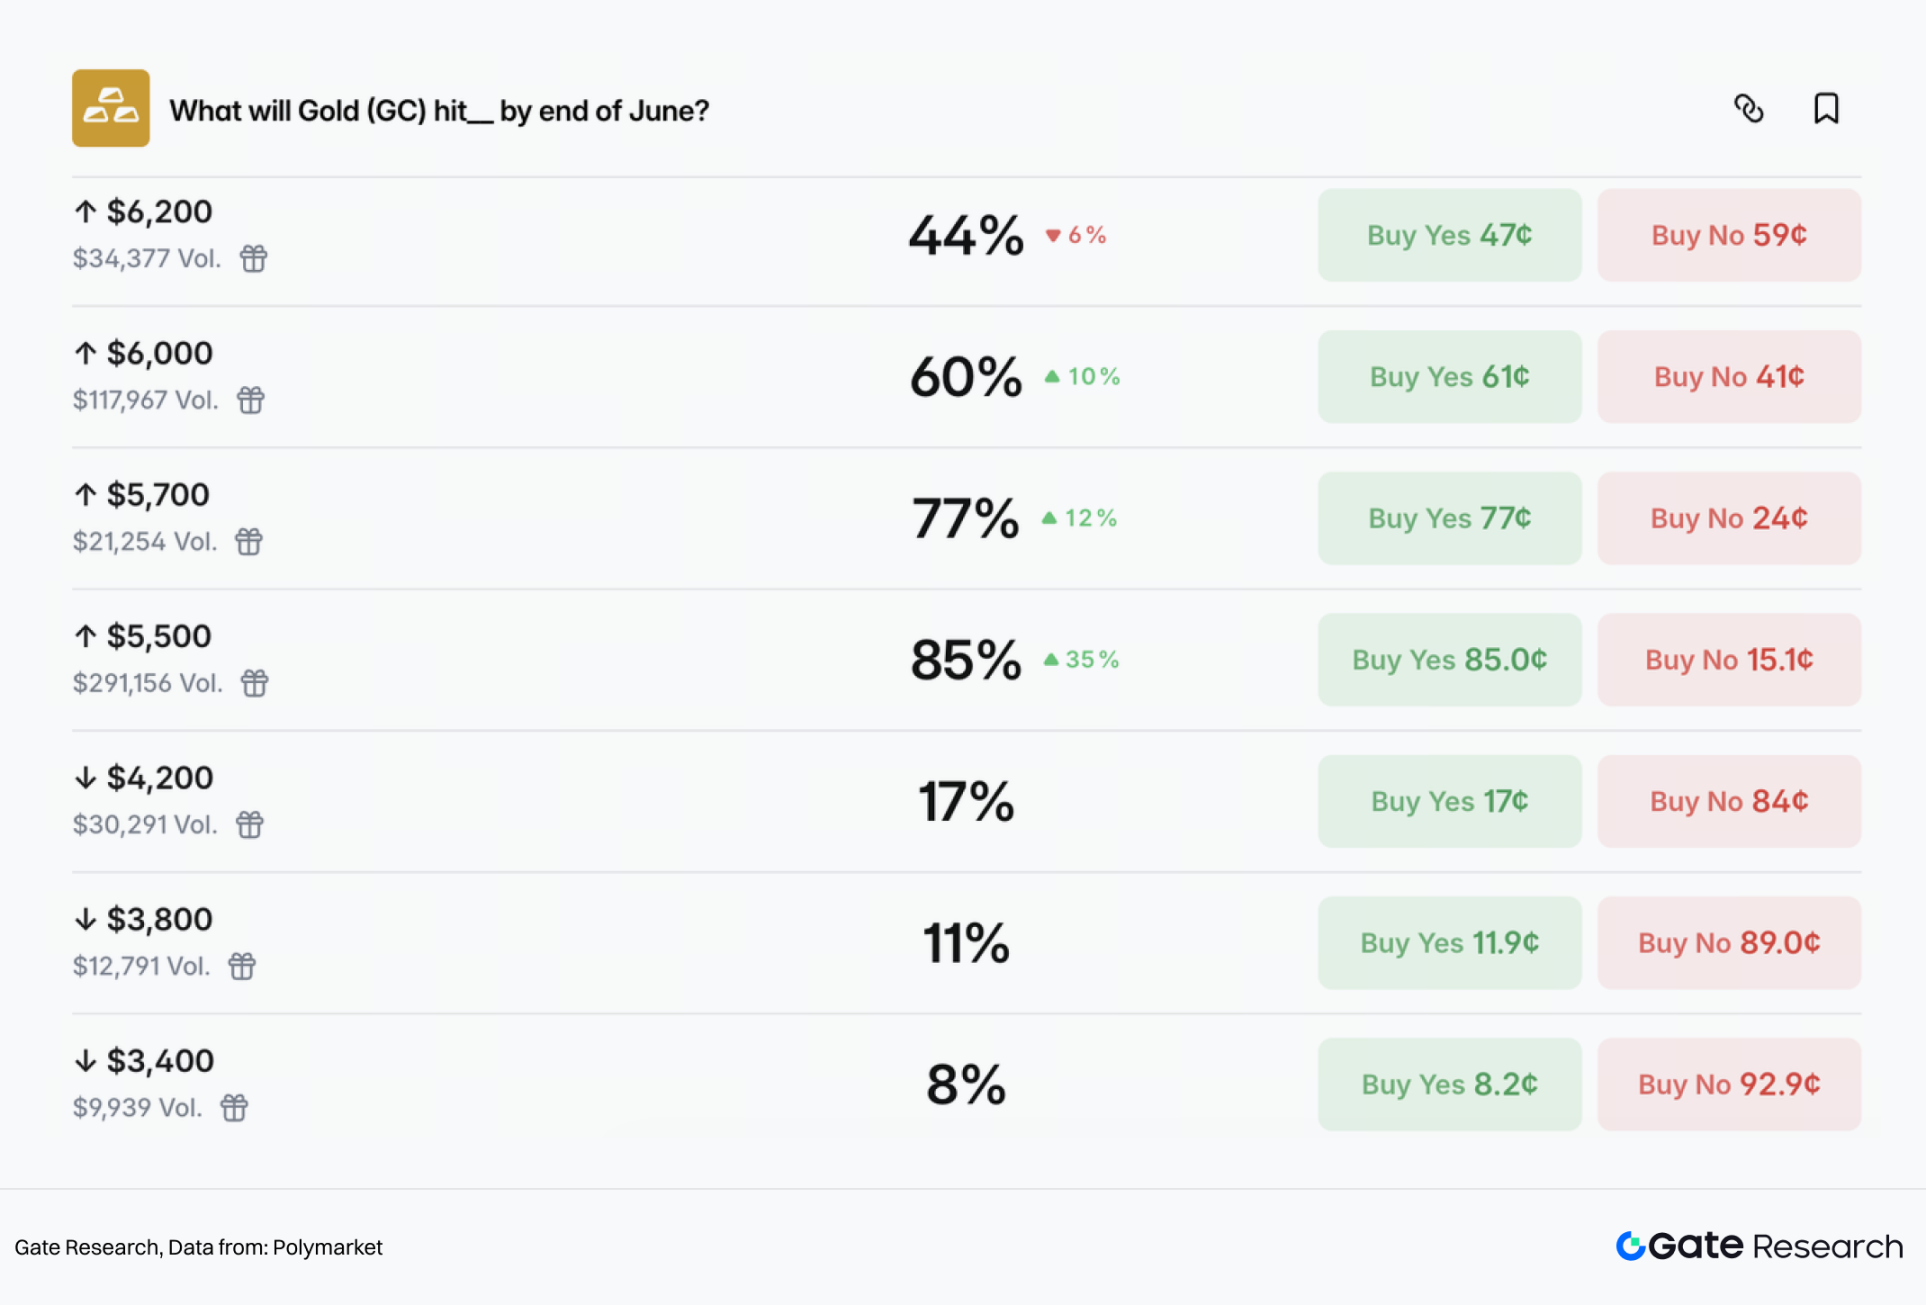
Figure: Gold price predictions before the end of June
For gold, the key may not be whether it rises, but rather the volatility structure of the upward momentum. If the conflict cools as the prediction markets bet on within weeks, gold may shift to high-level oscillations; if risks surrounding Hormuz continue to rise, driving up oil price inflation, gold may receive renewed upward momentum from inflation expectations and policy pathways being repriced.
(3) BTC is more of a risk asset in the short term.
BTC typically is first priced as a risk asset amid geopolitical conflicts, with increased volatility triggering deleveraging, followed by discussions whether the safe-haven narrative holds.
In terms of short-term sentiment, Polymarket's "BTC price movement on March 2" prediction indicates a stark difference from oil and gold, with relatively higher uncertainty.
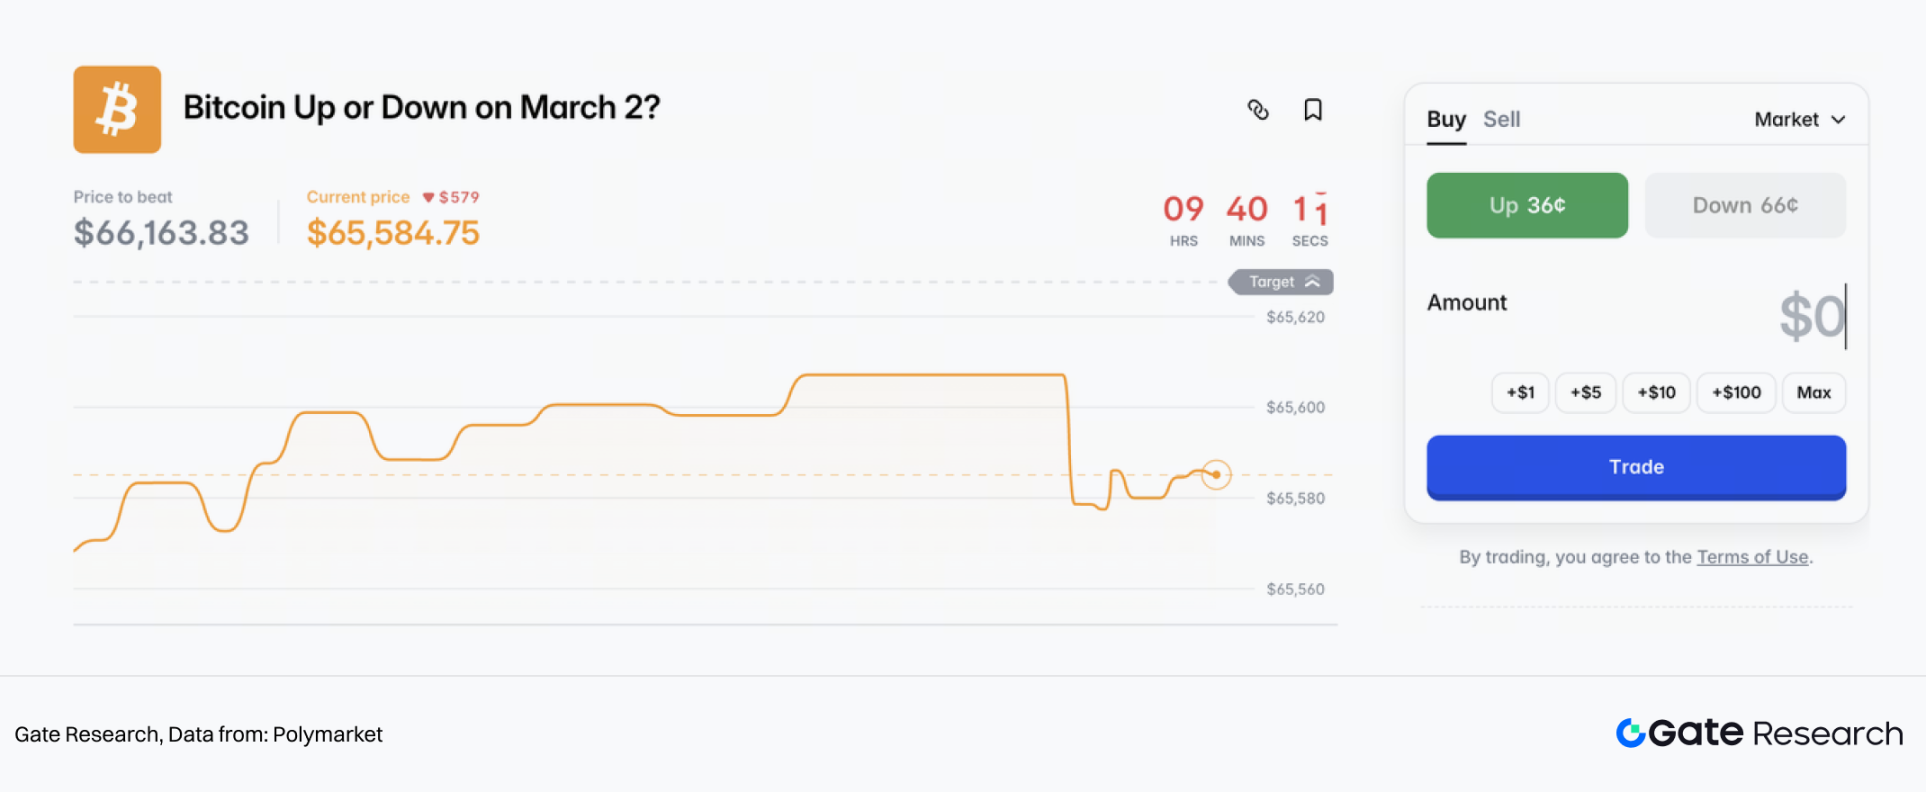
Figure: BTC price prediction for March 2
The Hormuz risk is a node in the short to medium-term price games for BTC. If risks continue to rise, an increase in oil prices will elevate discussions around re-inflation or a more hawkish rate pathway, where BTC may mimic patterns of first facing pressure and later selecting a trend. The medium to long-term bifurcation point lies in whether the conflict drags on into a more prolonged uncertainty. If, as the market expects, it cools within weeks and a formal ceasefire is reached shortly thereafter, BTC is more likely to develop within the trading framework dominated by the US dollar, liquidity, and risk preferences. However, should it evolve into a prolonged state accompanied by sanctions, capital flow frictions, and increased payment system fragmentation, BTC could then become more likely to gain an alternative safe-haven incremental narrative.
2.3 Overseas Political Analysis
In the short term, how will the US-Iran conflict unfold? For the US, after successfully implementing the "decapitation strike," strategic initiative has markedly improved. Under the established principle of not deploying ground troops while avoiding entanglement in endless wars, the phase of "striking to facilitate talks" is fundamentally complete. If subsequent conflicts escalate, causing long-term blockages in the Strait of Hormuz and a drastic rise in oil prices, the Fed may be forced to adopt a more hawkish stance to curb inflation; this would not only impact the US economy but also pose significant political risks for Trump's mid-term elections. Conversely, if there is a rapid compromise without reaching a more favorable nuclear deal, Trump would similarly face pressure from hardliners domestically. Therefore, after weighing economic and political costs, "controllable escalation and limited exit" may become a more realistic path.
Mainstream market assessments suggest that both the US and Iran are likely to control the scale of the conflict, replicating the rhythm of the June 2025 Israel-Iran "Twelve-Day War," primarily via air strikes while avoiding ground wars, each announcing phased victories internally to consolidate political support. The conflict is expected to gradually ease within 2-3 weeks, and as risk premiums recede, gold and oil prices may pull back from high levels, leading to a decrease in market risk aversion.
However, attention must be paid to the following key variables:
1. Whether there is a substantive blockage in the Strait of Hormuz. This crucial strait handles about 20%-30% of global oil maritime transport. Currently, there are signs of slowing shipping, and Iran has publicly stated it does not intend to close the strait. However, if the conflict escalates and actual blockades are implemented, the probability of Brent crude surging above $100-$110 per barrel will significantly increase.
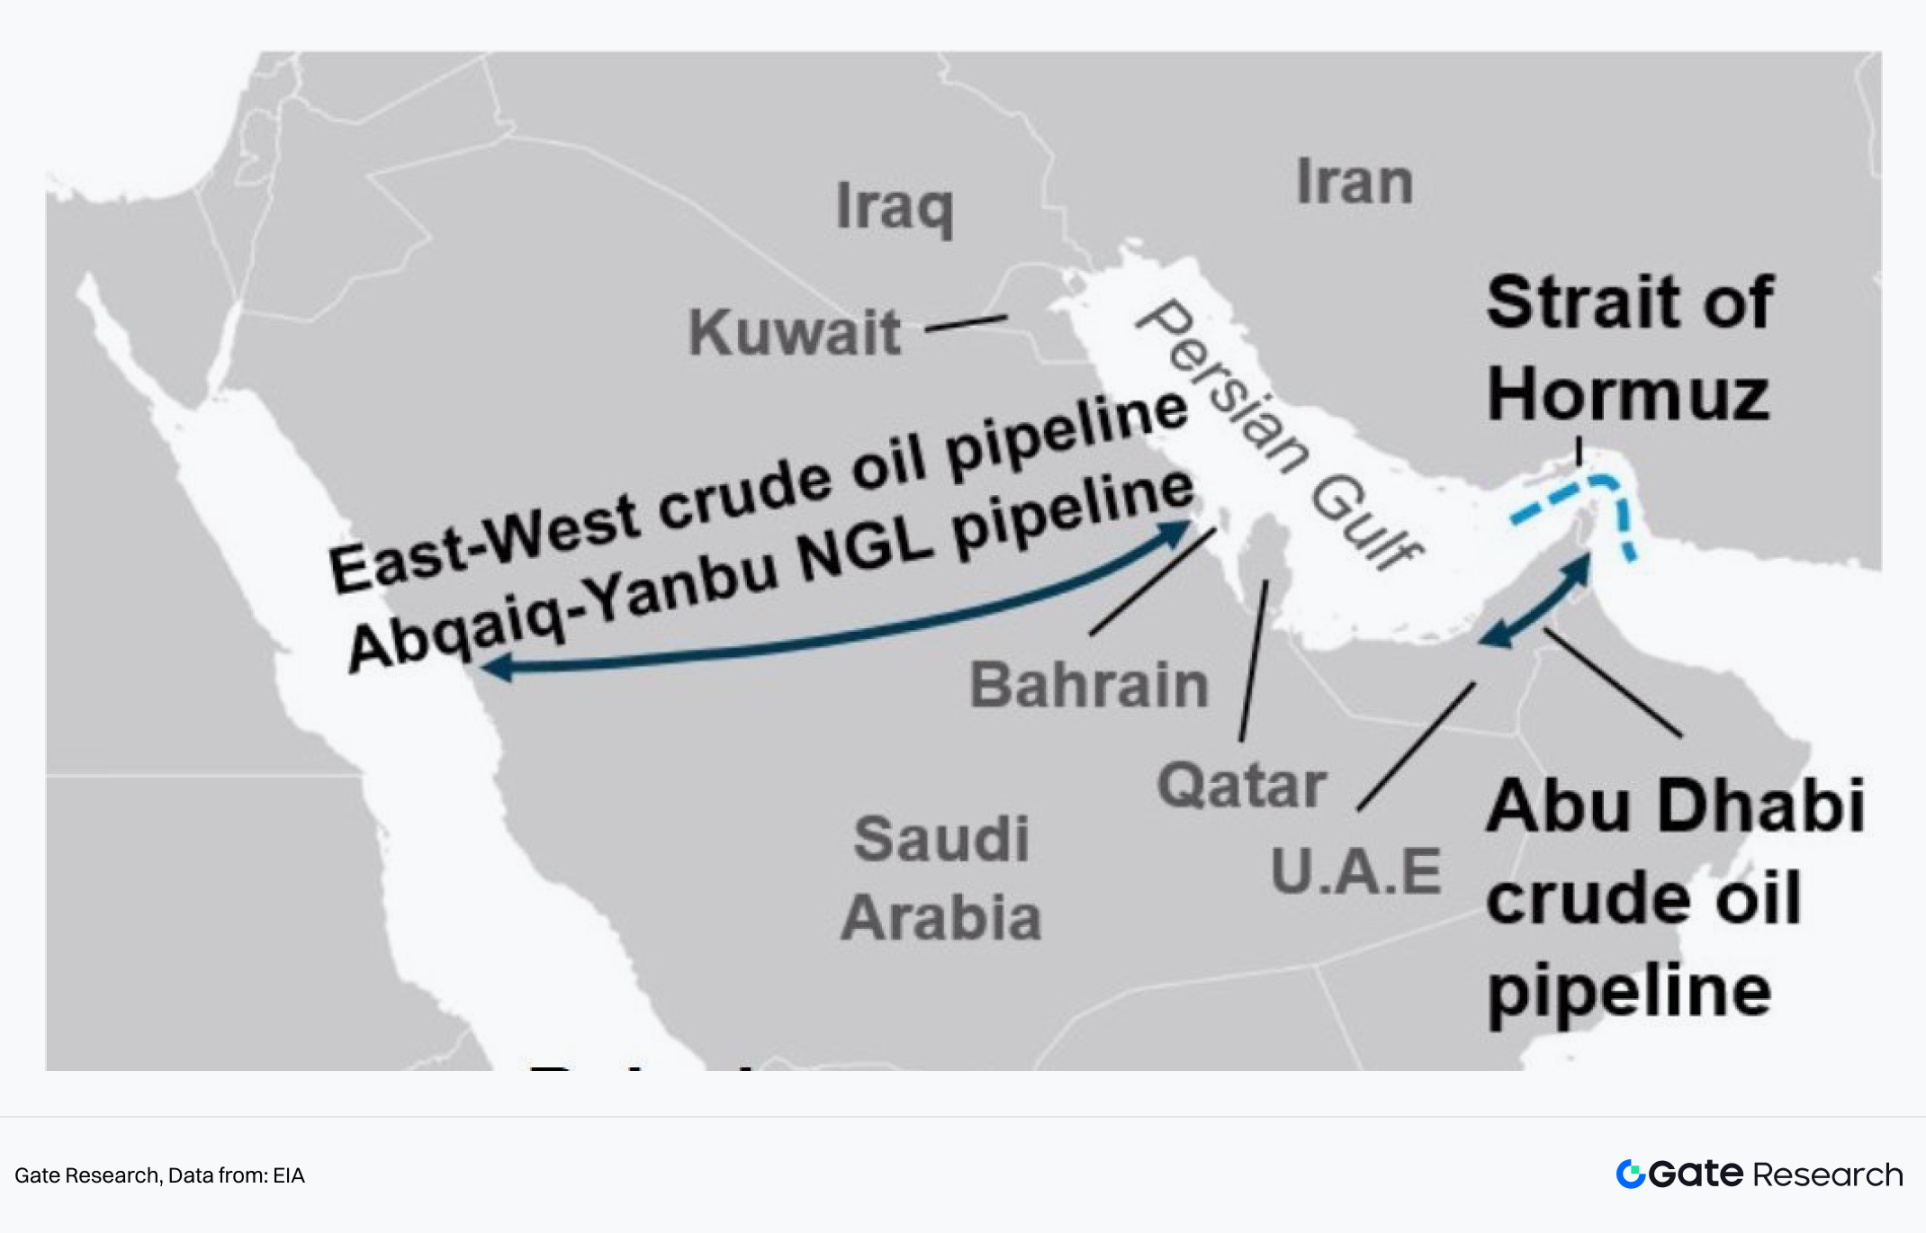
Figure: Strategic significance of the Strait of Hormuz
2. Whether the US is forced to engage in ground wars. If the US deploys ground troops or is passively drawn into a protracted conflict due to Israel's hardline stance, the nature of the conflict will fundamentally change. The US will face dual pressures: surging oil prices pushing up inflation, compelling a shift in monetary policy towards tightening; and long-term military consumption dragging down fiscal strength and power, similarly increasing the risk of a "war of attrition" like that seen in the Russia-Ukraine conflict.
3. The uncertainties surrounding Iran’s internal power structure. The extent to which the successor leadership can control state apparatus and the Revolutionary Guard and its policy orientation towards the US remains uncertain. Whether the provisional leadership committee can integrate internal factions and avoid military fragmentation will determine whether Iran heads towards a highly militarized hardline regime or experiences a power imbalance under internal and external pressures, subsequently influencing escalation or de-escalation of the conflict.
Overall, current market pricing revolves around "limited conflict," but tail risks have yet to be fully cleared, with fluctuations in the geopolitical premium remaining the core variable for asset prices in the coming weeks.
3. Potential Investment Opportunities
From a strategic framework perspective, overseas markets are likely to exhibit a path of "risk aversion first, followed by recovery" in the short term, but medium to long-term uncertainties are still not cleared. According to Bloomberg’s model calculations, crude oil prices have cumulatively risen by about $11 per barrel since the beginning of the year, with "geopolitical risk premium" and "demand improvement" contributing approximately $6 and $5 respectively, indicating that the current oil price structure has significantly increased the proportion of risk premium. Coupled with statements from the Israeli side, the conflict is expected to persist in the upcoming week, projecting that risk aversion sentiment will phase out, favoring safe-haven assets like gold, oil, and bonds while adversely impacting global equity markets.
If the conflict shows signs of cooling within 2-3 weeks, risk premiums are expected to gradually retract, oil prices may retreat to the $60–70 range, and gold prices could similarly adjust towards around $5,200. However, the structural demand for gold from global central banks continues to rise, providing a bottom support for gold’s medium to long-term trends. Looking at the longer term, the frequency and intensity of global geopolitical conflicts are on an upward trend, with persistent uncertainties regarding energy security and monetary credibility. Based on strategic allocation perspectives, gold and oil possess properties of hedging against inflation and geopolitical risks, still holding value as core assets for medium to long-term allocations.
Reference:
•Gate, https://www.gate.com/trade/BTC_USDT
•Polymarket, https://polymarket.com/predictions/iran
•X, https://x.com/World_Data_A/status/1972567940223365134/photo/1
•Goldman Sachs, https://marquee.gs.com/welcome/home
•TradingView, https://www.tradingview.com
免责声明:本文章仅代表作者个人观点,不代表本平台的立场和观点。本文章仅供信息分享,不构成对任何人的任何投资建议。用户与作者之间的任何争议,与本平台无关。如网页中刊载的文章或图片涉及侵权,请提供相关的权利证明和身份证明发送邮件到support@aicoin.com,本平台相关工作人员将会进行核查。


