Original | Odaily Planet Daily (@OdailyChina)
Author | Wenser (@wenser 2010)

After experiencing eight consecutive up days on the daily chart, BTC has turned around again, continuously declining from $76,000, currently reported at $69,200. The mainstream bottom-fishing indicators referenced in the past include Ahr999 (also known as the "9 God Index"), weekly RSI, STH-SOPR (short-term holder average buy price), LTH (long-term holder average buy price), and MVRV Z-Score (realized market value ratio), which are all in a “sometimes effective, sometimes ineffective” state: many indicators are at low levels, yet the market continues to decline; some indicators are at high levels, but the market occasionally surges.
In light of this, we will present four representative bottom-fishing indicators in the industry in this article and combine data and real-life "implicit indicators" to construct a new "bottom-fishing indicator," attempting to explore the downward space of BTC. The following content is for learning and communication purposes only and does not constitute investment advice; all investment risks are borne by the investor; please DYOR.
Four Classic Indicators for BTC Bottom-Fishing Timing: The Best Time Has Not Yet Come, BTC May Drop Below 60K
From the new high of $126,000 in October last year to the current range of around $70,000, BTC's price has been like a roller coaster in just a few months. In such a volatile crypto market environment, many industry indicators have lost their reference value, including but not limited to the dynamic and flexible mining machine shutdown prices, the fear and greed index, Google search heat index, and the rainbow chart established based on BTC's early penetration stage.
The reason is simple: with the influx of funds from BTC spot ETFs, the increasing number of DAT funding companies in the US, and the facilitation provided by US regulators, the assessment system for BTC has undergone structural changes; institutional holdings, derivative arbitrage, exchange internal settlements, and US macro monetary policy, as well as global geopolitical factors, have become higher weighted influences on BTC prices. In other words, past on-chain indicators and profit and loss can only be used for reference but cannot yield intuitive conclusions anymore.
Here we will present data using industry indicators that still hold some representativeness in the sector, which may more intuitively illustrate the current ineffectiveness of old indicators.
Indicator One: MVRV Z-Score, Anchoring Value System Collective Shift
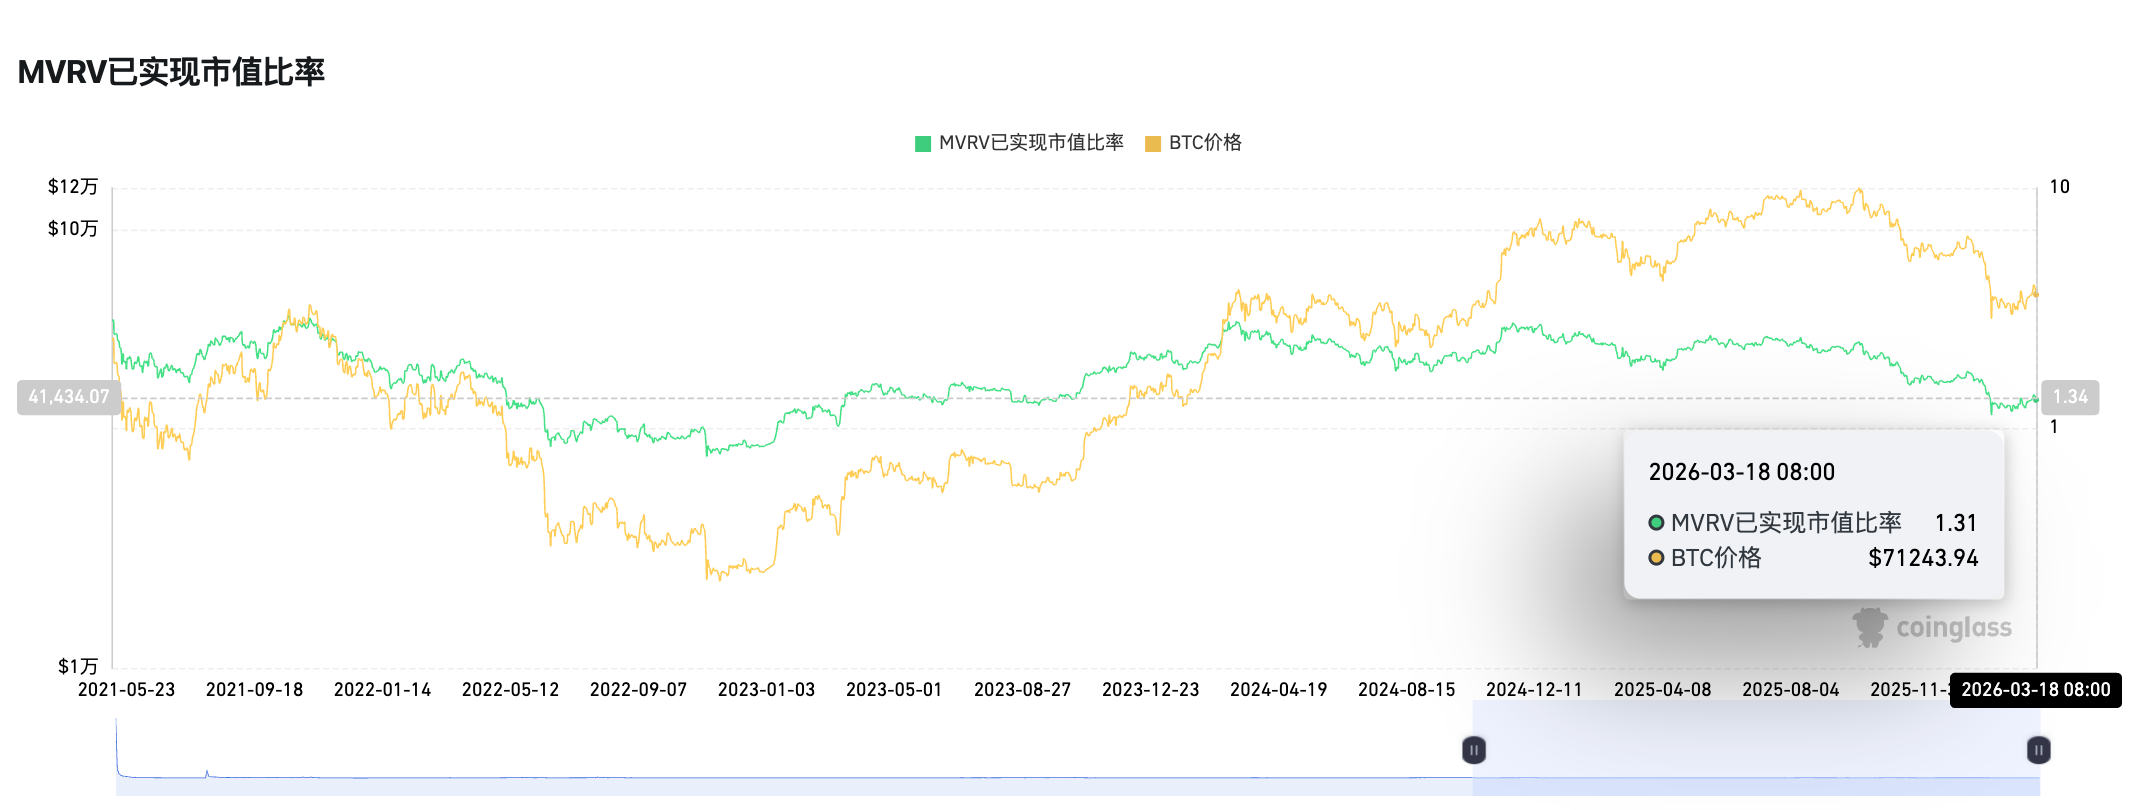
Figure One
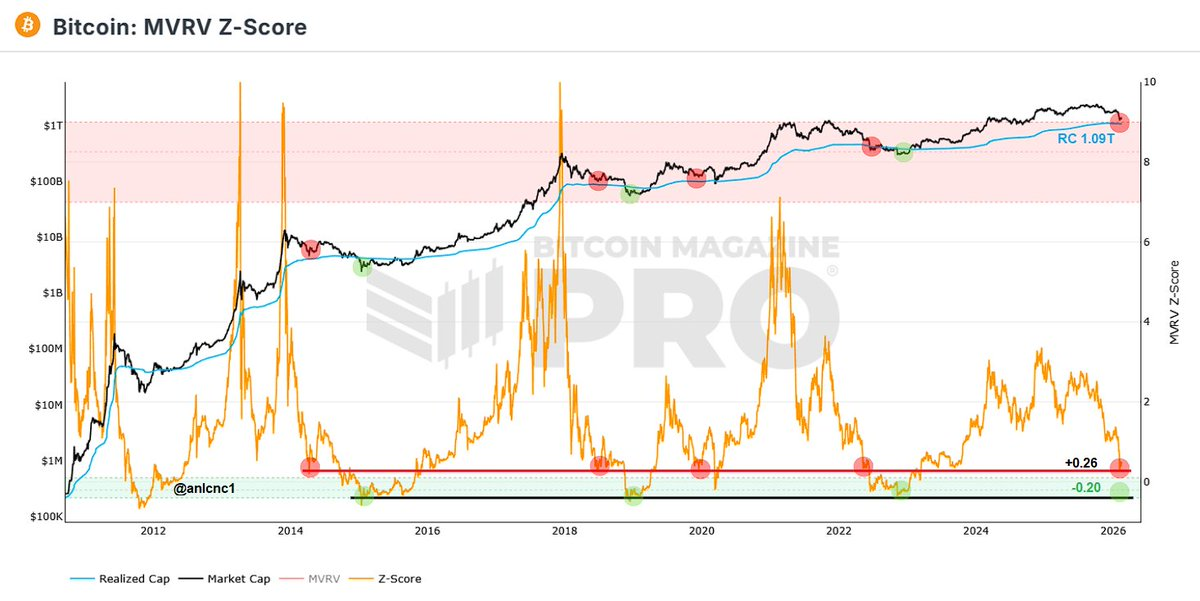
Figure Two
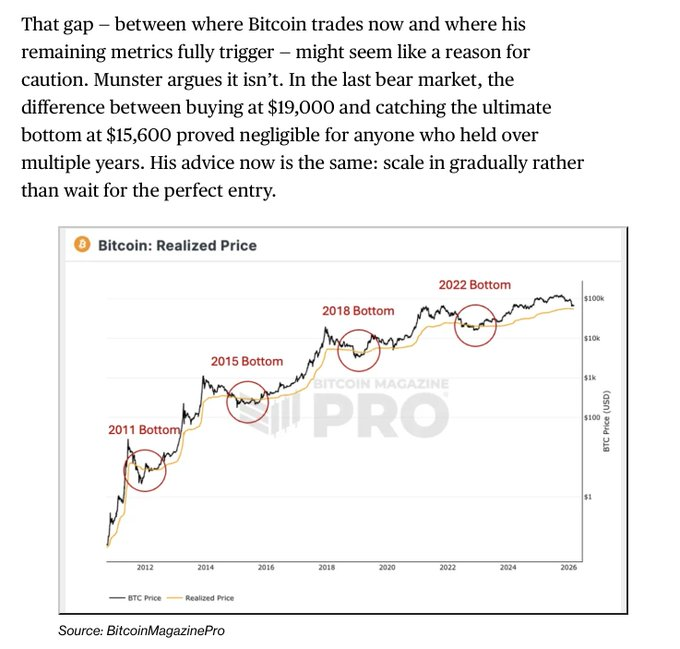
Figure Three
As of March 18, the MVRV indicator is reported at 1.31; previously, in February, crypto researcher Anıl pointed out that “when the MVRV Z-Score drops below 0, especially below -0.20, Bitcoin is at its price low point. In this cycle, the lowest value Bitcoin reached was +0.26, indicating that the classic 'green zone' has not been tested yet.” (See Figure Two above) On March 14, Bitcoin News stated that the MVRV Z Score has dropped to around 0.38, a level that previously indicated undervaluation. Other key support levels include the realized price around $54,000 and the 200-week moving average around $58,000. Bloomberg pointed out that the potential bottoming zone lies between $45,000 and $55,000, but a sustained recovery requires new demand support. (See Figure Three above)
Failure Reason: The large-scale holdings by ETF custodians and DAT companies systematically raised the realized value (RV), significantly increasing the denominator (standard deviation) of the Z-Score; historically, the 'extreme negative values' have been difficult to reproduce under the current structure.
Indicator Two: Ahr999 Index (9 God Index), Bottom-Fishing Zone Below 0.45 Has Lasted Nearly 50 Days
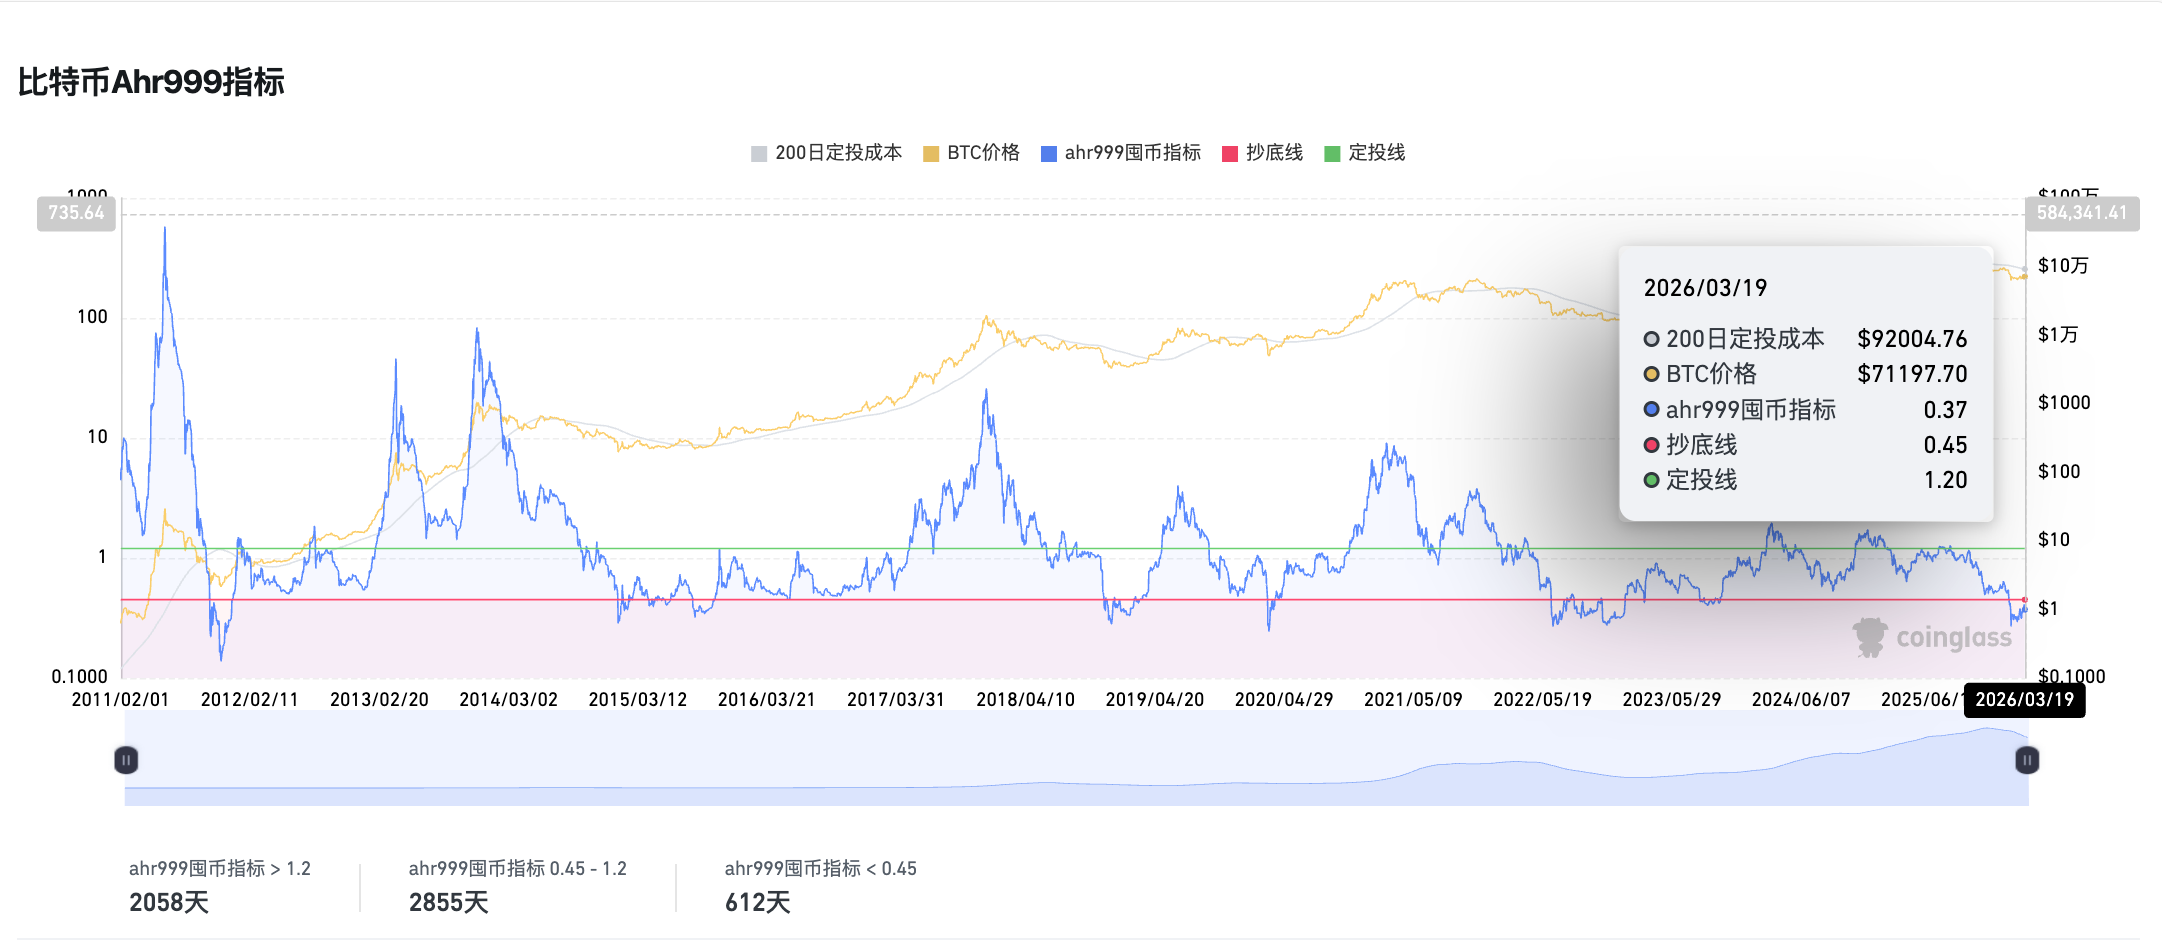
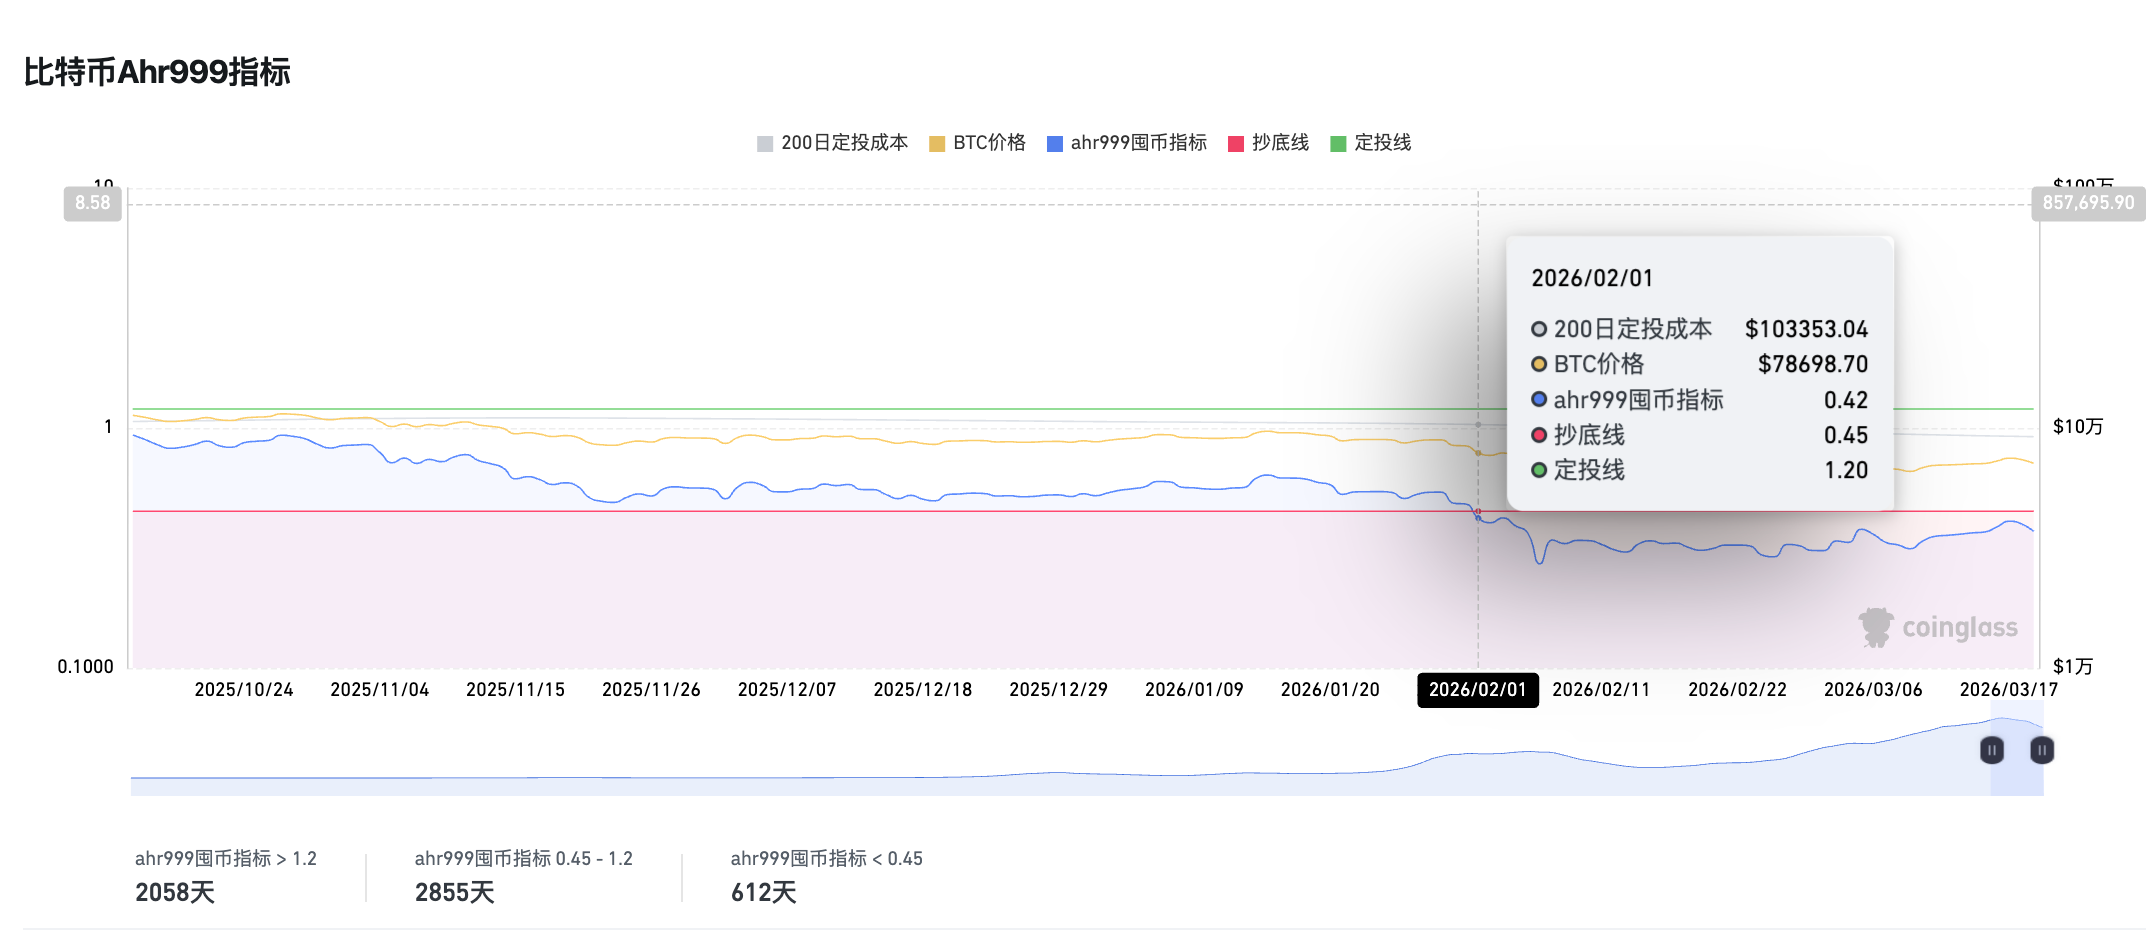
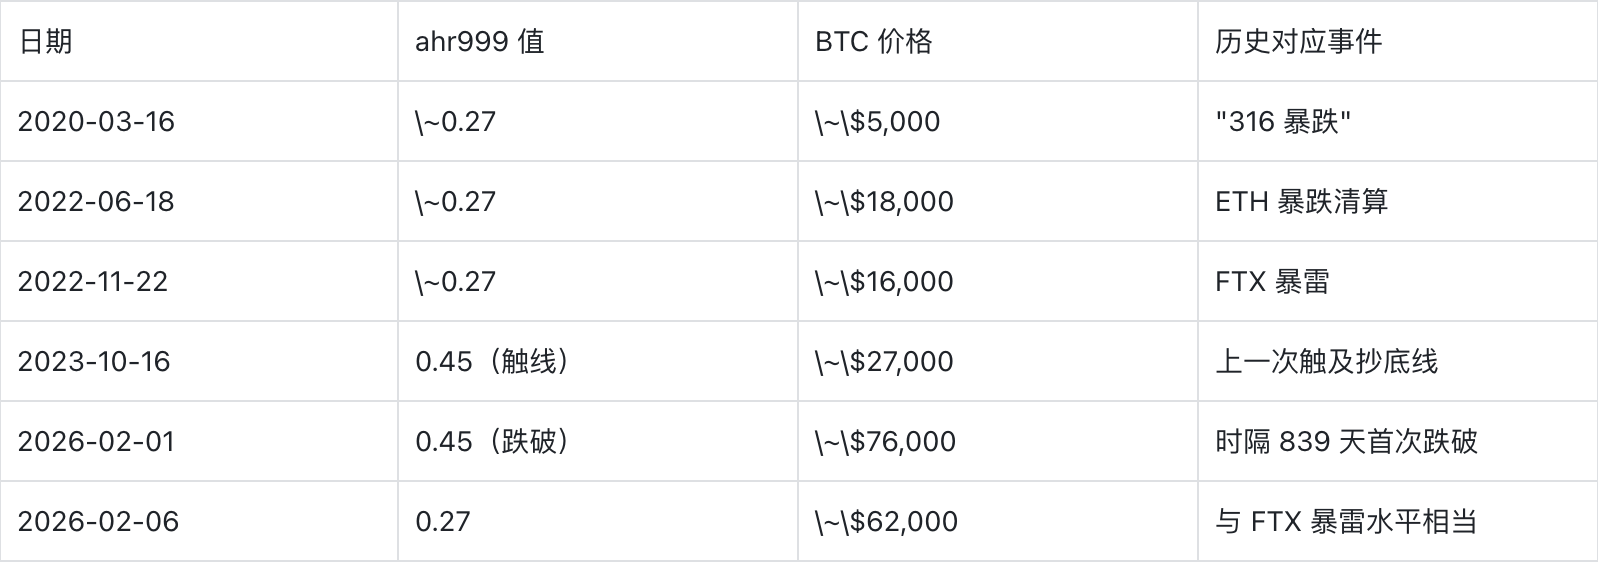
Since February 1, the Ahr999 indicator has maintained below 0.45 for nearly 50 days, whereas historically the number of days at 0.45 has only been 612 days, accounting for about 11% in total. On March 19, the Ahr999 hoarding indicator data was 0.37, indicating that it is still within the bottom-fishing zone, but it’s difficult to provide more long-term guiding information.
Failure Reason: The market has been in a state of excessive drop since the crash on October 11 last year, compounded by Trump's volatile policies, the Federal Reserve's interest rate cuts falling short of expectations, and international geopolitical turmoil. BTC's safe-haven attributes are greatly diminished; thus, after dropping below the previous $76,000 cost line of the largest BTC DAT listed company strategy, it still waits for more liquidity restoration, making this indicator gradually become the consolation index for 'long-term value investors.'
Indicator Three: SOPR, STH-SOPR Continuously Below 1, LTH-SOPR Continually Between 0.75 and 1
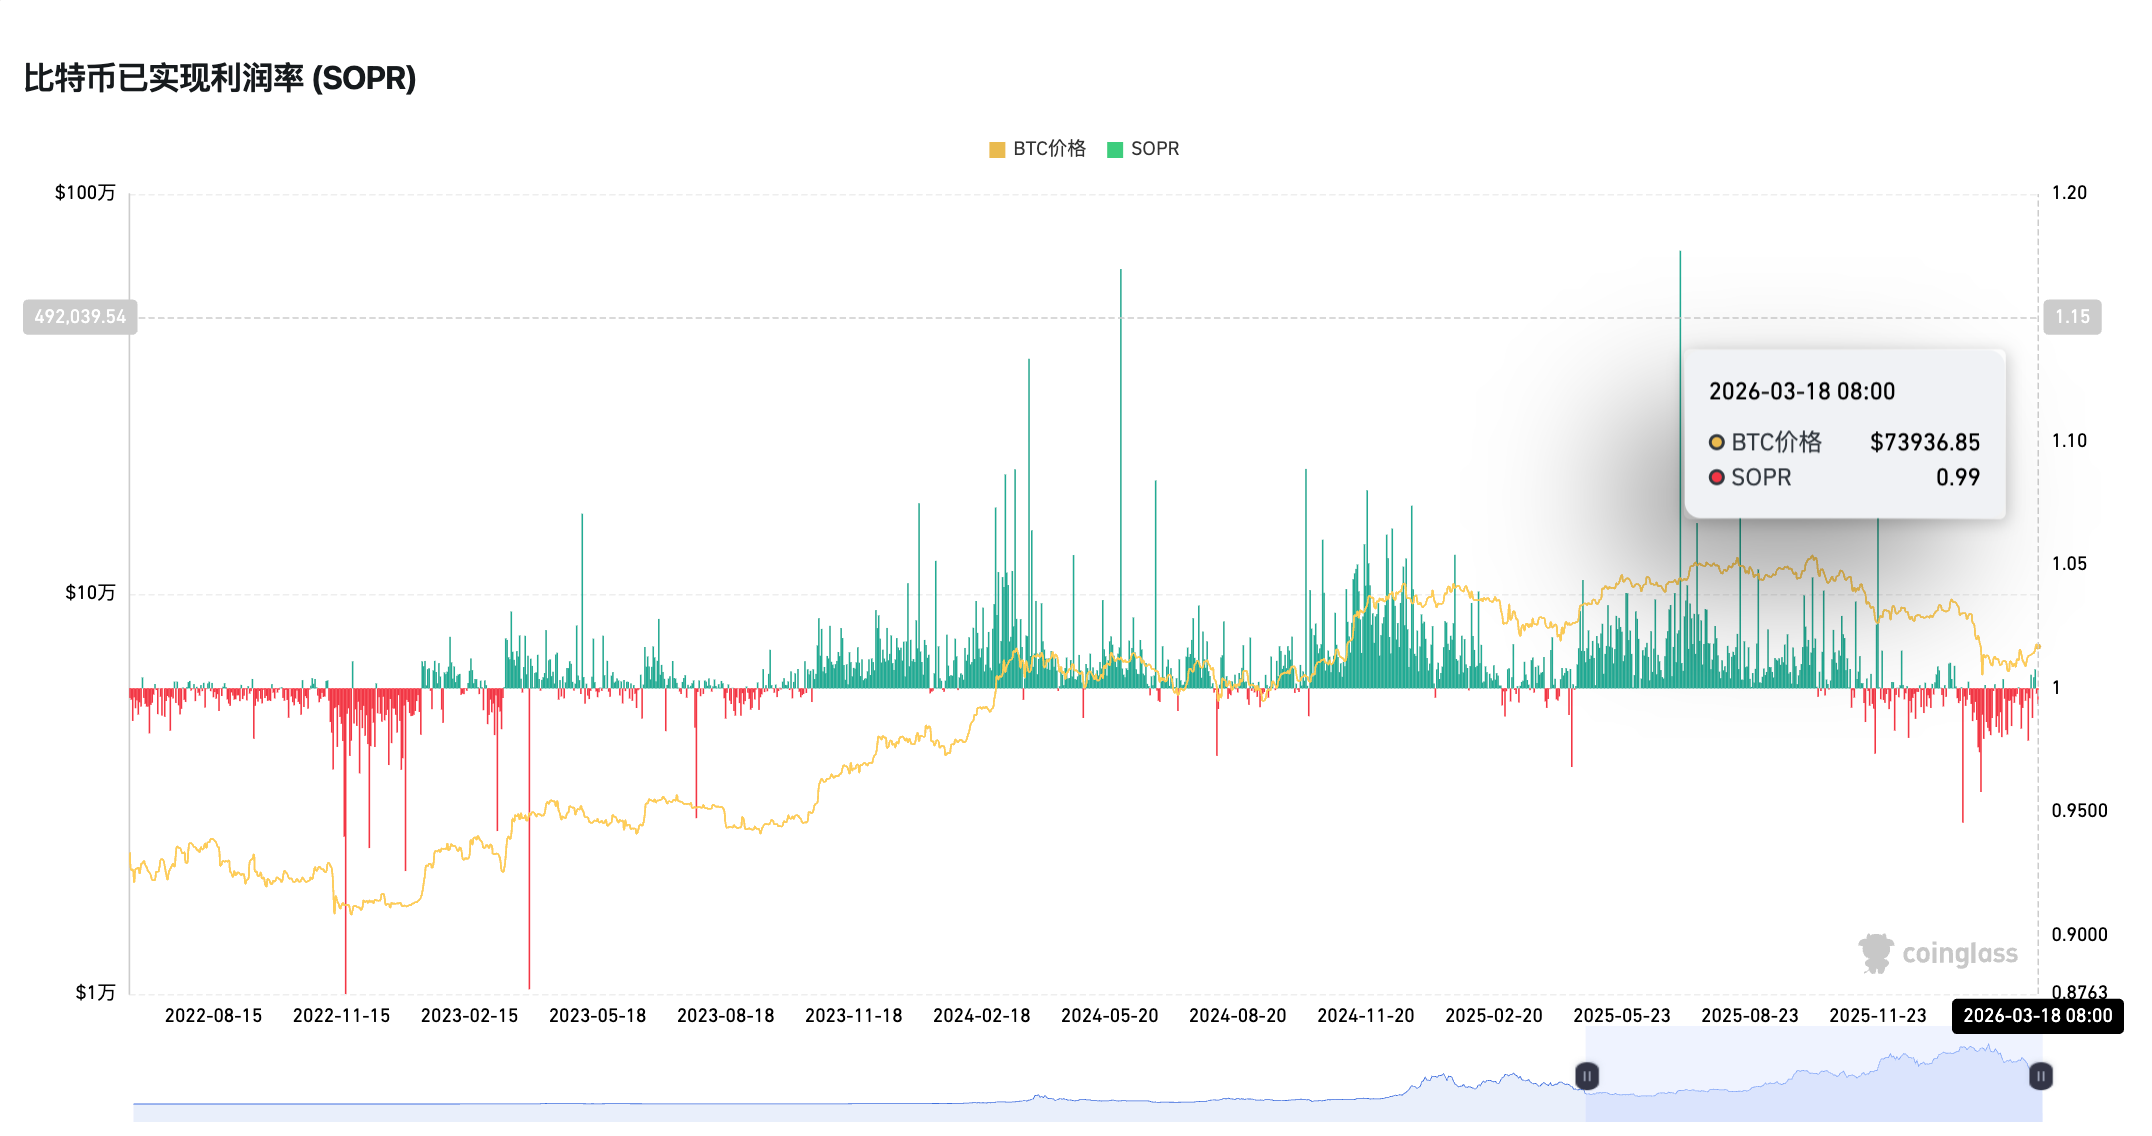
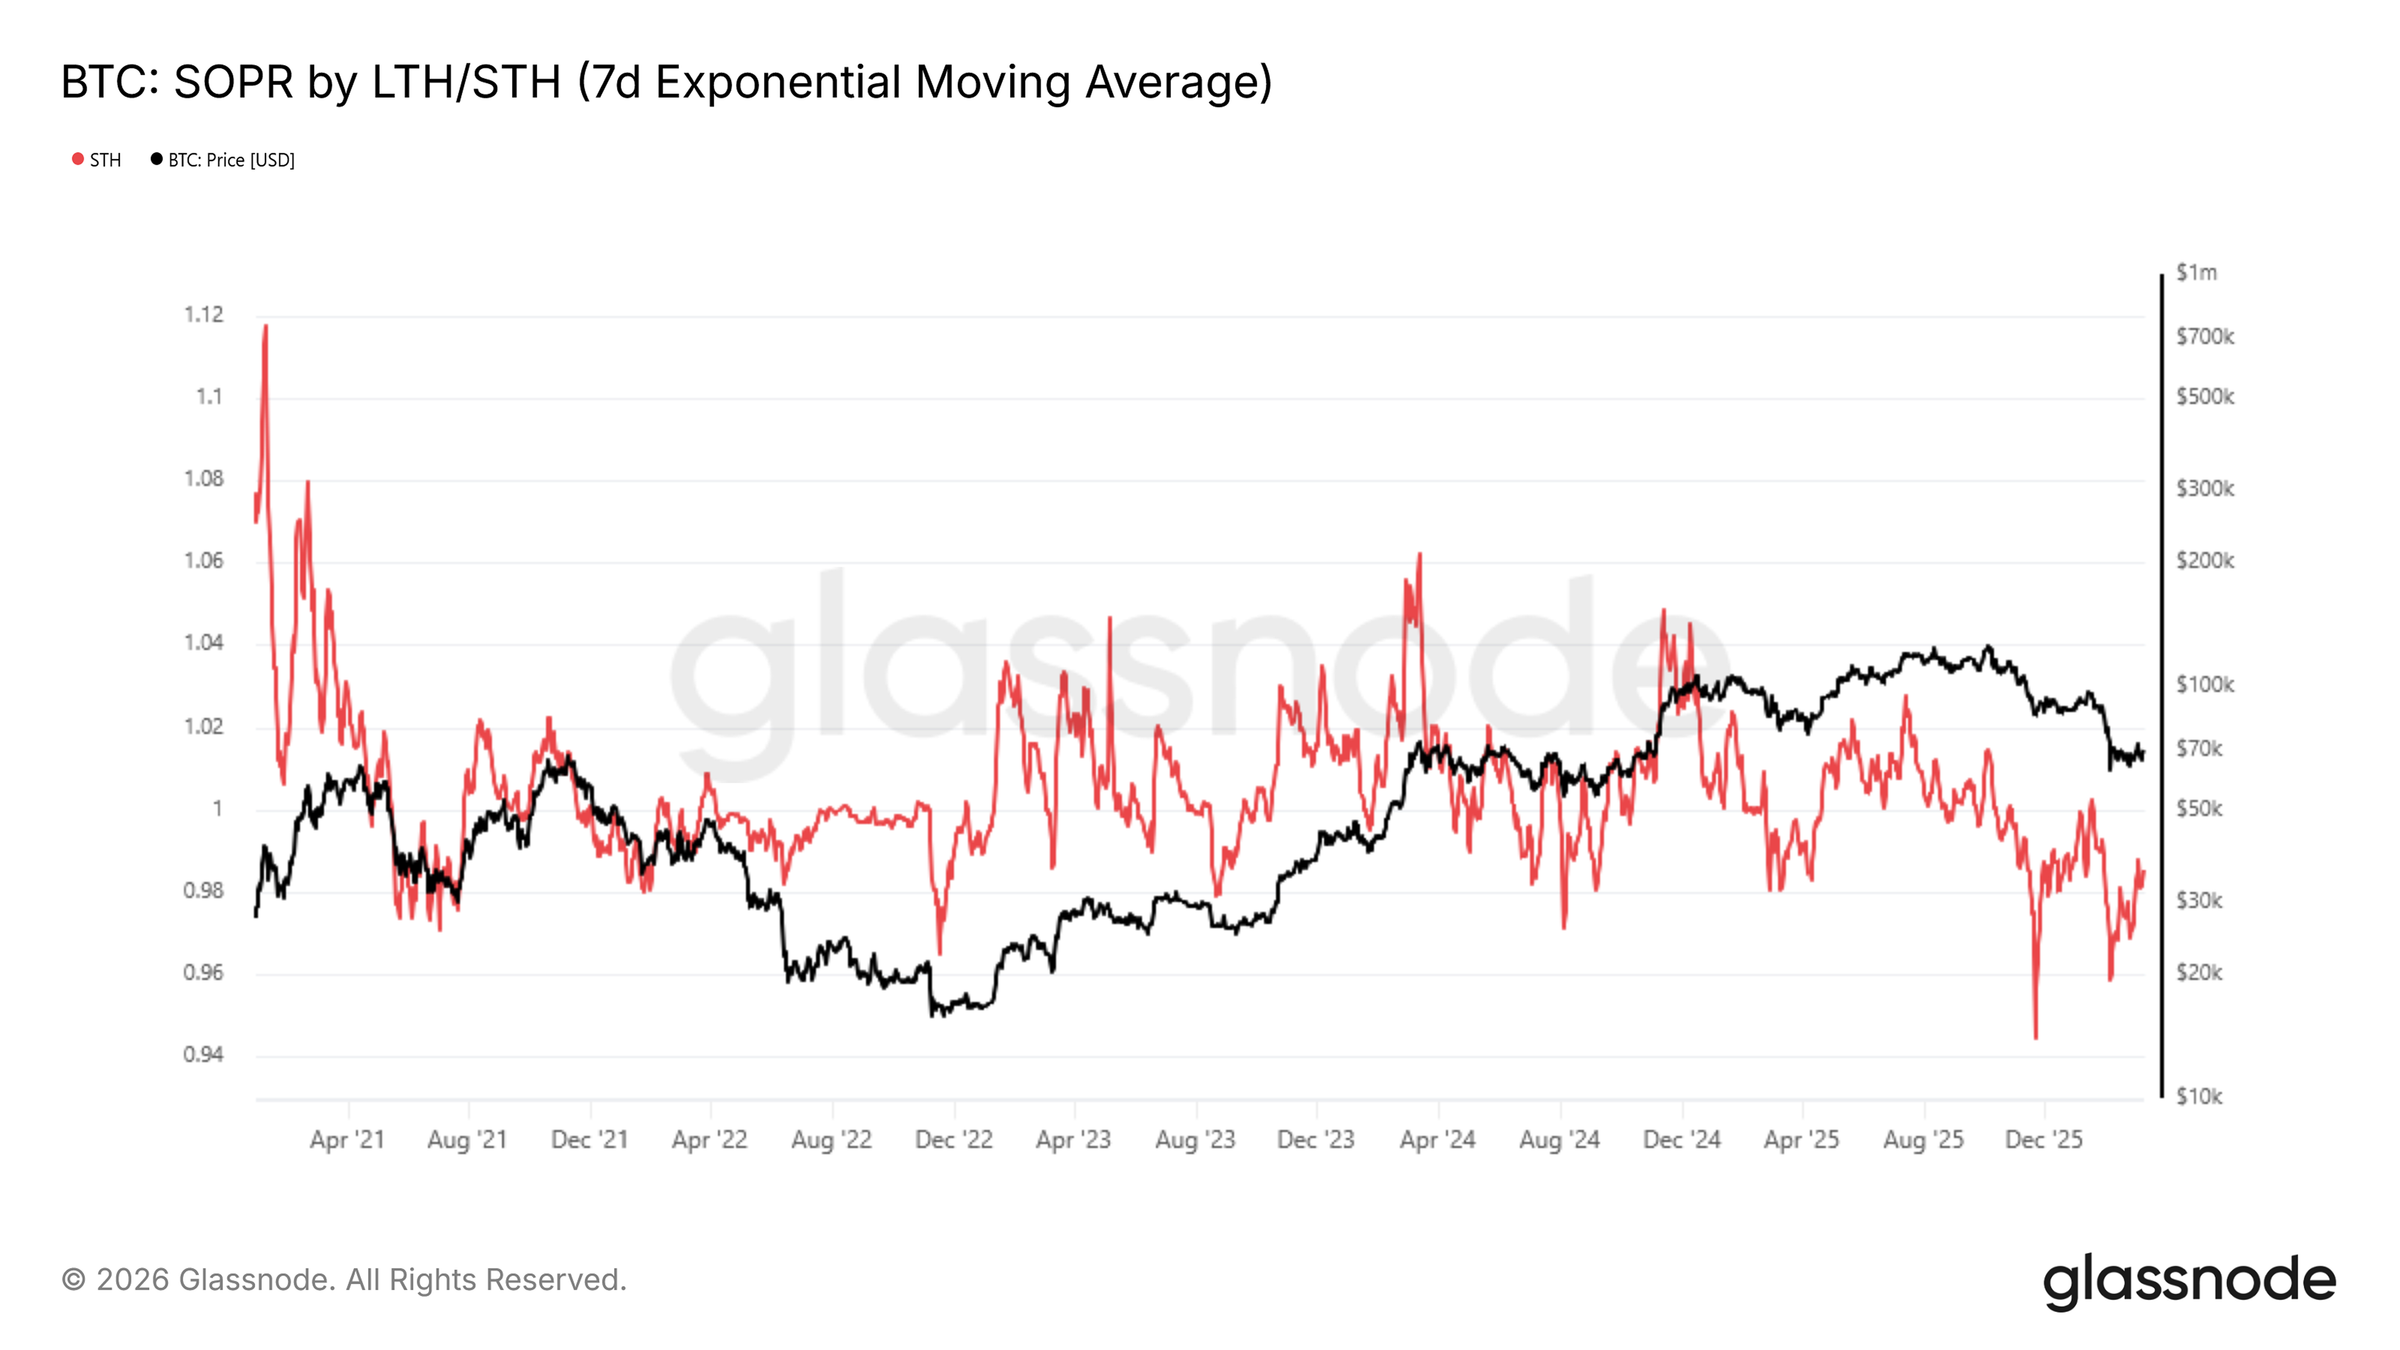
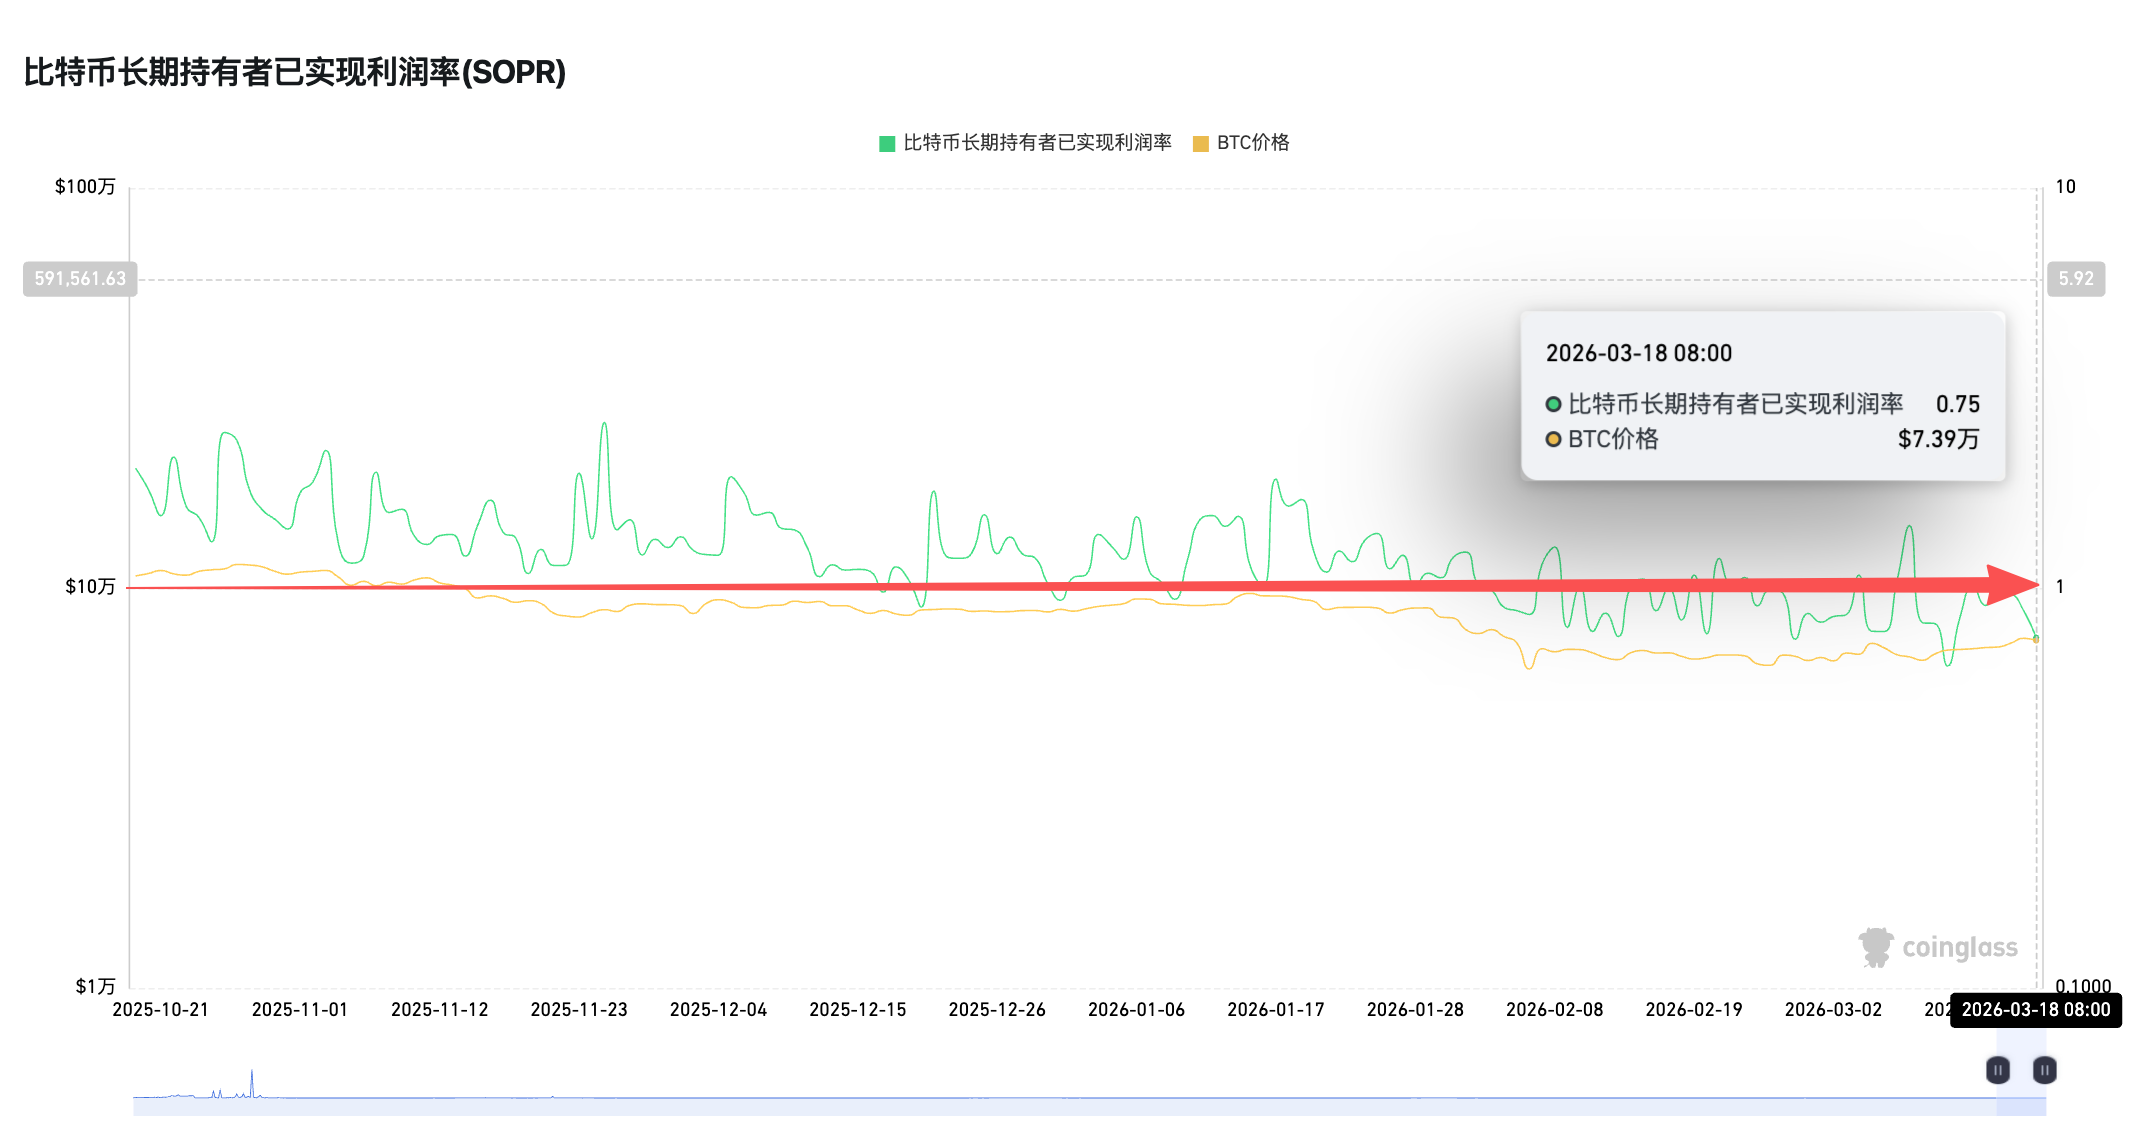
SOPR (Spent Output Profit Ratio) is typically used to measure the average profit/loss ratio of on-chain moving chips, with LTH-SOPR focusing on long-term holders with positions held for over 155 days. LTH-SOPR falling below 1 typically indicates that older chips have started to cut losses and sell, historically corresponding to deep bear market bottoms.
In February, Bitfinex released an analysis report stating that the adjusted SOPR (Spent Output Profit Ratio) has fallen to the range of 0.92-0.94, reflecting that most cryptocurrencies are transferring in a state of loss, and structural pressure persists.
On March 14, Glassnode's weekly report also noted that the 7-day moving average of the STH-SOPR was at 0.985, remaining below 1 for an extended period since October 2025—this is a typical characteristic of the bear market structure and a significant feature of the bear market cycle. Meanwhile, the net position changes of LTH indicate that older chips are still decreasing, but at a significantly slowed pace, shifting from aggressive distribution in Q3/Q4 2025 to a more moderate profit-taking pattern.
Failure Performance: A drop without the surrender of older chips does not constitute a traditional cycle bottom. The sustained low STH-SOPR below 1 confirms the bear market, but when the turning point of LTH-SOPR arrives is the true leading indicator of the bottom.
Indicator Four: BTC Mayer Multiple, Below 0.8 Has Lasted Nearly 50 Days
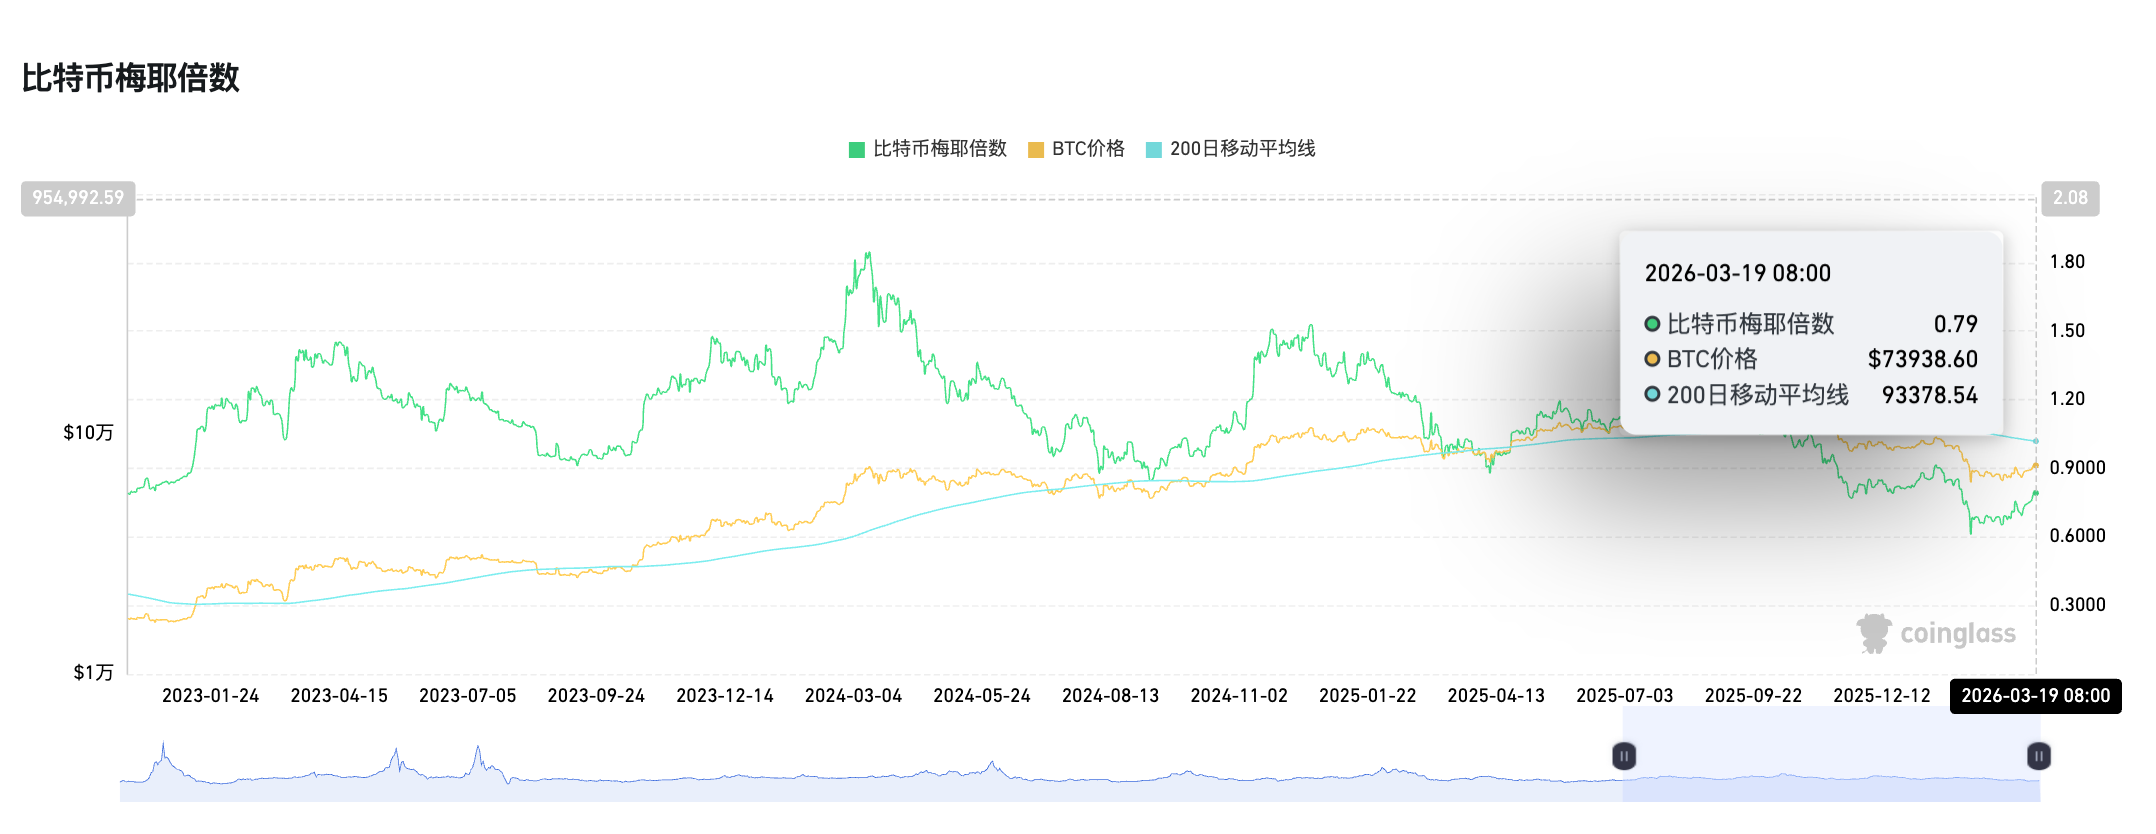
As an industry indicator derived solely from the current price of BTC compared to the 200-day moving average, the BTC Mayer Multiple is similar to the 9 God Index and has remained below 0.8 for nearly 50 days. Historically, 0.8 is usually the zone of historically underestimated prices. Therefore, although this index is based solely on simple price averages and does not rely on on-chain transaction data, making it relatively less influenced by institutional factors, it is still hard to form a sustainable bottom-fishing indicator.
Three Major Indicators May Reveal Bear Market Bottom-Fishing Zones: CVDD Iron Bottom, NUPL Negative Values, Stablecoin Exchange Inflows
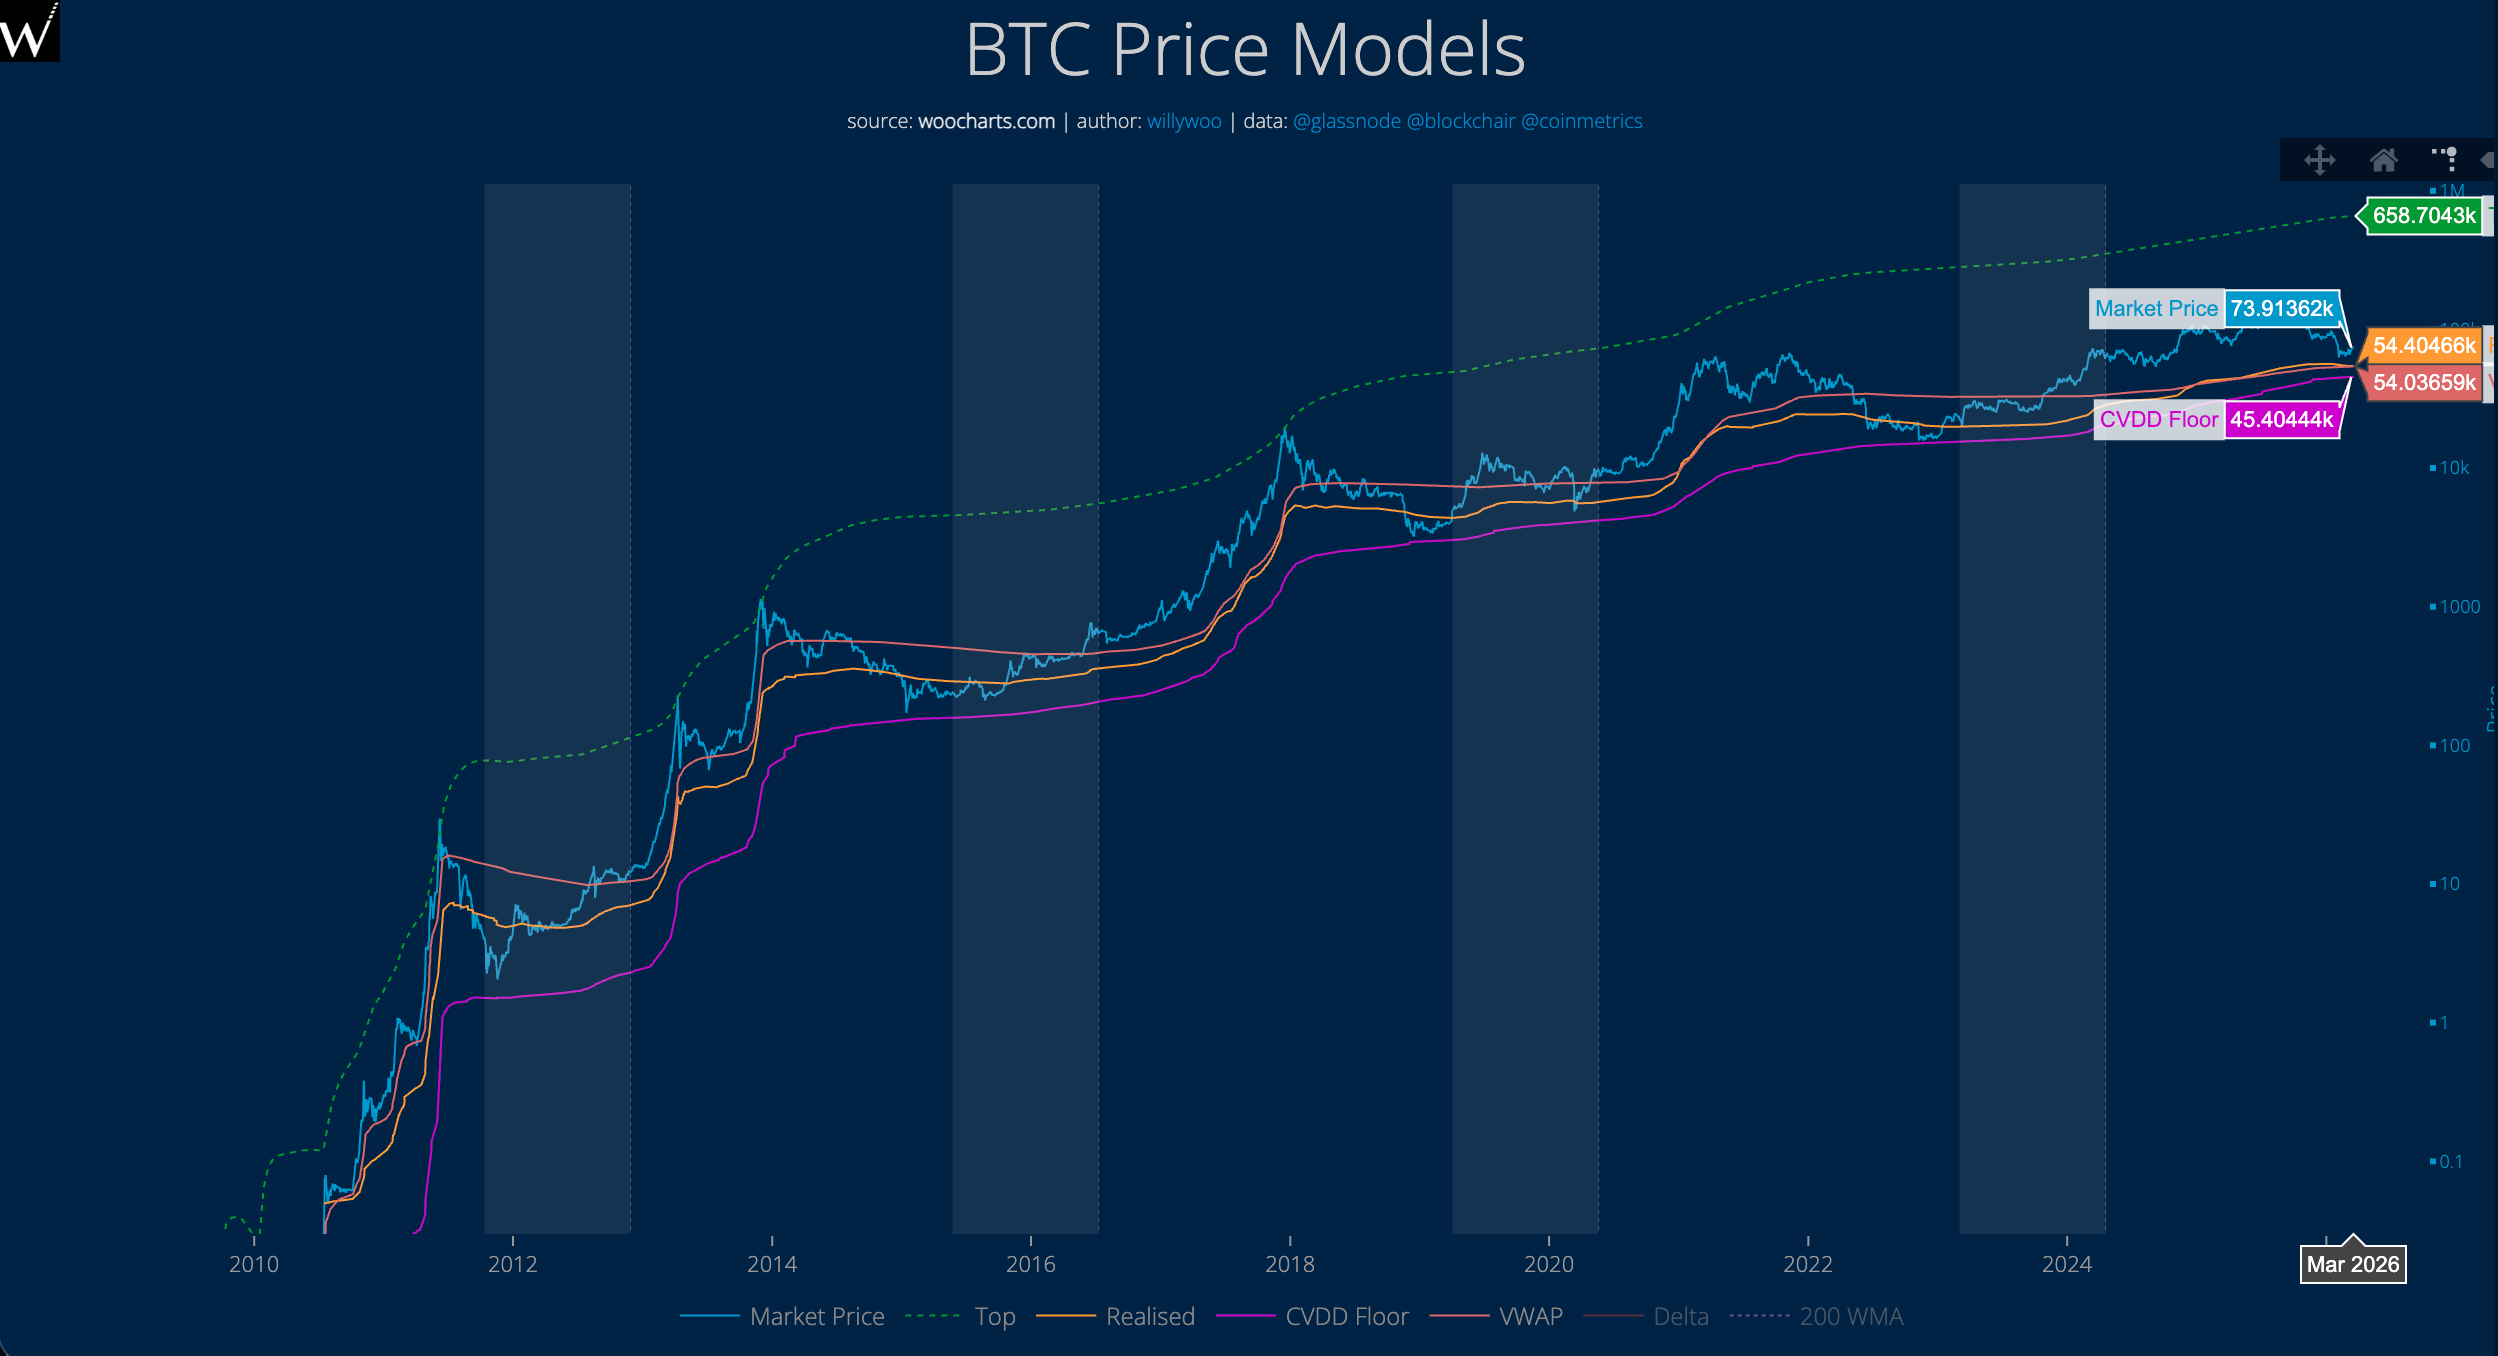
CVDD (Cumulative Value Days Destroyed): Analyst's Personal Iron Bottom Model
This indicator was developed by crypto analyst Willy Woo to track BTC's cumulative holding weight across different price ranges, constructing a "historical iron bottom" curve.
It is worth noting that this curve has approached BTC market prices twice, in December 2018 and November 2022, but has never been breached to date.
Currently, the CVDD model shows that the iron bottom for BTC is around $45,000.
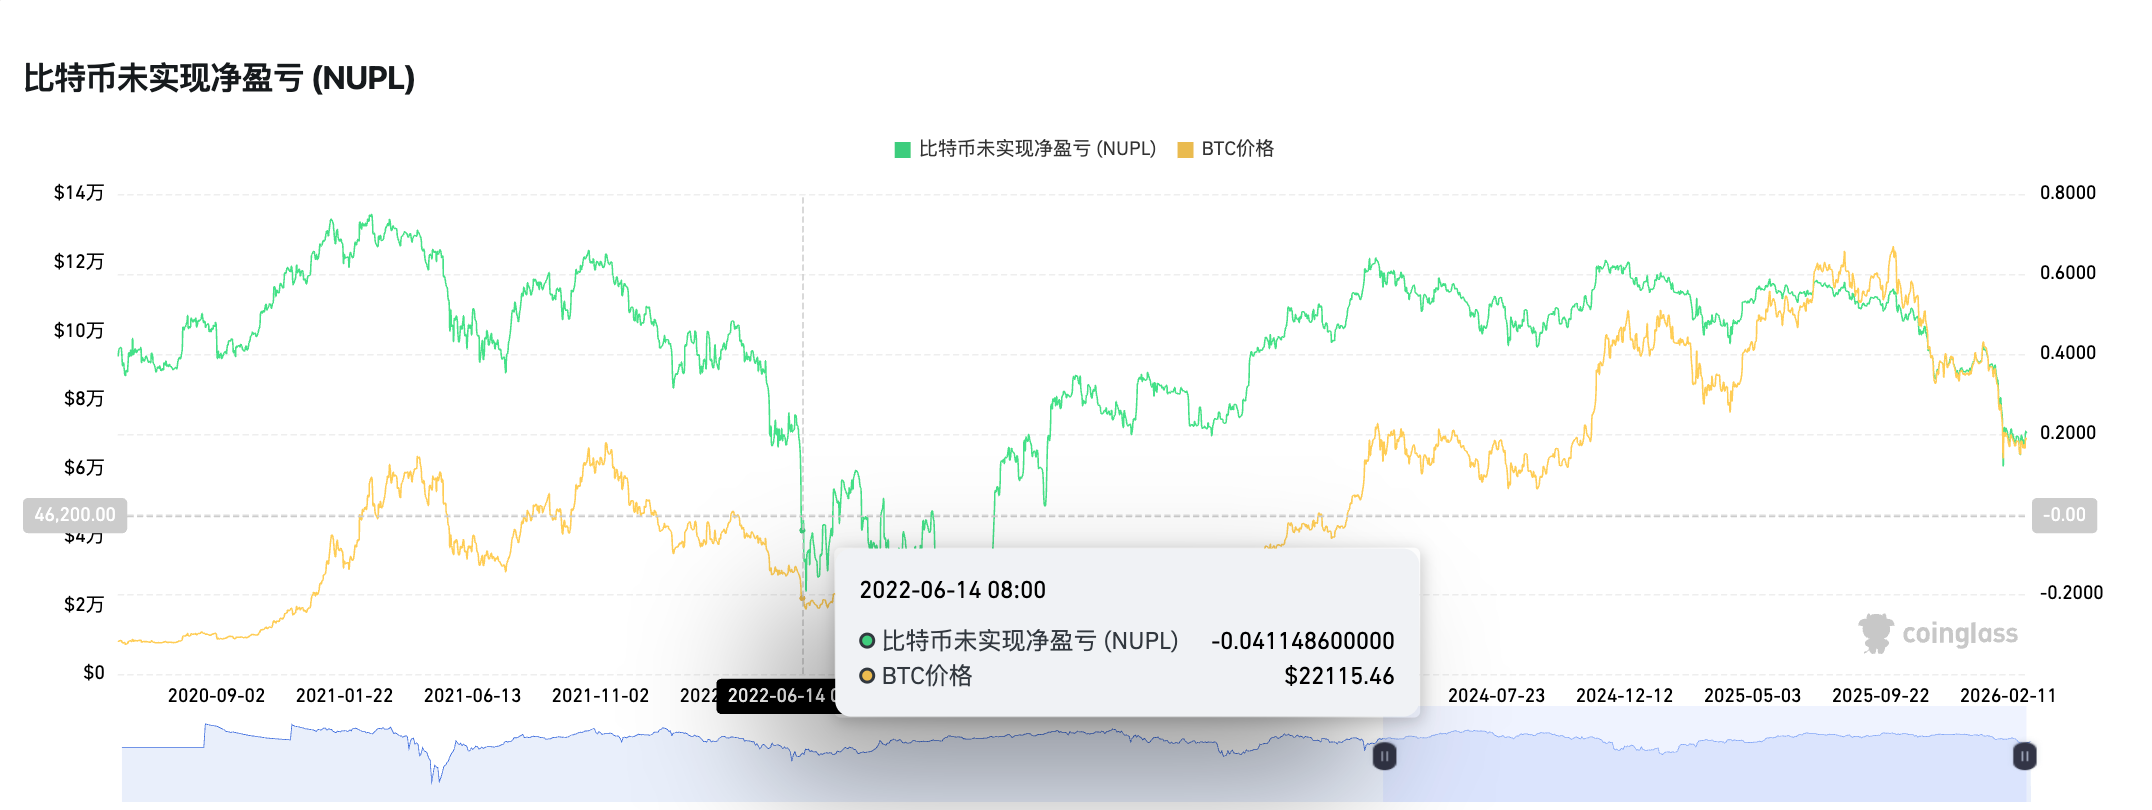
NUPL (Net Unrealized Profit/Loss): Overall Net Value of BTC
This indicator is mainly used to measure the net value of unrealized profits and losses across the entire network, with the approximate judgment criteria as follows:
High NUPL (>50%): Greed-driven peak; ideal choice for profit-taking.
Low NUPL (0%): Fear or capitulation; potential bottom.
It is worth mentioning that the NUPL indicator last fell to negative values between June 2022 and January 2023.
Currently, the NUPL indicator remains around 0.2.
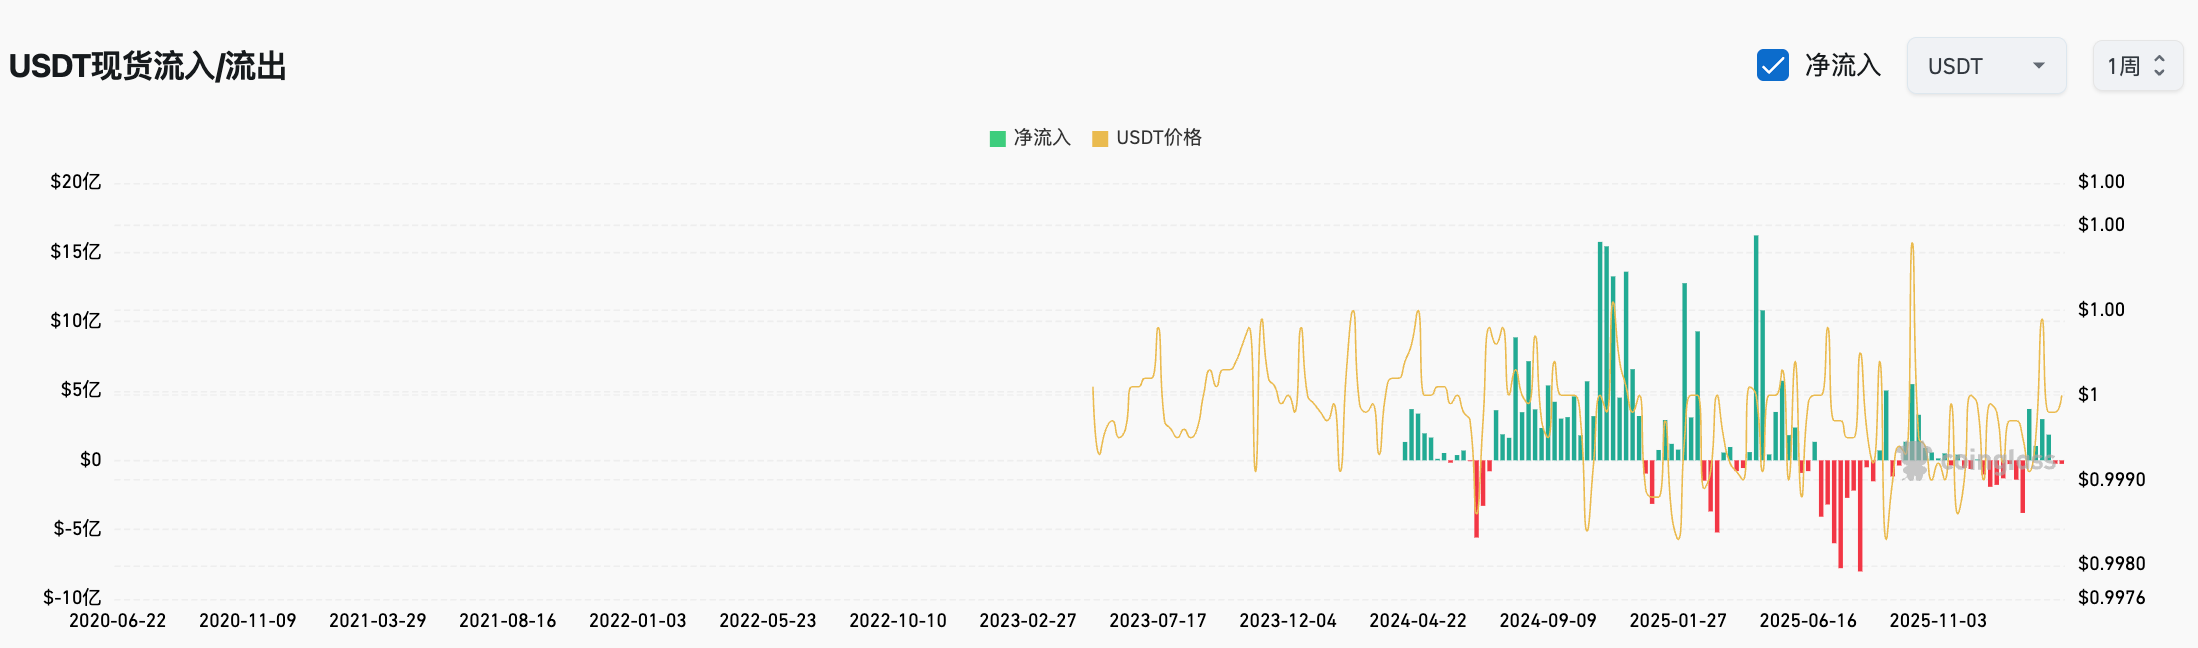
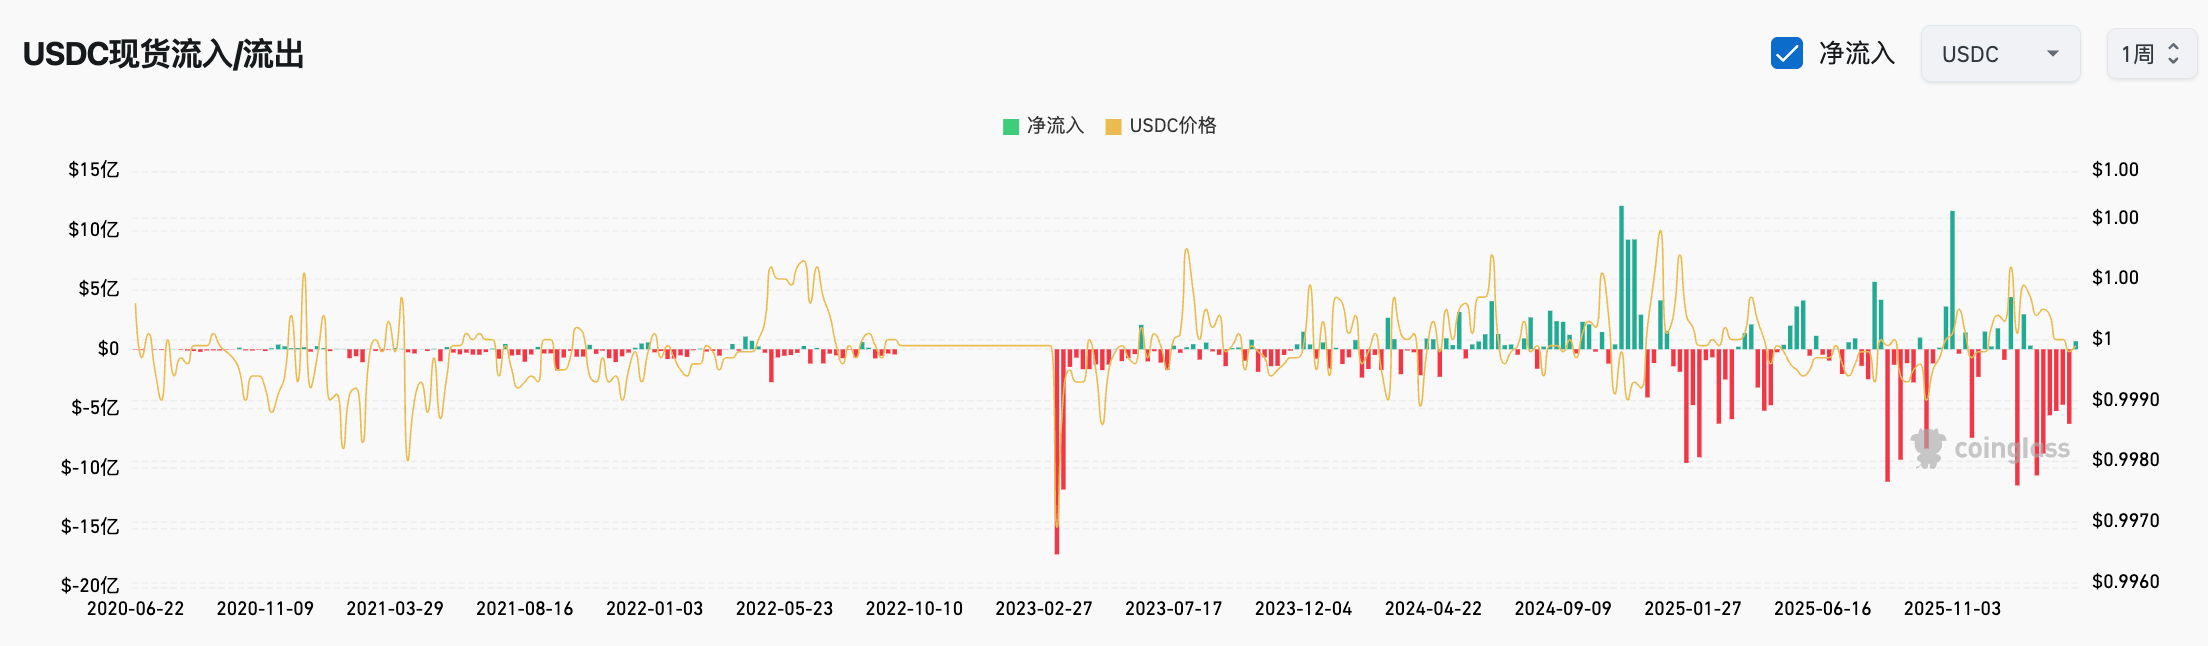
Stablecoin Exchange Netflow: Stablecoin Exchange Net Inflows
This indicator is primarily used to determine whether stablecoins are flowing back to exchanges, a precursor signal indicating potential market buying pressure. Historically, a sustained increase in stablecoin net inflows often occurs 2-4 weeks before a substantial rebound in BTC prices.
The logic behind the effectiveness of this indicator is that price rebounds without the return of stablecoins are merely leverage-driven technical bounces, which have very low sustainability.
Currently, USDT and USDC, which occupy about 80% of the stablecoin market, are still continuously bleeding, indicating that there is still a significant distance to BTC's bottom.
Conclusion: Buy When No One is Paying Attention, Sell When the Crowd is Roaring
In conclusion, we must emphasize that all the indicators mentioned above are for reference only; specific trading and investment strategies vary due to individual and institutional differences in risk preferences, fund volume, and holding periods.
However, compared to bottom-fishing indicators, perhaps escape indicators in the crypto industry are more flexible—just like the recent surges in gold and silver that drew widespread attention, once the discussion around BTC spreads to people around you, whether it's the middle-aged lady shopping on the subway or Tony the barber, when they start asking you about BTC, crypto, or cryptocurrency investments, perhaps timely selling will be the only best choice.
May each of us reach that day and experience a "personal great retreat."
免责声明:本文章仅代表作者个人观点,不代表本平台的立场和观点。本文章仅供信息分享,不构成对任何人的任何投资建议。用户与作者之间的任何争议,与本平台无关。如网页中刊载的文章或图片涉及侵权,请提供相关的权利证明和身份证明发送邮件到support@aicoin.com,本平台相关工作人员将会进行核查。


