The same question, is Ma Ji still around? It’s simply a counter-indicator king, infinite liquidation, it really makes me laugh to death!
The reversal is a real trend change, and the inducement is the major player pulling the market to attract everyone in, only to smash down the market and harvest. Everyone has different views, there is no absolute right or wrong.
Today, we will focus on three core issues:
First, why did BTC suddenly rebound recently?
Second, what phase is the market currently in?
Third, has the main capital recently been buying real gold and silver, or is it just a setup to induce buying?
To judge the authenticity of the market, we first need to clarify: what is the core reason for this wave of increase?
The biggest macro variable recently is the escalation of the US-Iran conflict.
Initially, the market's reaction was very direct: the stock market + cryptocurrency market all fell, US stocks, South Korean stocks, and Japanese stocks collectively plunged, and the South Korean KOSPI index even experienced two circuit breaks, with panic sentiment at its peak.
Then it entered the second phase: funds began to look for safe-haven assets again, which we call alternative safe havens.
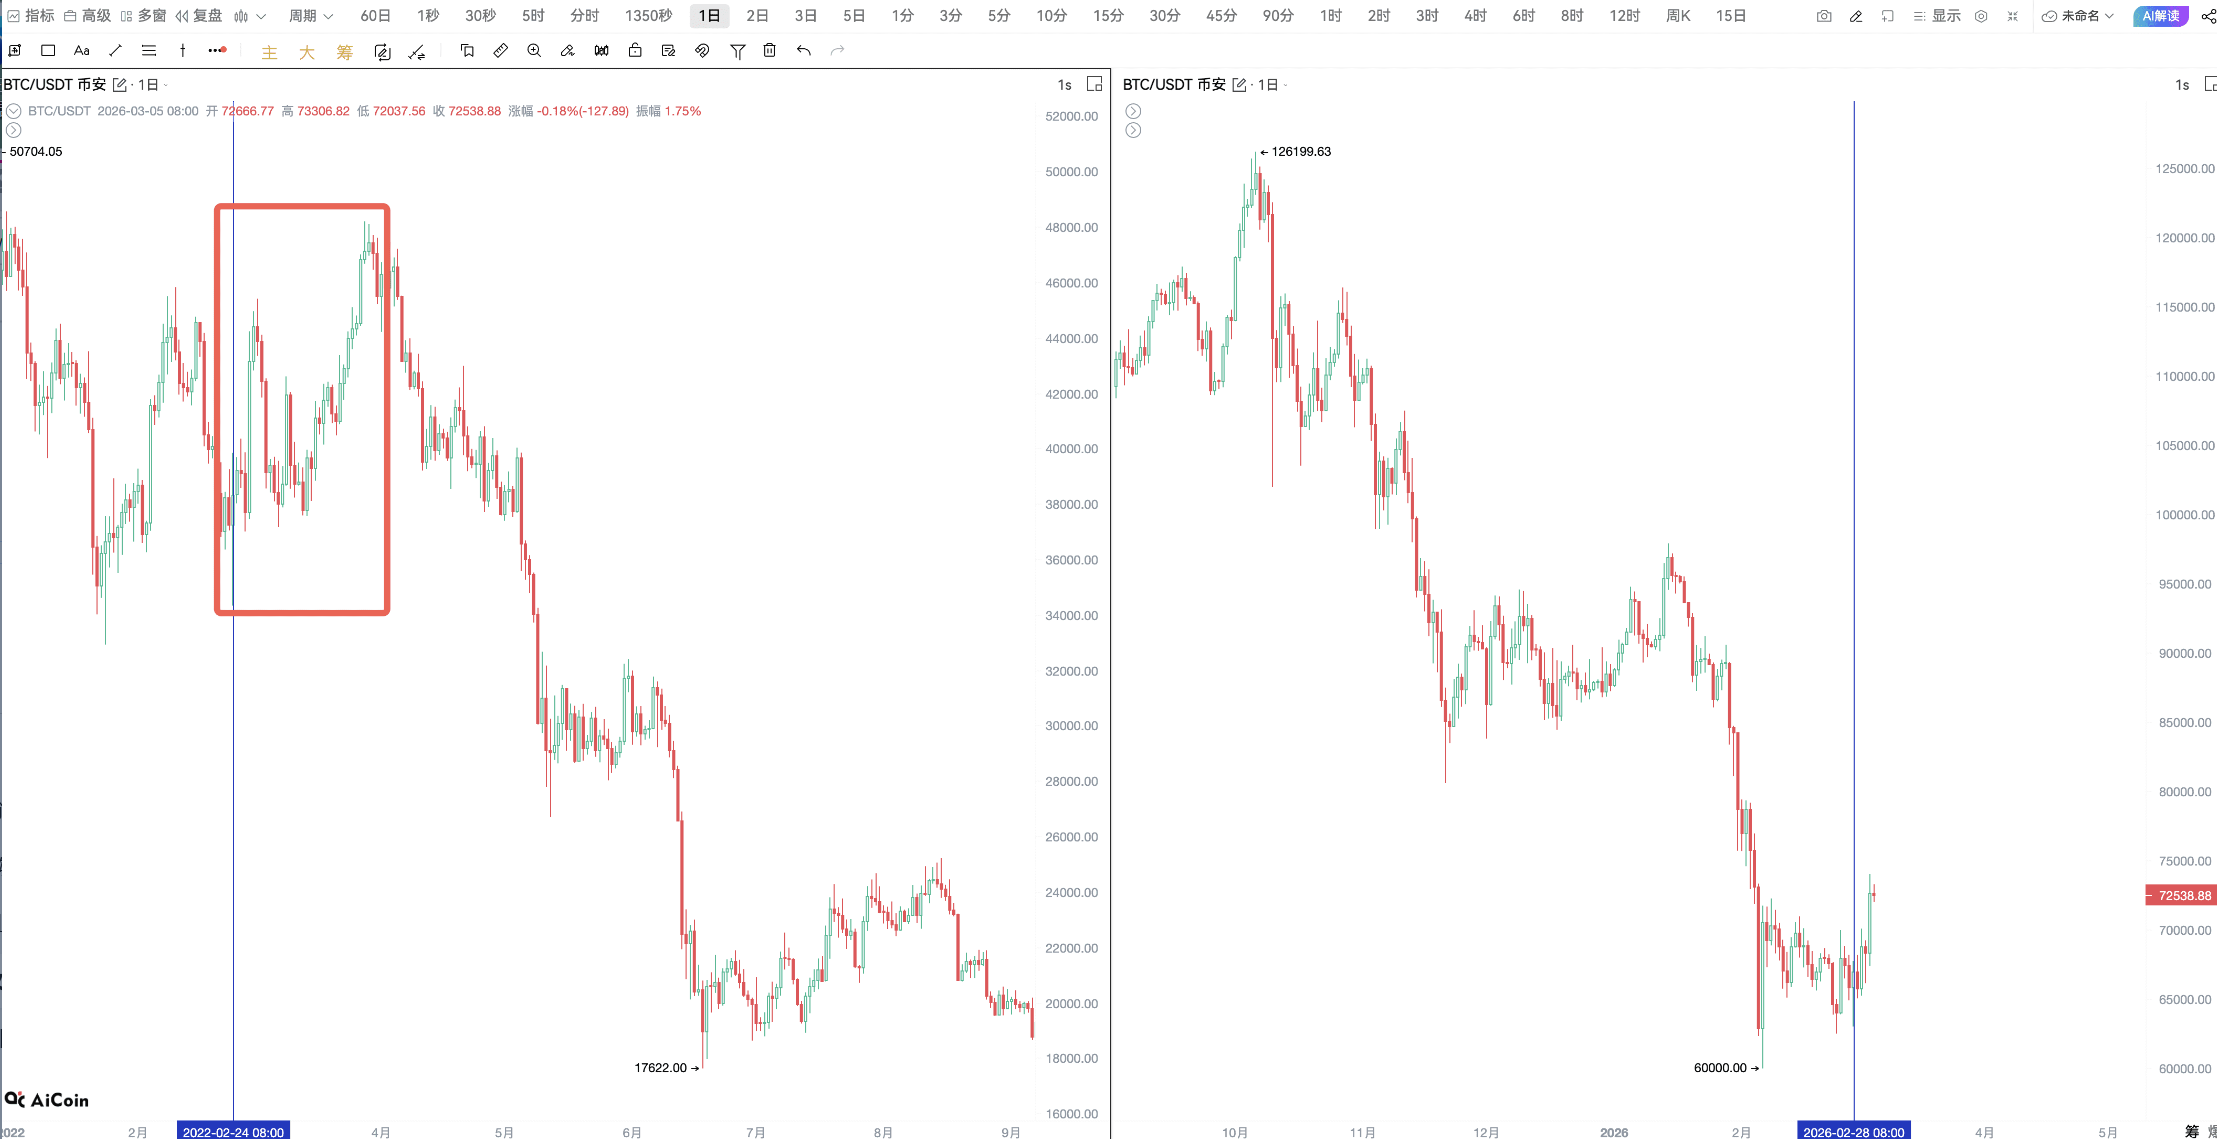
After the panic sentiment was released, some funds began to reallocate into BTC, this trend is almost identical to the outbreak of the Russia-Ukraine conflict in 2022 — first a sharp drop, then a rebound.
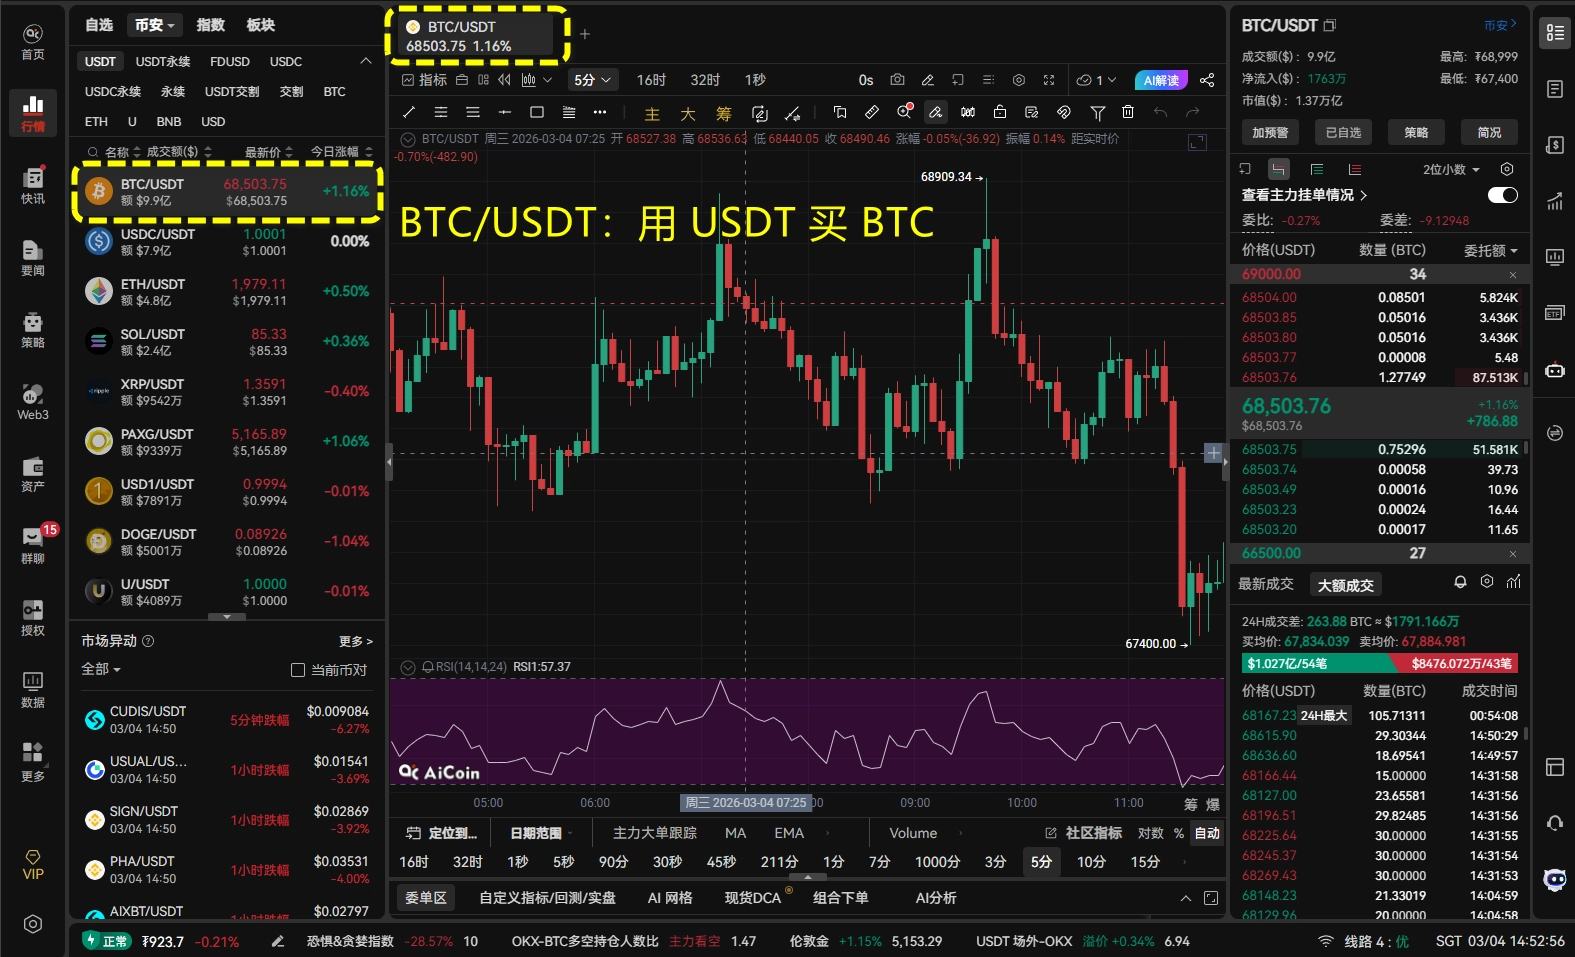
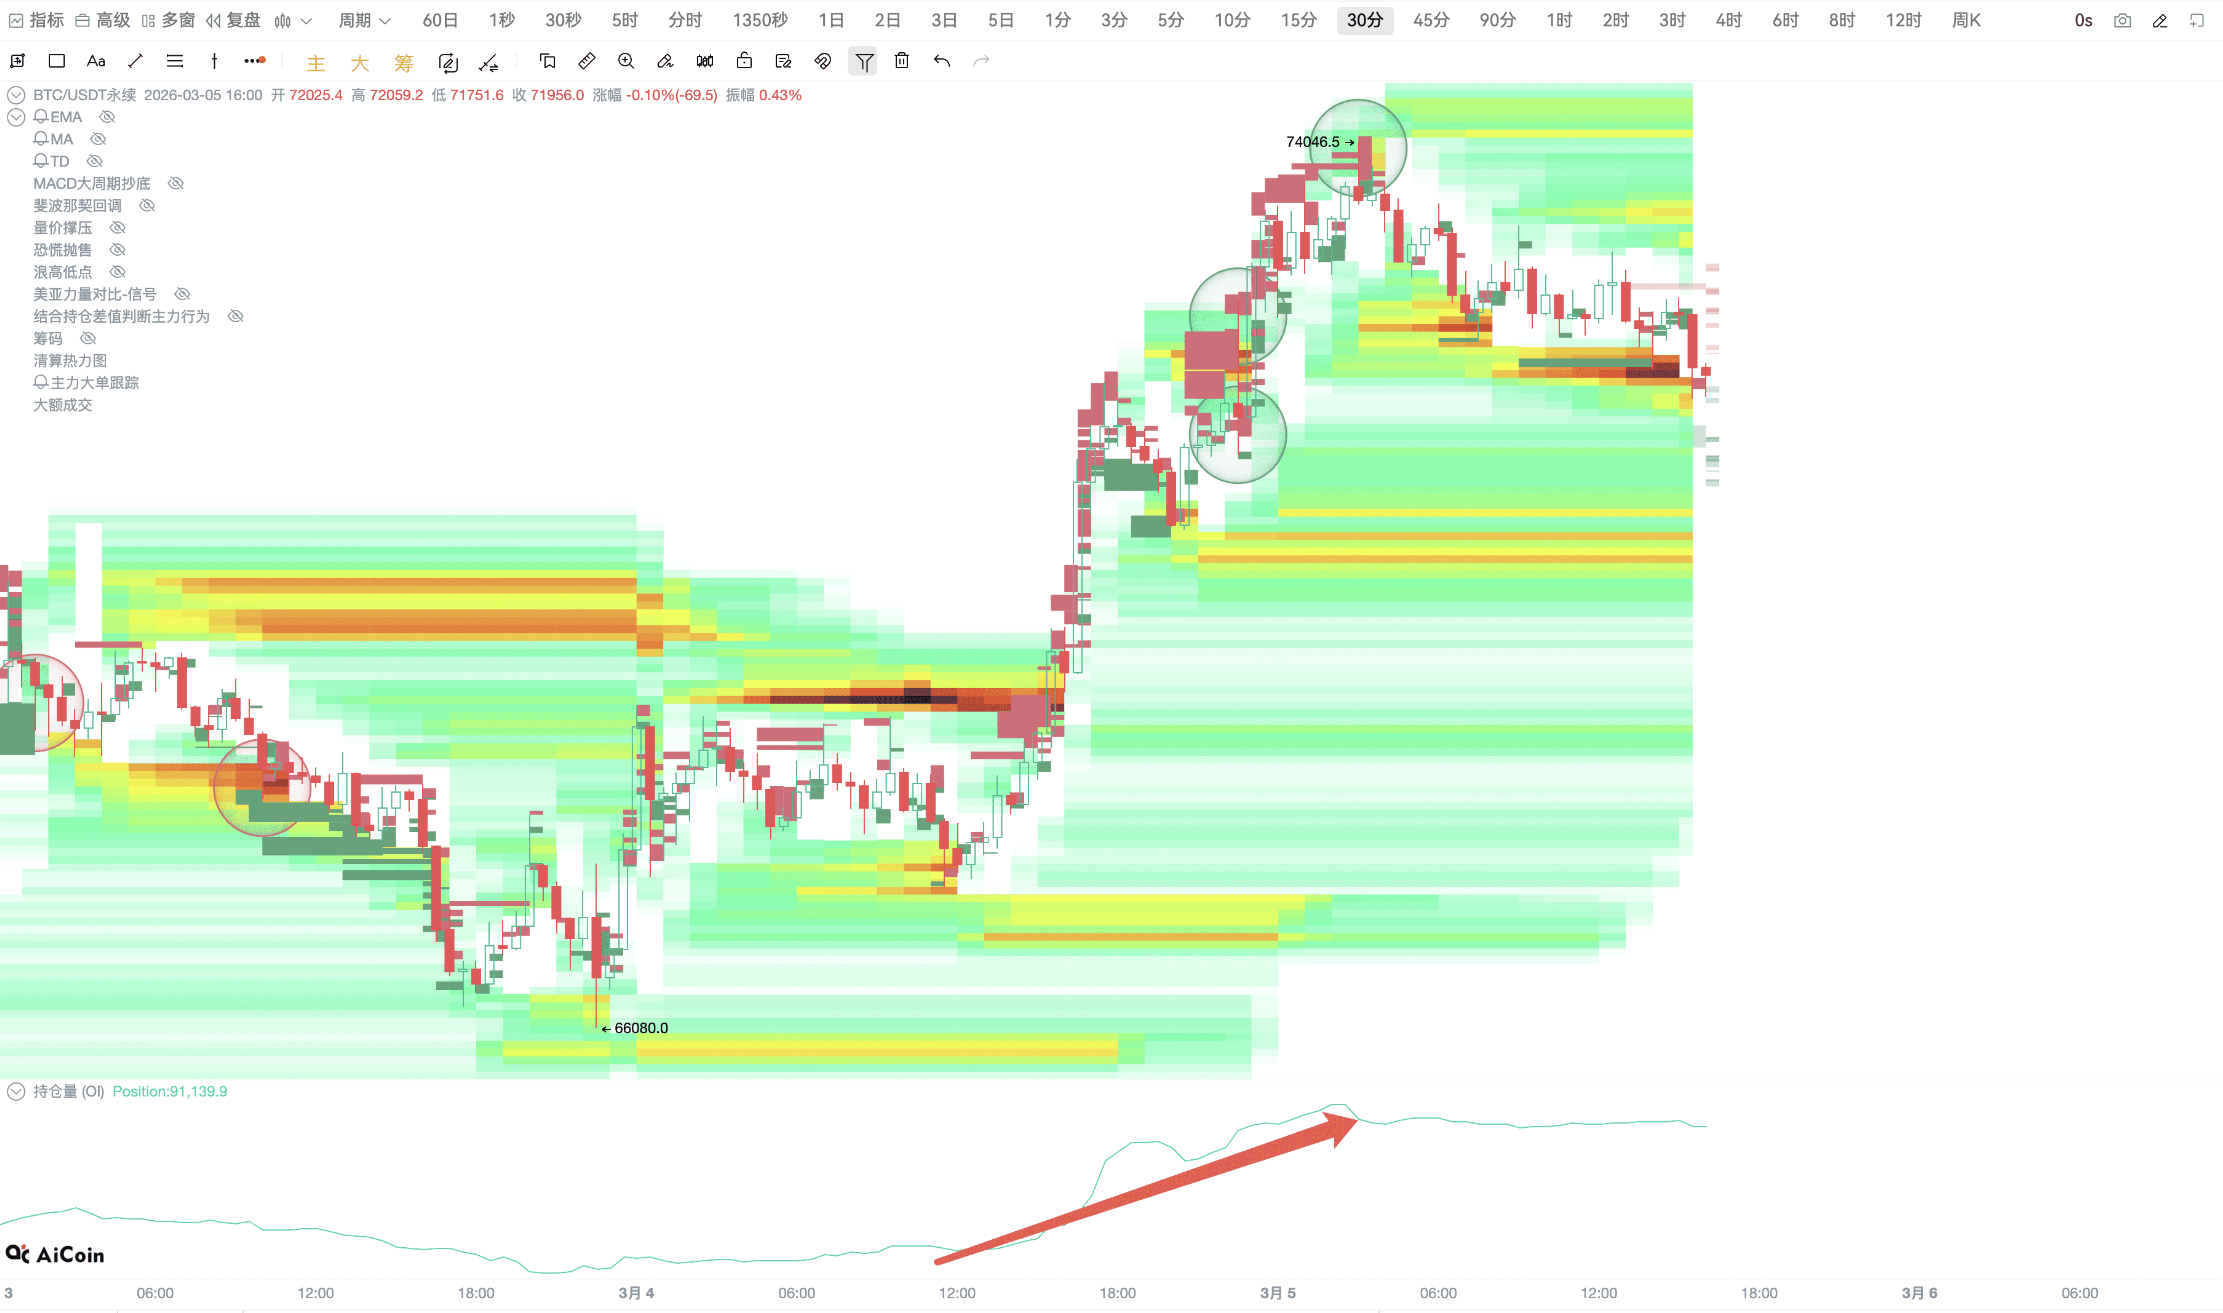
Can everyone see the chart I posted? This wave of rebound has a key characteristic: the trading volume has increased significantly, and the changes in open interest are very obvious, it is truly real capital entering the market, not a fictitious price increase to attract buyers.
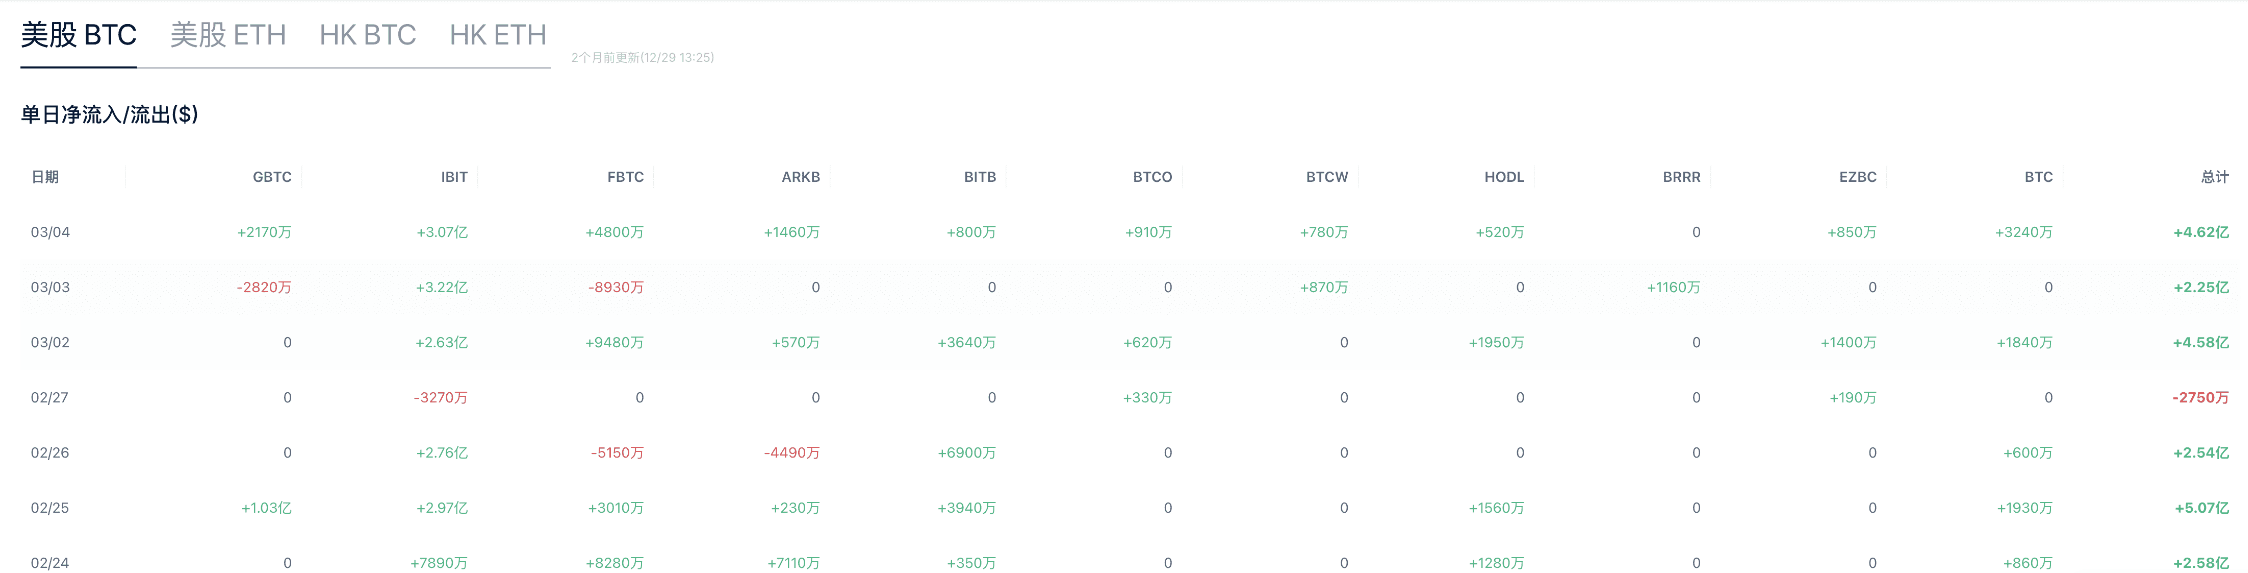
Also looking at the ETF fund flows, you can clearly see the funds are entering the market.
In fact, the market rule is like this: When sentiment is extremely panicky, a rebound is more likely to occur, because the bears who should exit have basically all been released, and the selling pressure is completely cleared.
Here I must remind everyone: Rebound ≠ Reversal, these two are not the same thing!
So next, we need to look at the more core elements: market structure.
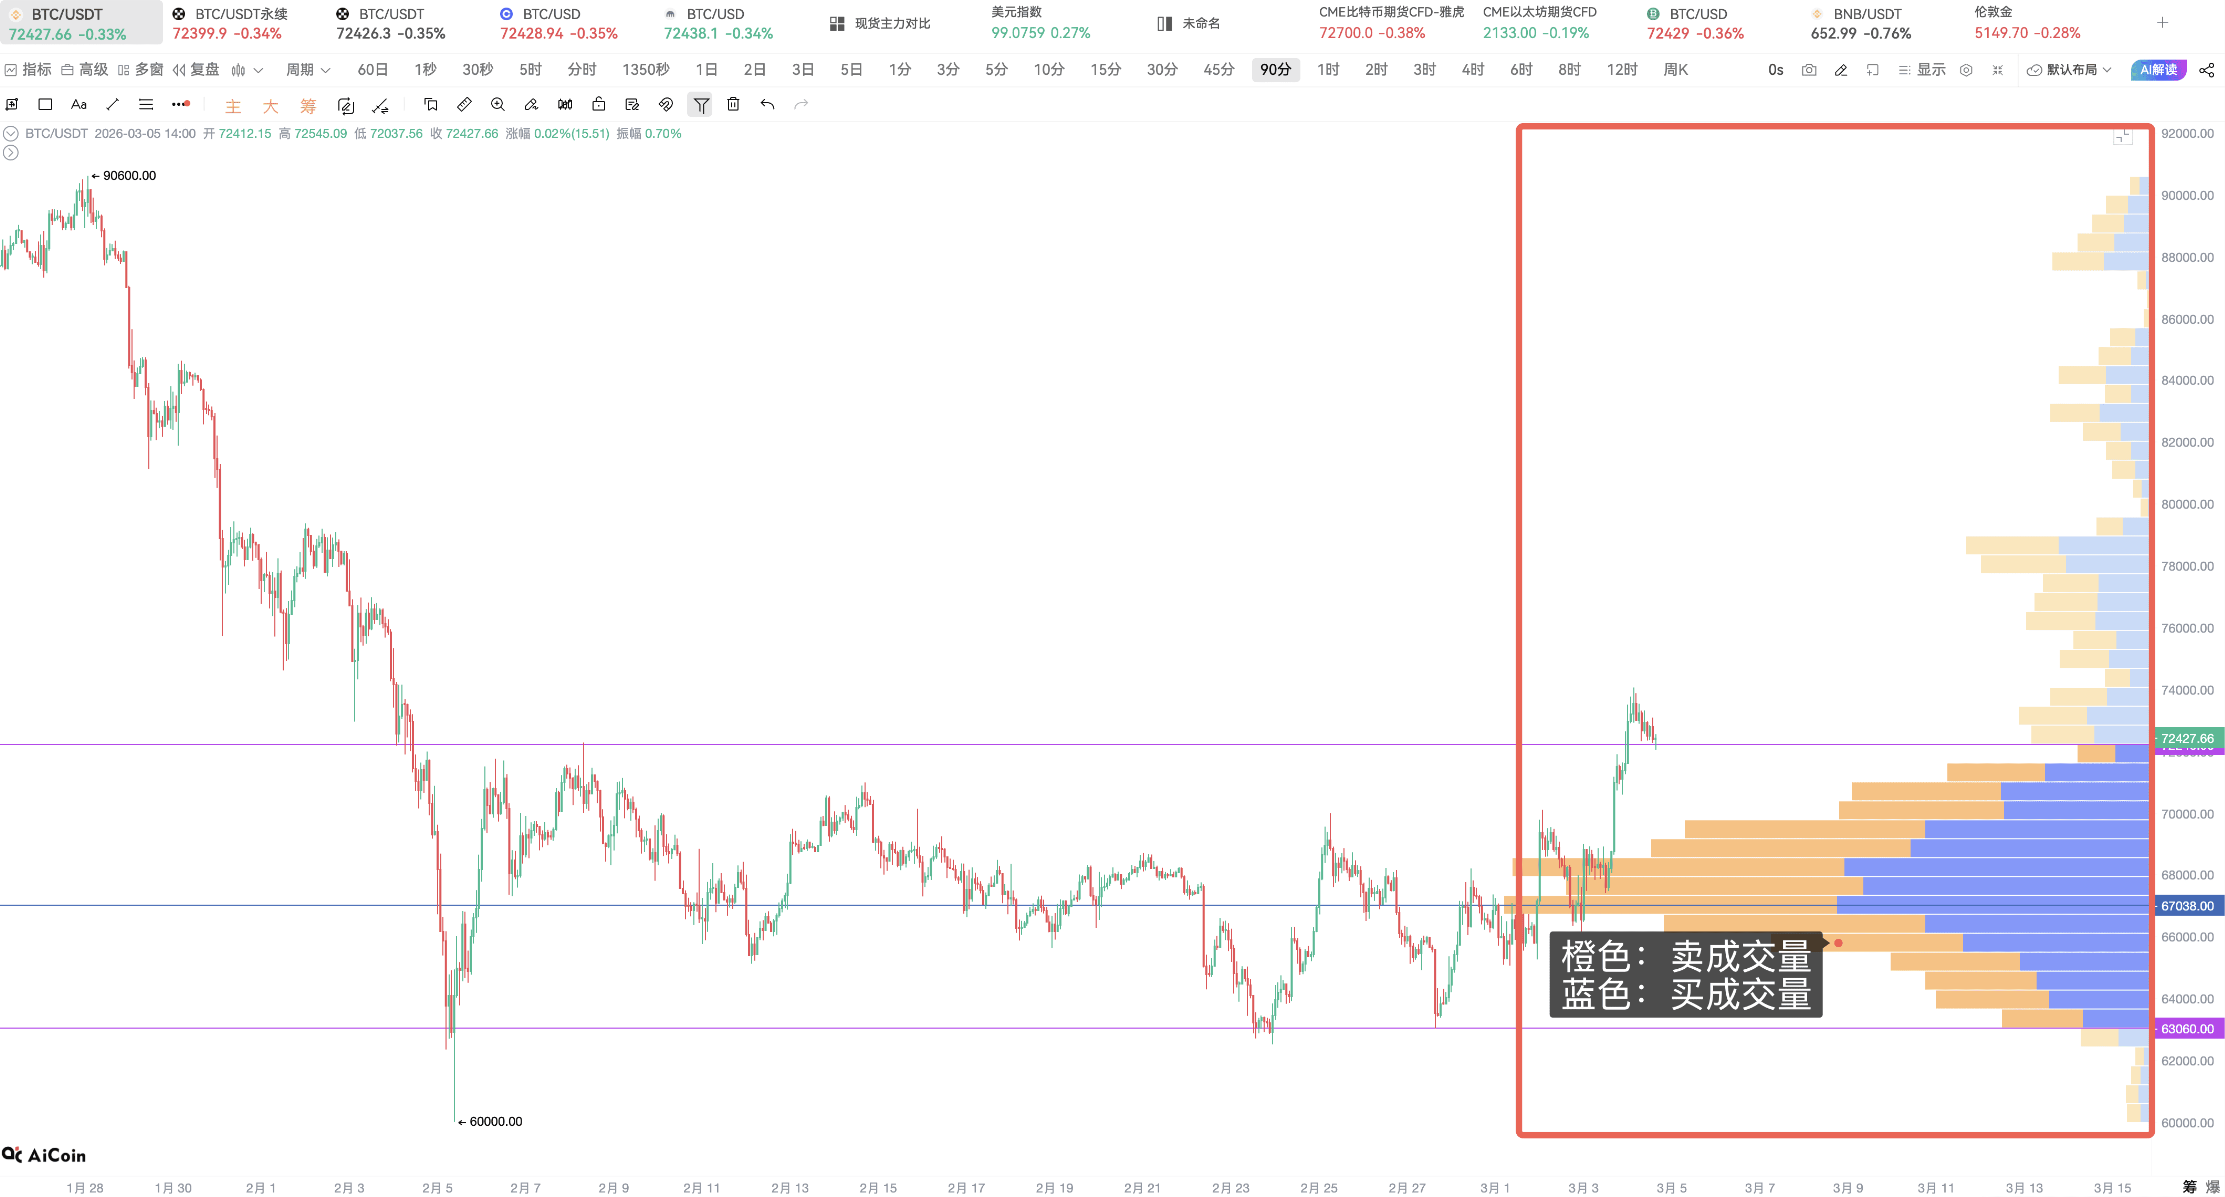
From a structural perspective, BTC is in a very clear state, currently in the range-bound fluctuation phase.
The current main fluctuation range of the market is approximately 63000 — 73000, which is a typical wide fluctuation trend.
This phase is crucial for institutions because it is the key time for reallocation and redistribution of chips.
Simply put: someone is selling and exiting, while others are buying in, and BTC's price fluctuates back and forth during this game, whether it's accumulation or liquidation depends entirely on the actions of the chips.
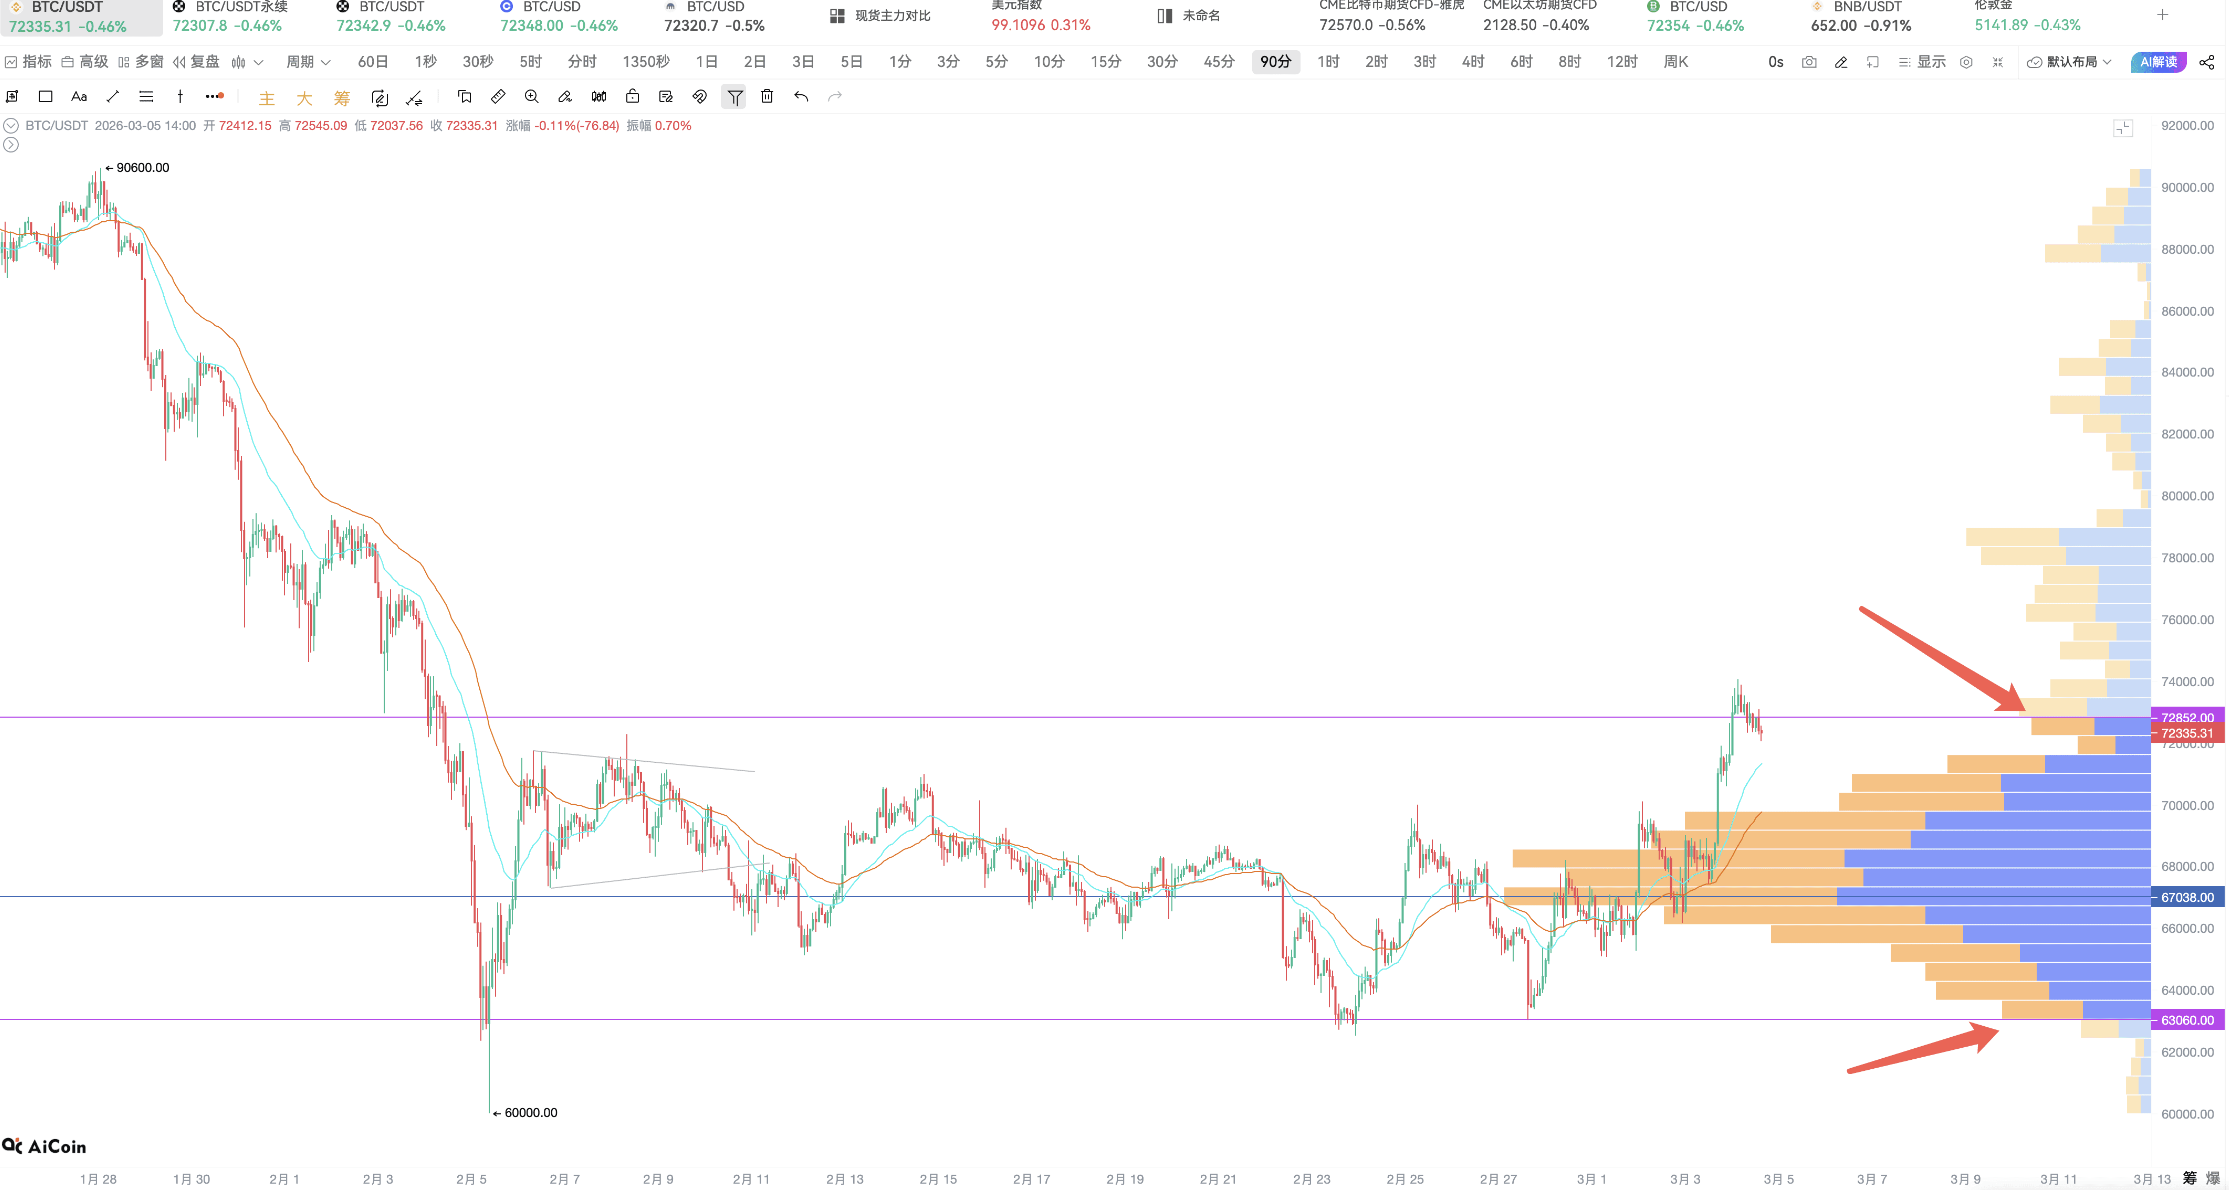
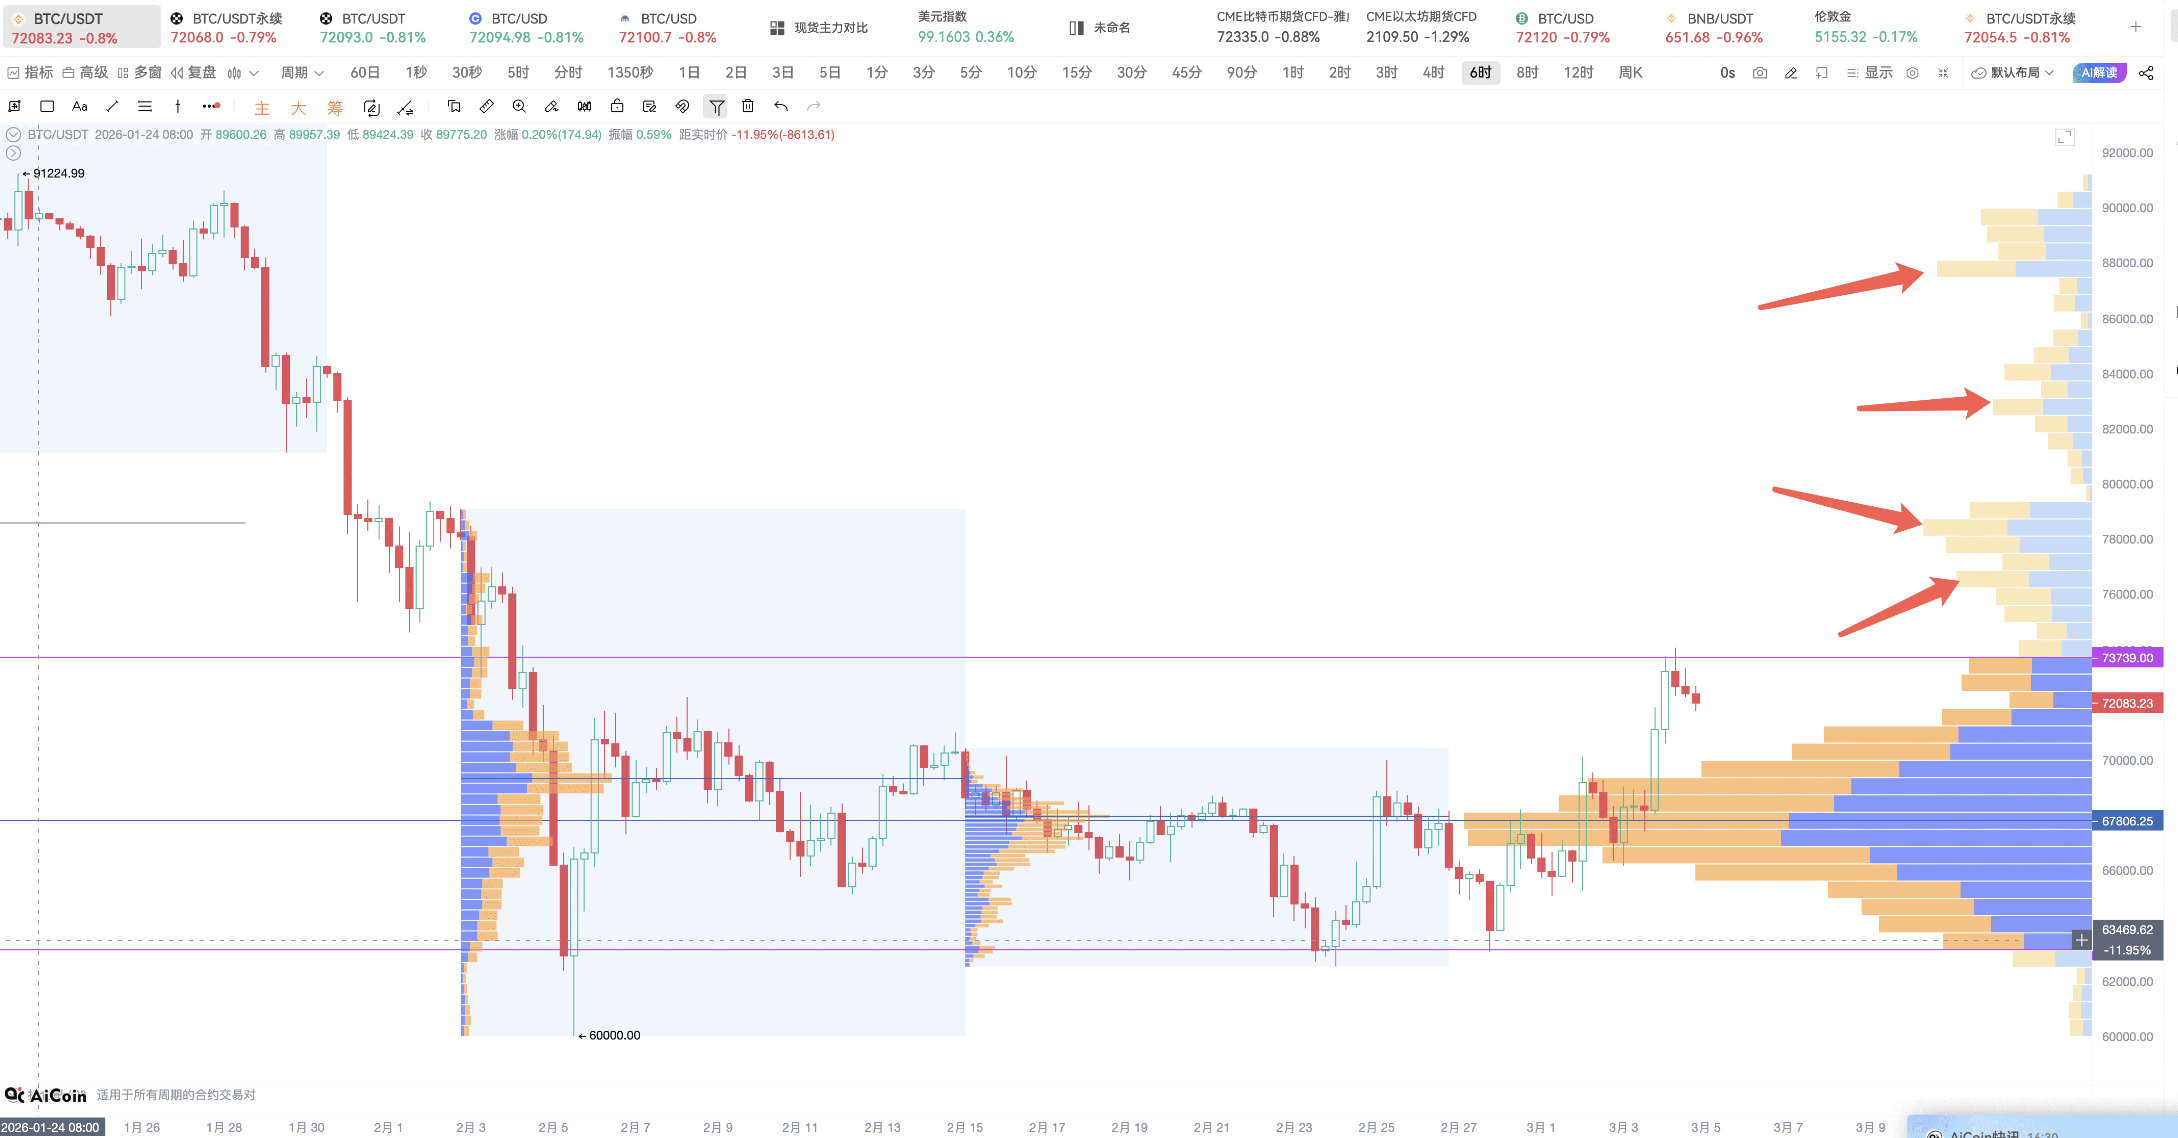
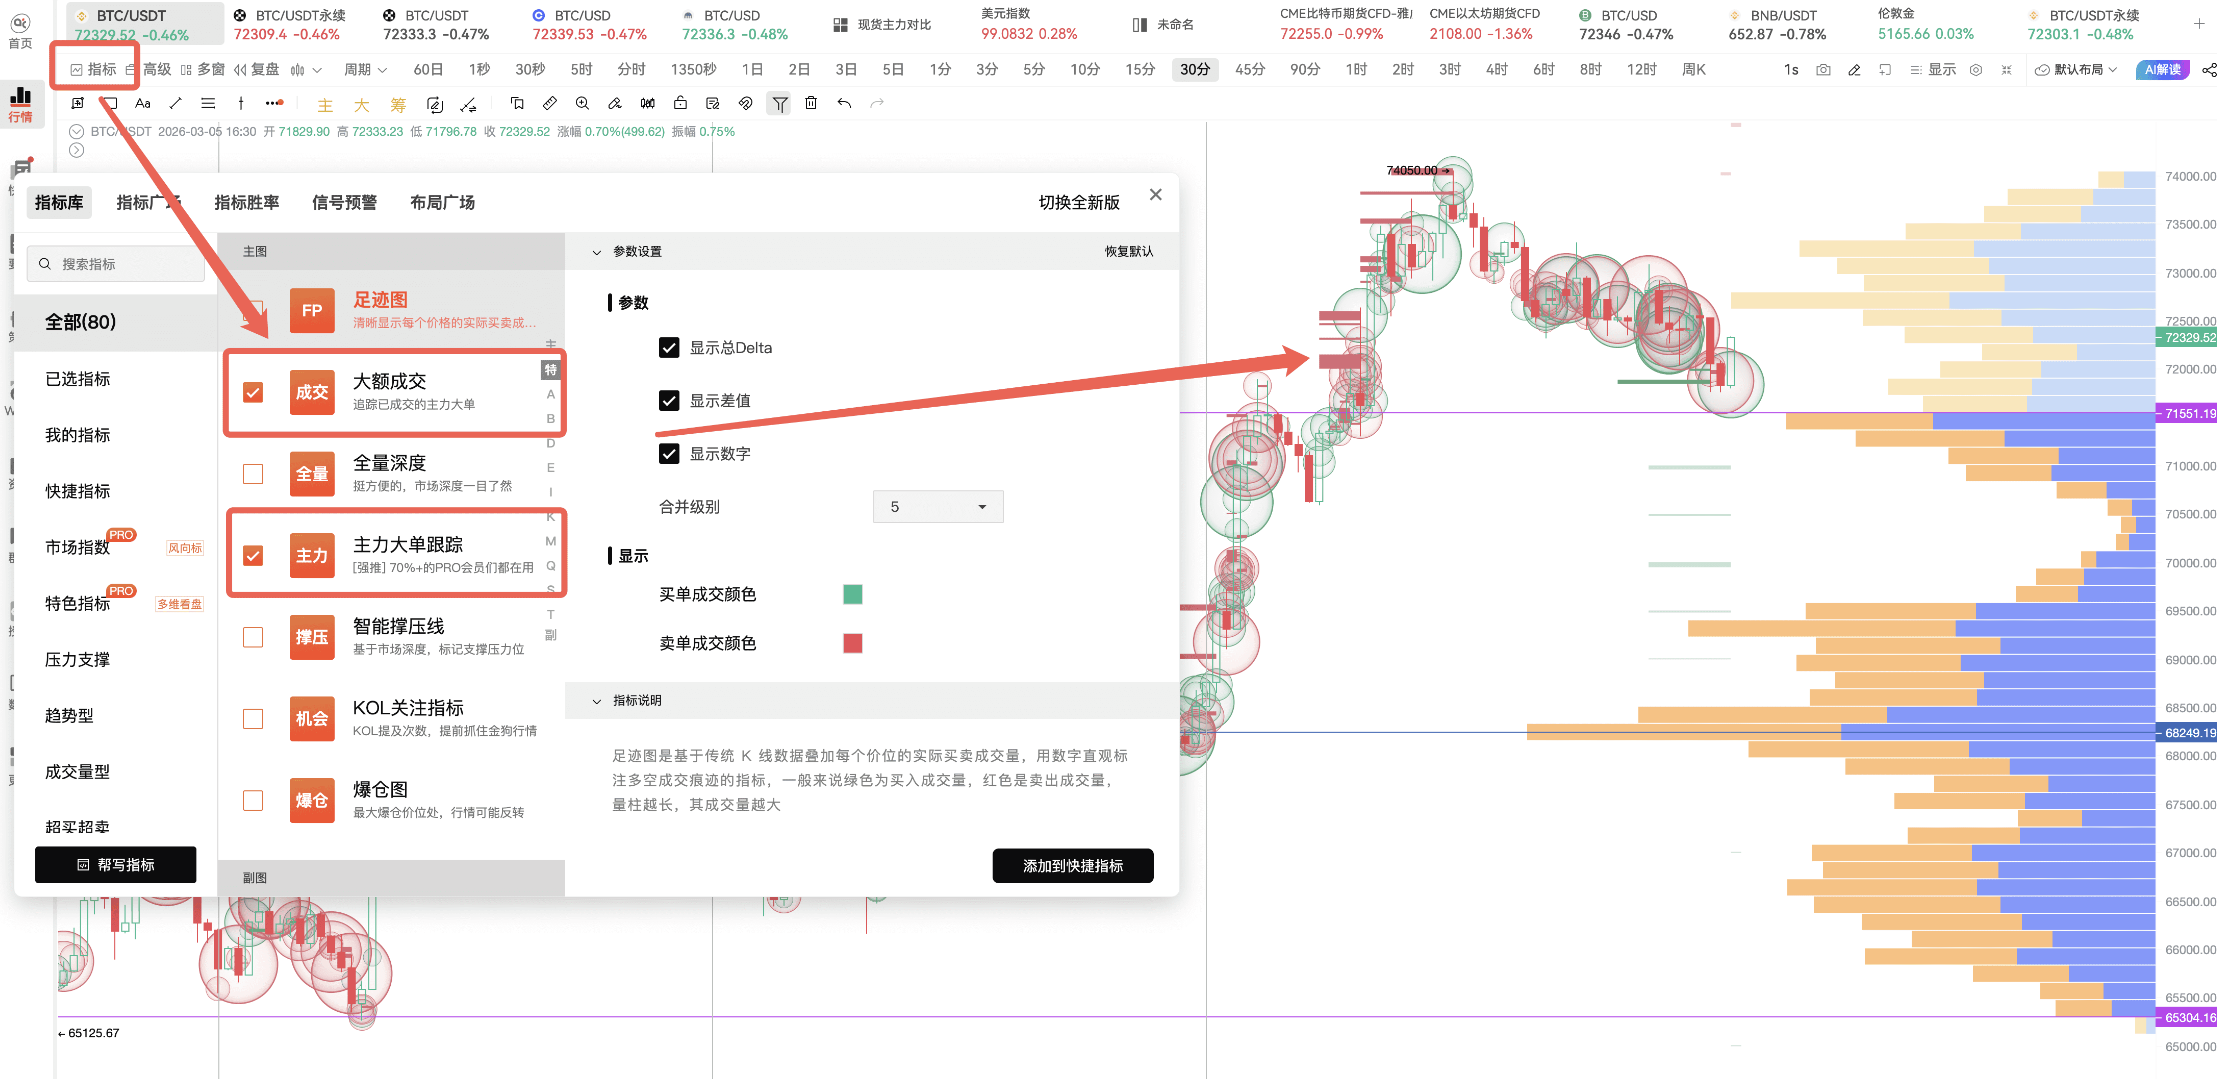
At this point, one piece of data becomes the core judgment: chip distribution, which is the part constituted by the blue and orange bars on the right side of the chart, allowing us to see the holding cost area of the vast majority of the market.
If we compare the chip structure of the last two time periods, we find that the patterns are highly similar, both exhibiting a multi-peak structure.
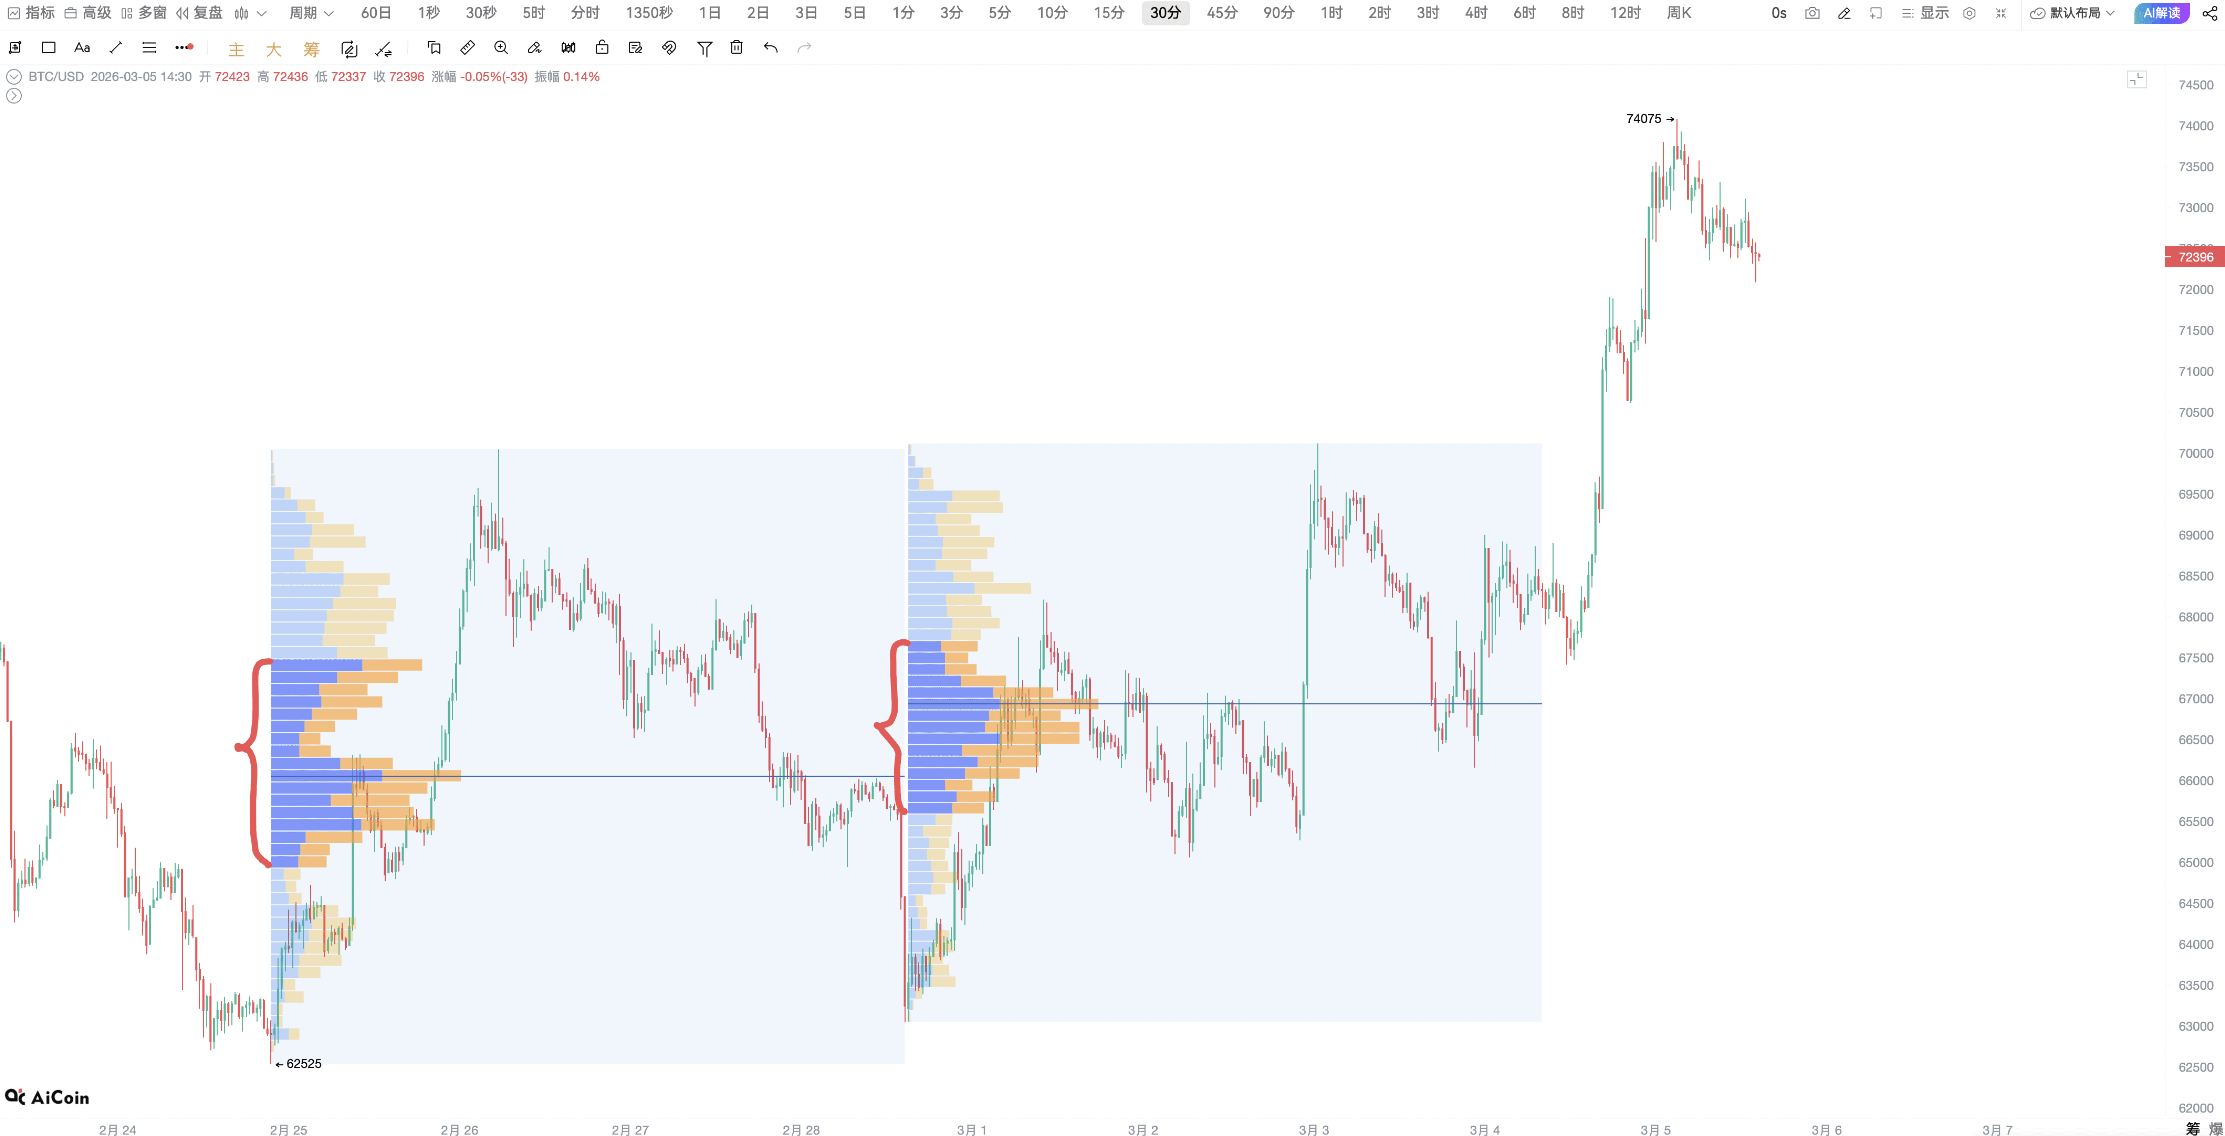
A multi-peak structure usually means: market chips are rapidly changing hands, and there are still significant divergences between bulls and bears.
There are two key signals that must be closely monitored:
First, the concentrated chip area in the second phase is narrower than in the first phase. To add, the darker section represents the 50% chip concentration area, and the narrowing of the area indicates that market consensus is gradually strengthening.
Second, the 50% chip concentration area in the second phase has moved up. In a normal adjustment market, the chip focus should move down; now that the focus has moved up, it is a short-term strength structural signal.
Let me supplement the basic usage of chip distribution, which beginners can quickly understand:
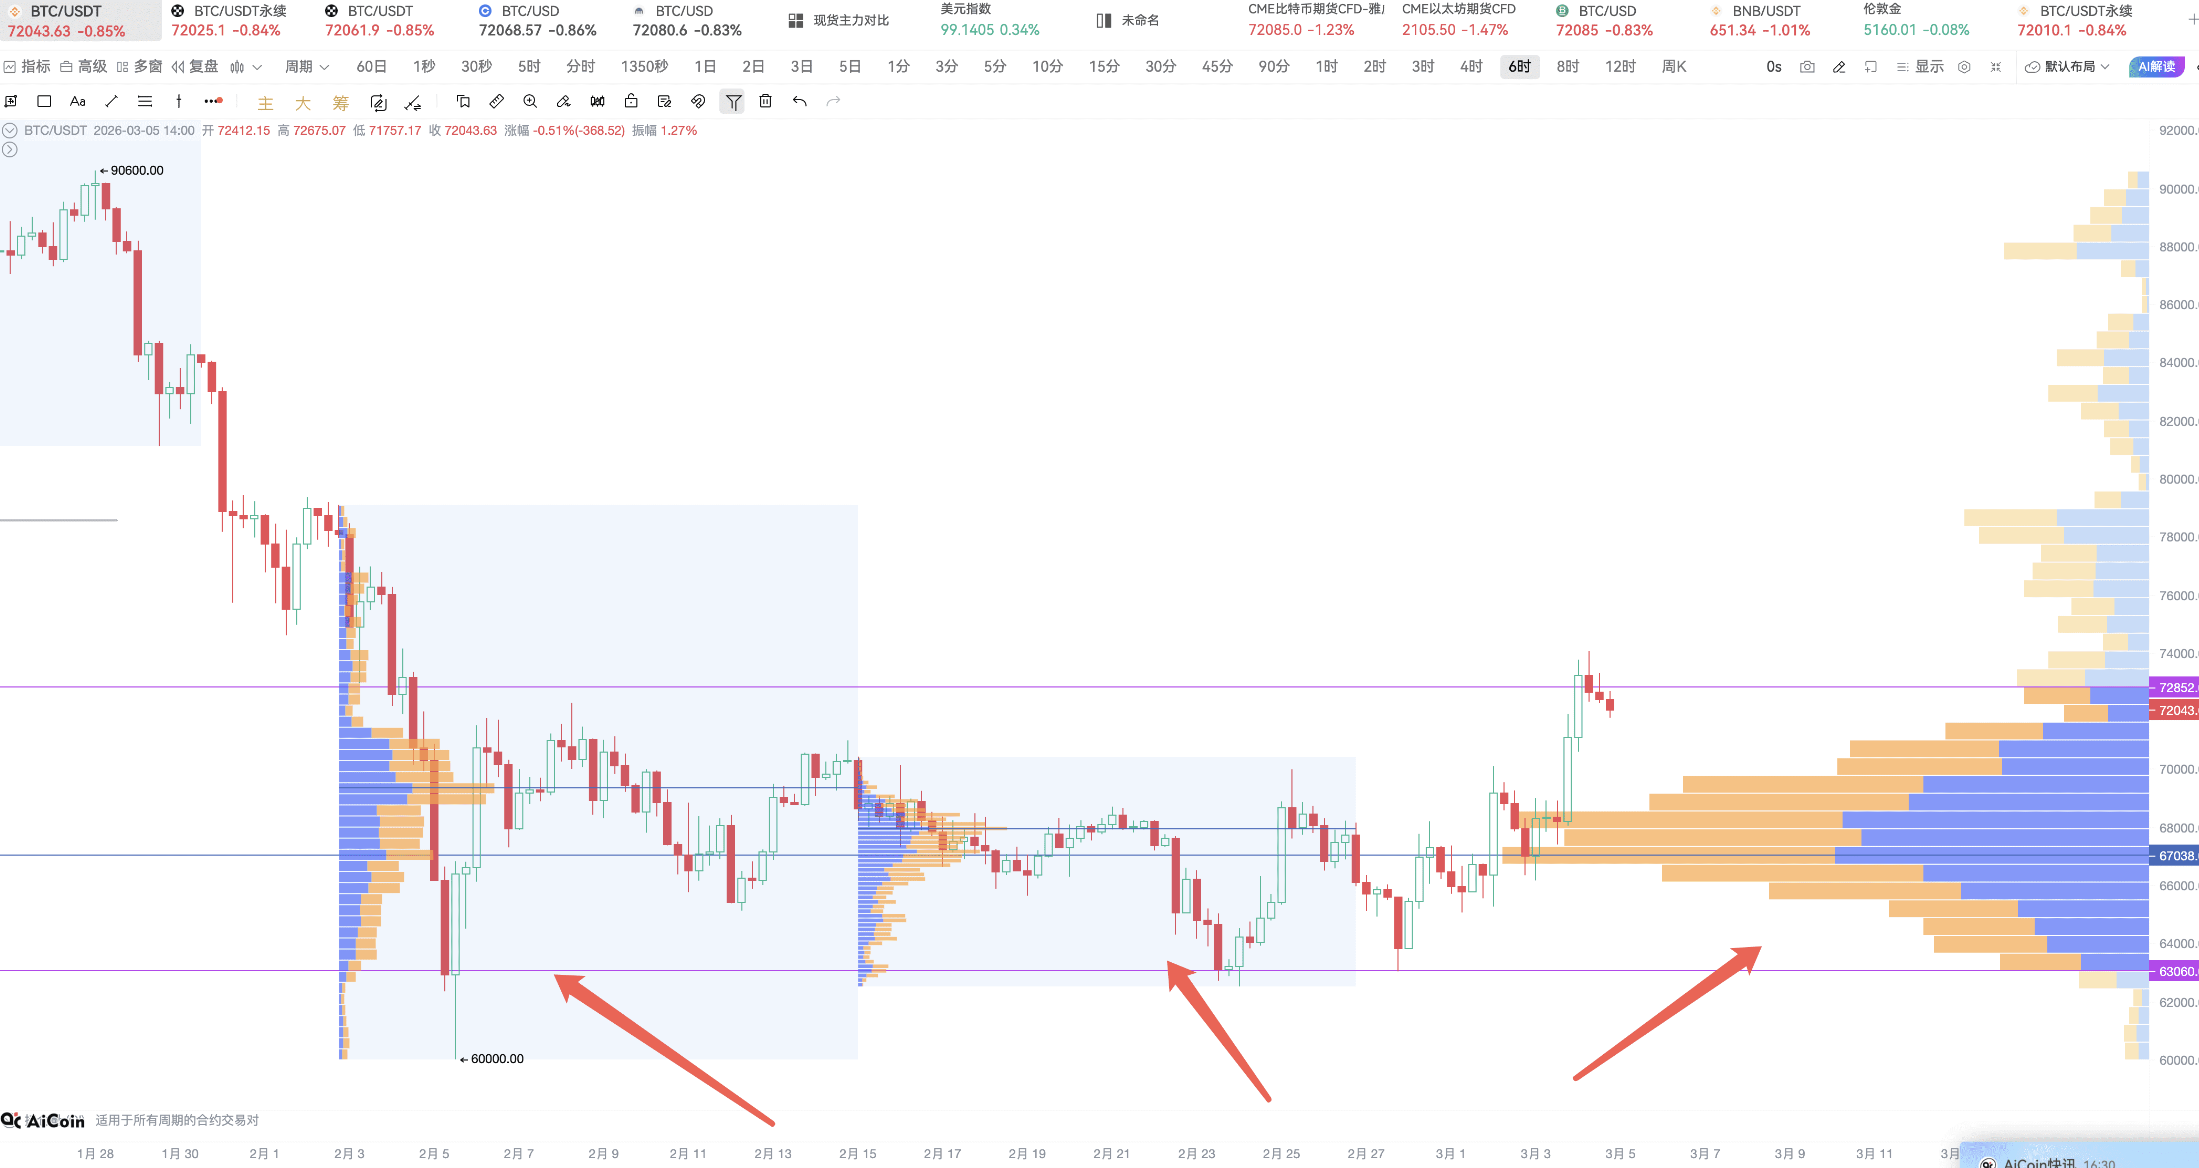
When the price is above the chip peak, the chip peak is a support level;
When the price is below the chip peak, the chip peak is a resistance level.
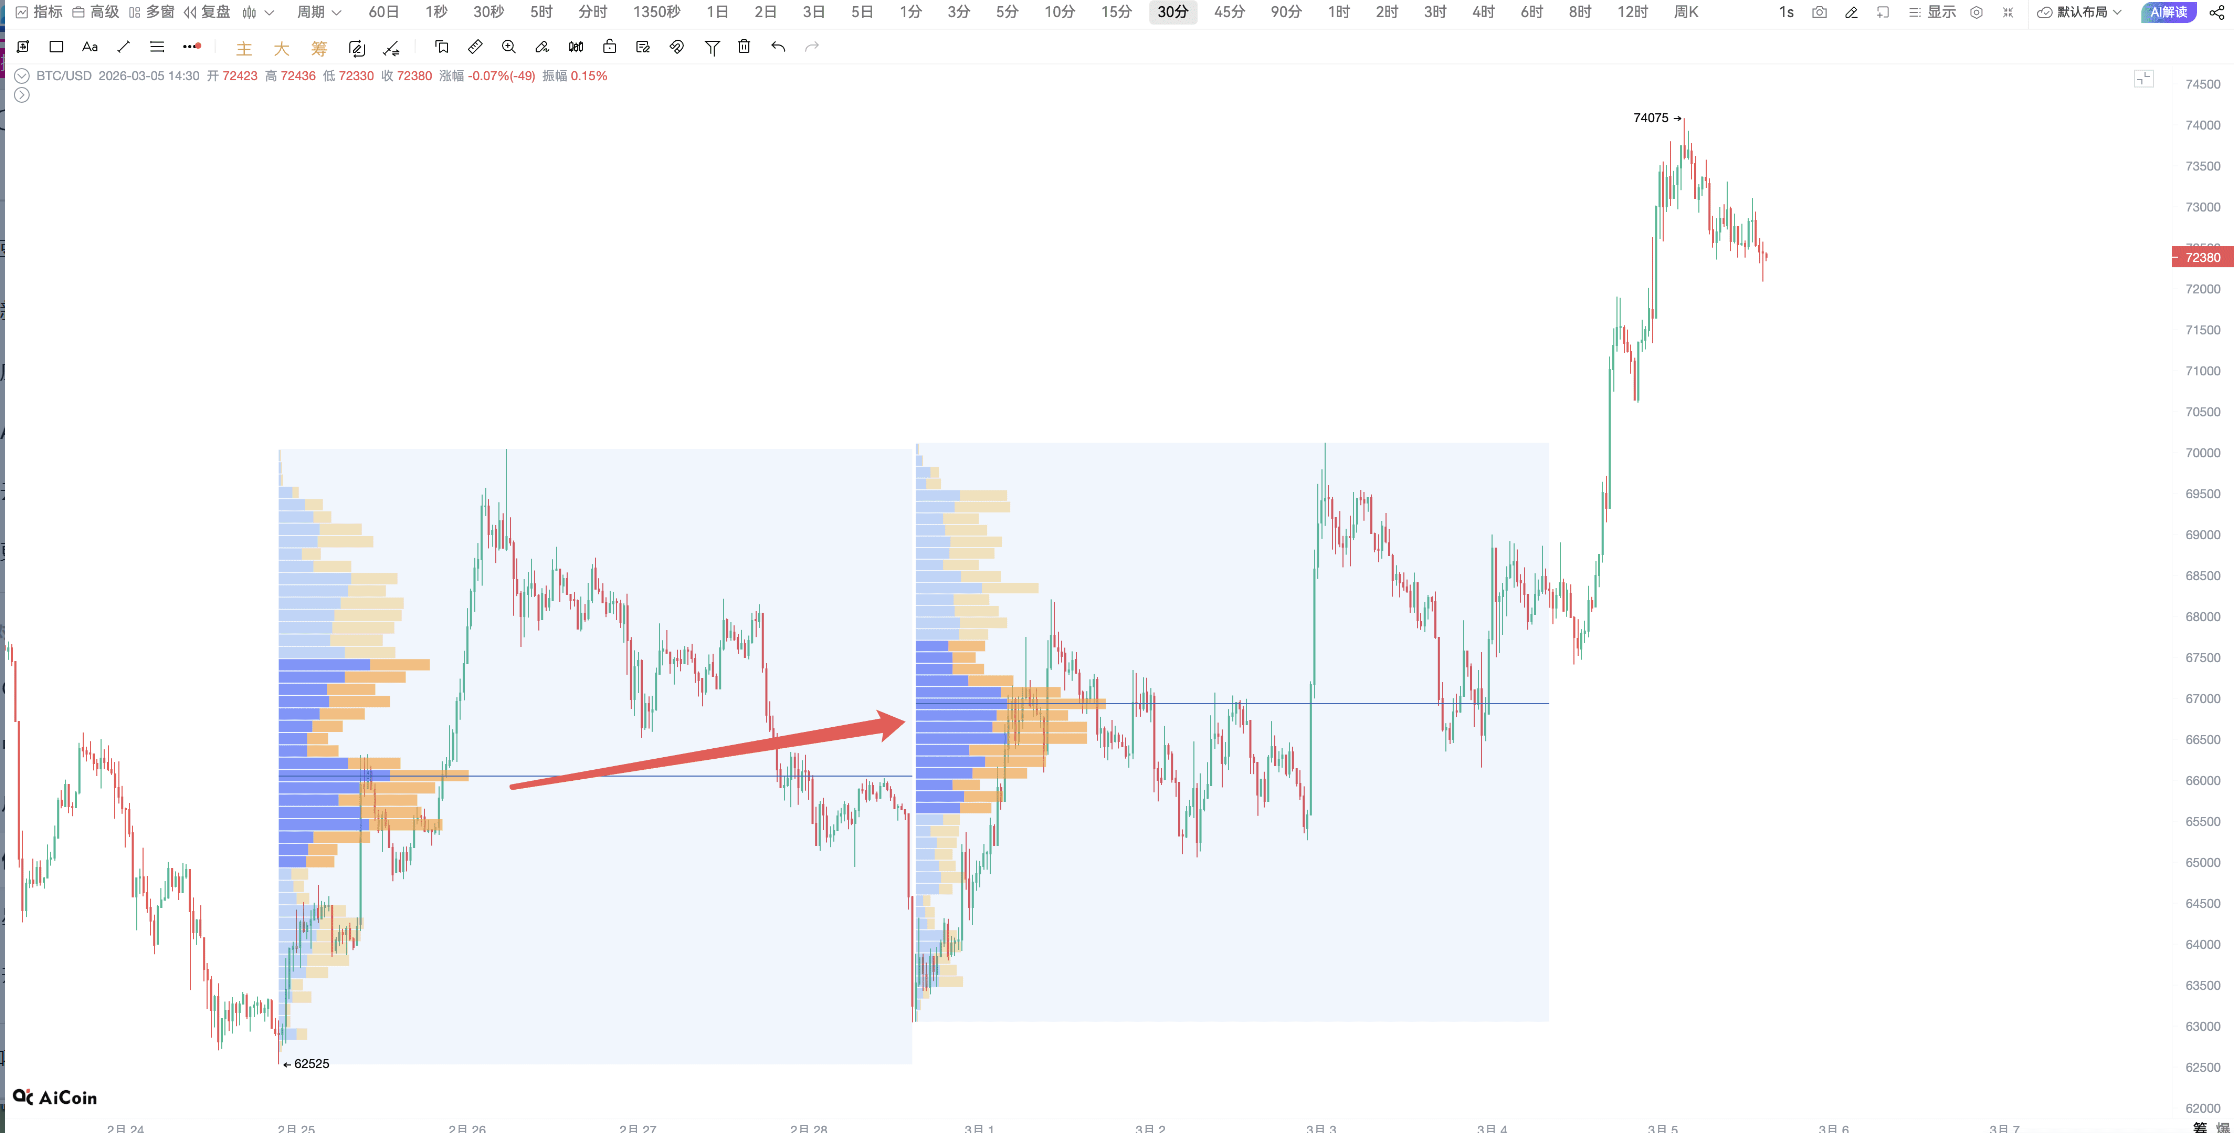
For example, the lower chip peak shown in the circle is strong support; the upper chip peak pointed to by the arrow is strong resistance.
Chip distributions vary by time range; this is the exclusive chip distribution function of AiCoin PRO.
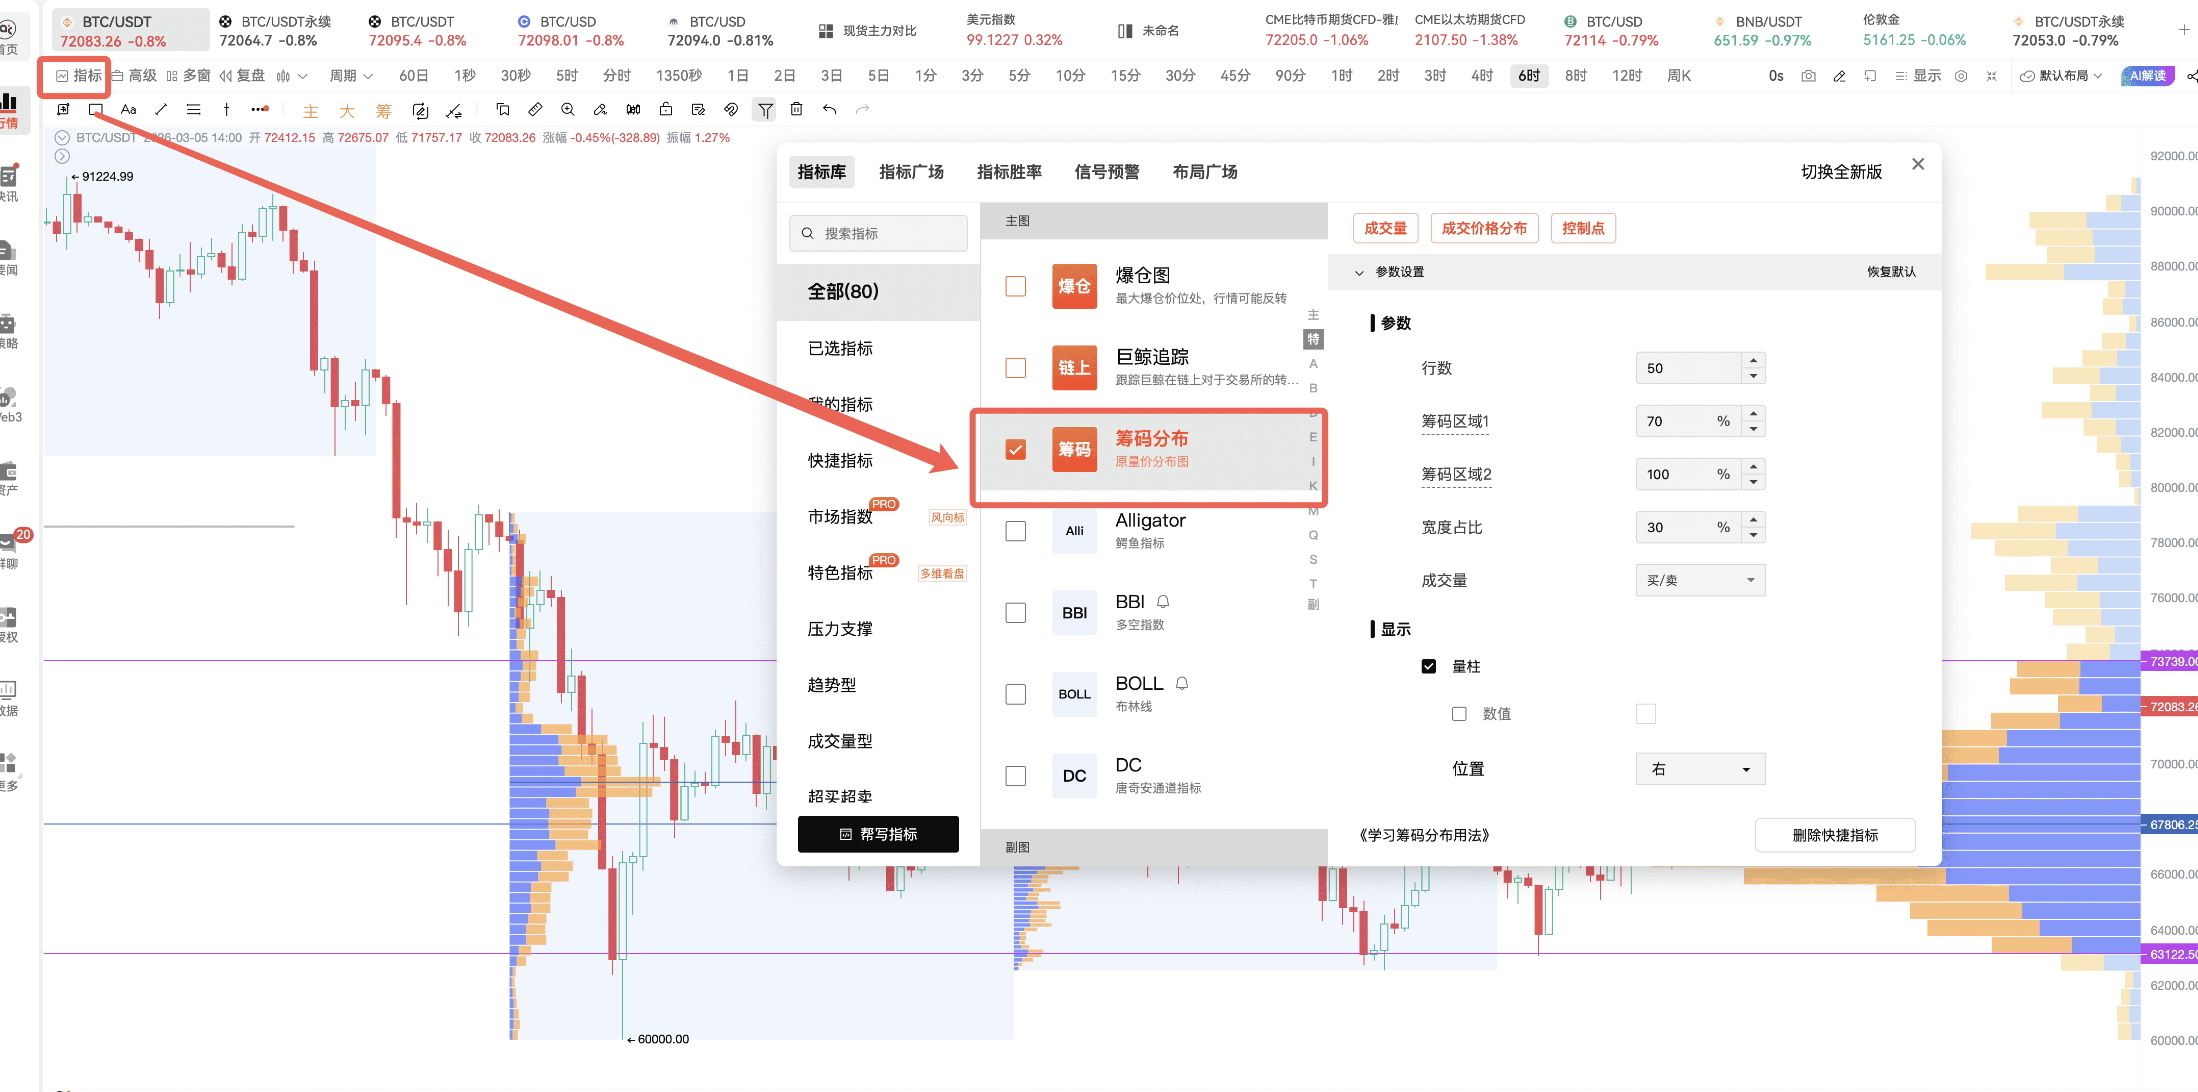
You can view the entire chip situation and also customize lines to selectively view chips for a specific time range.
Next, let’s look at the most critical core: the real behavior of main capital.
To judge whether this wave of market is a real increase or a false increase, the core point to look at is: has the main capital been buying or not!
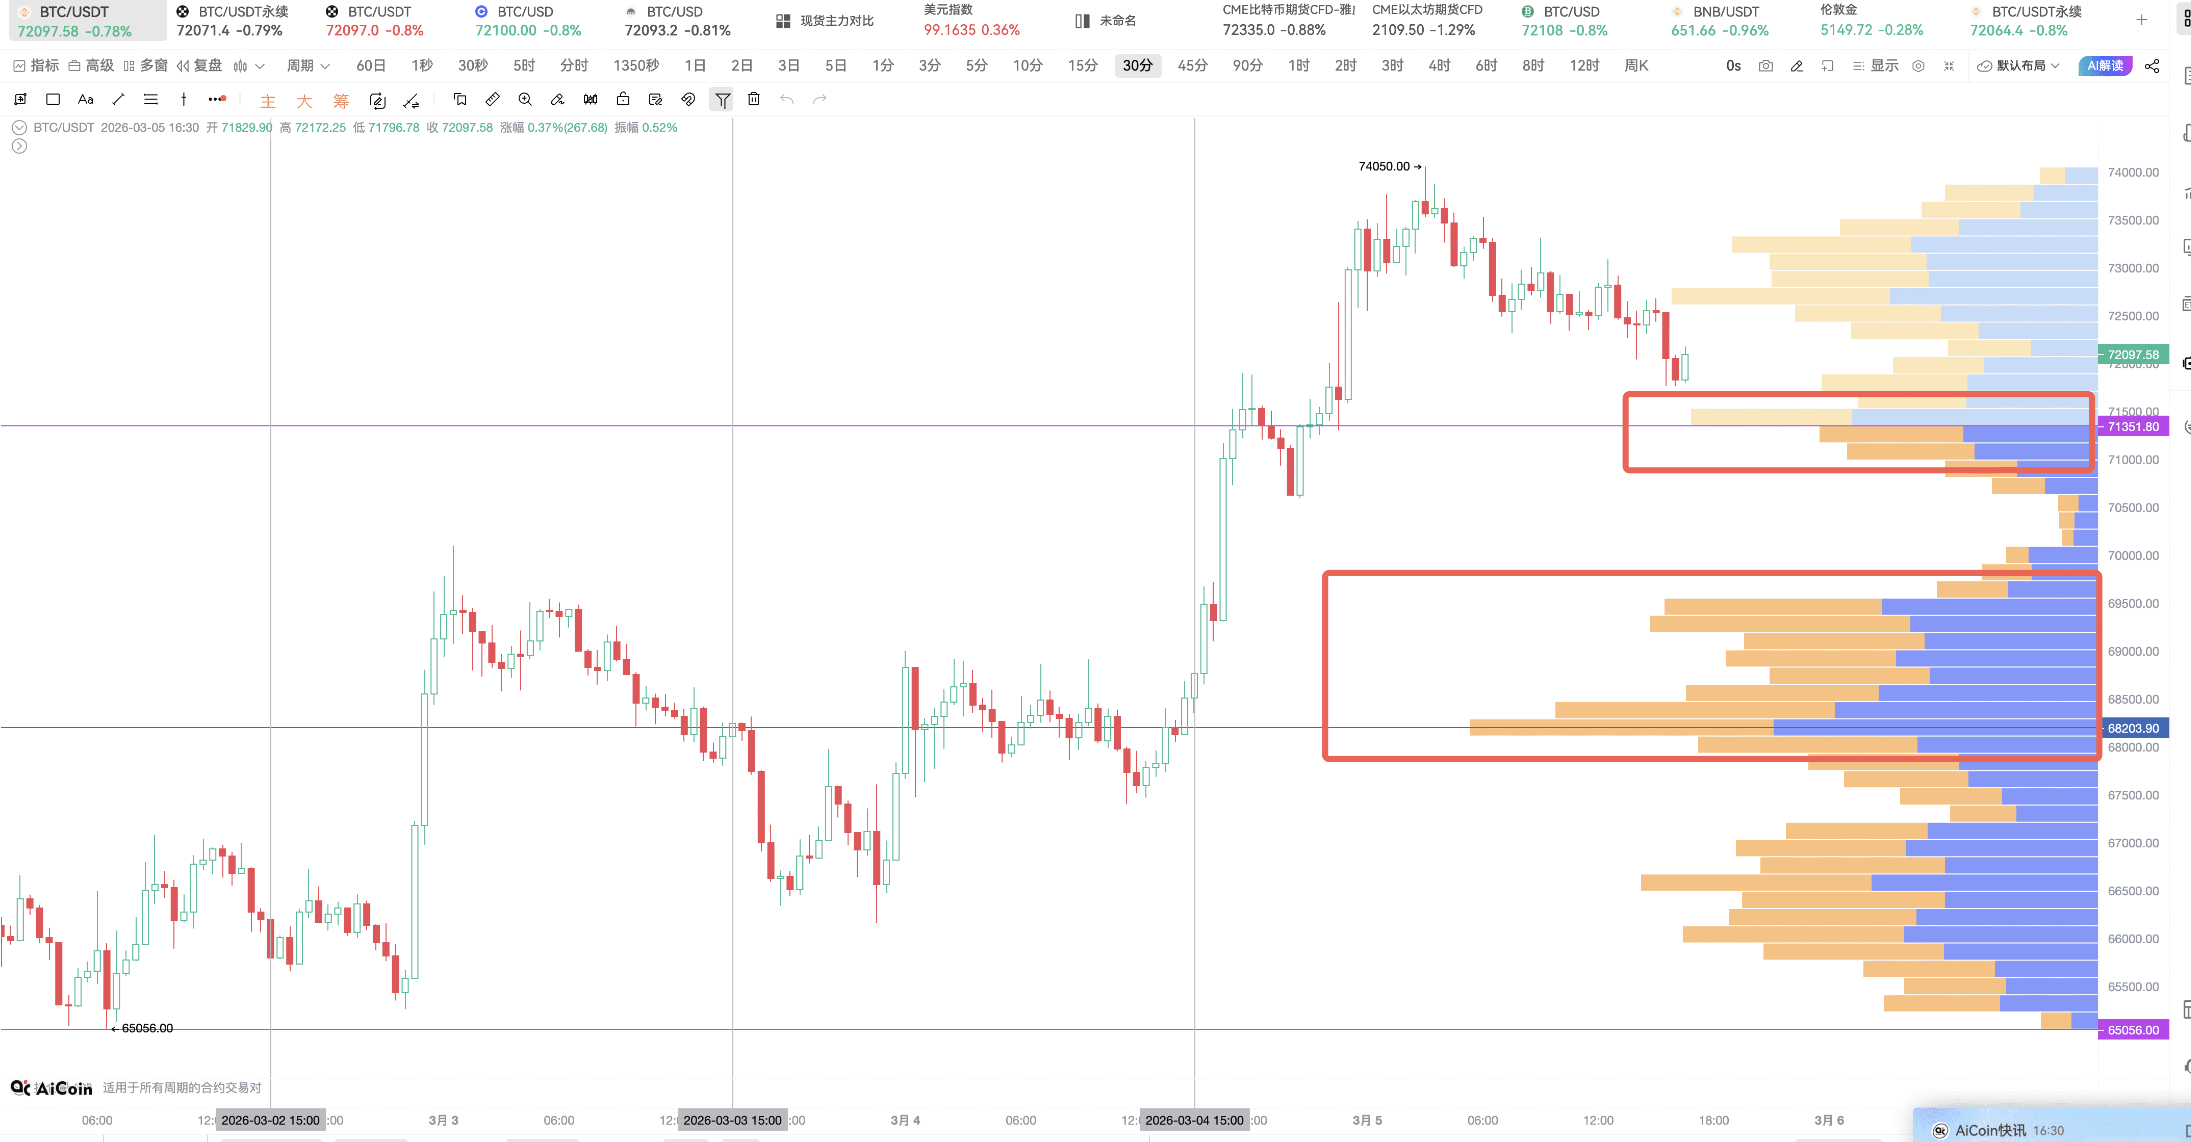
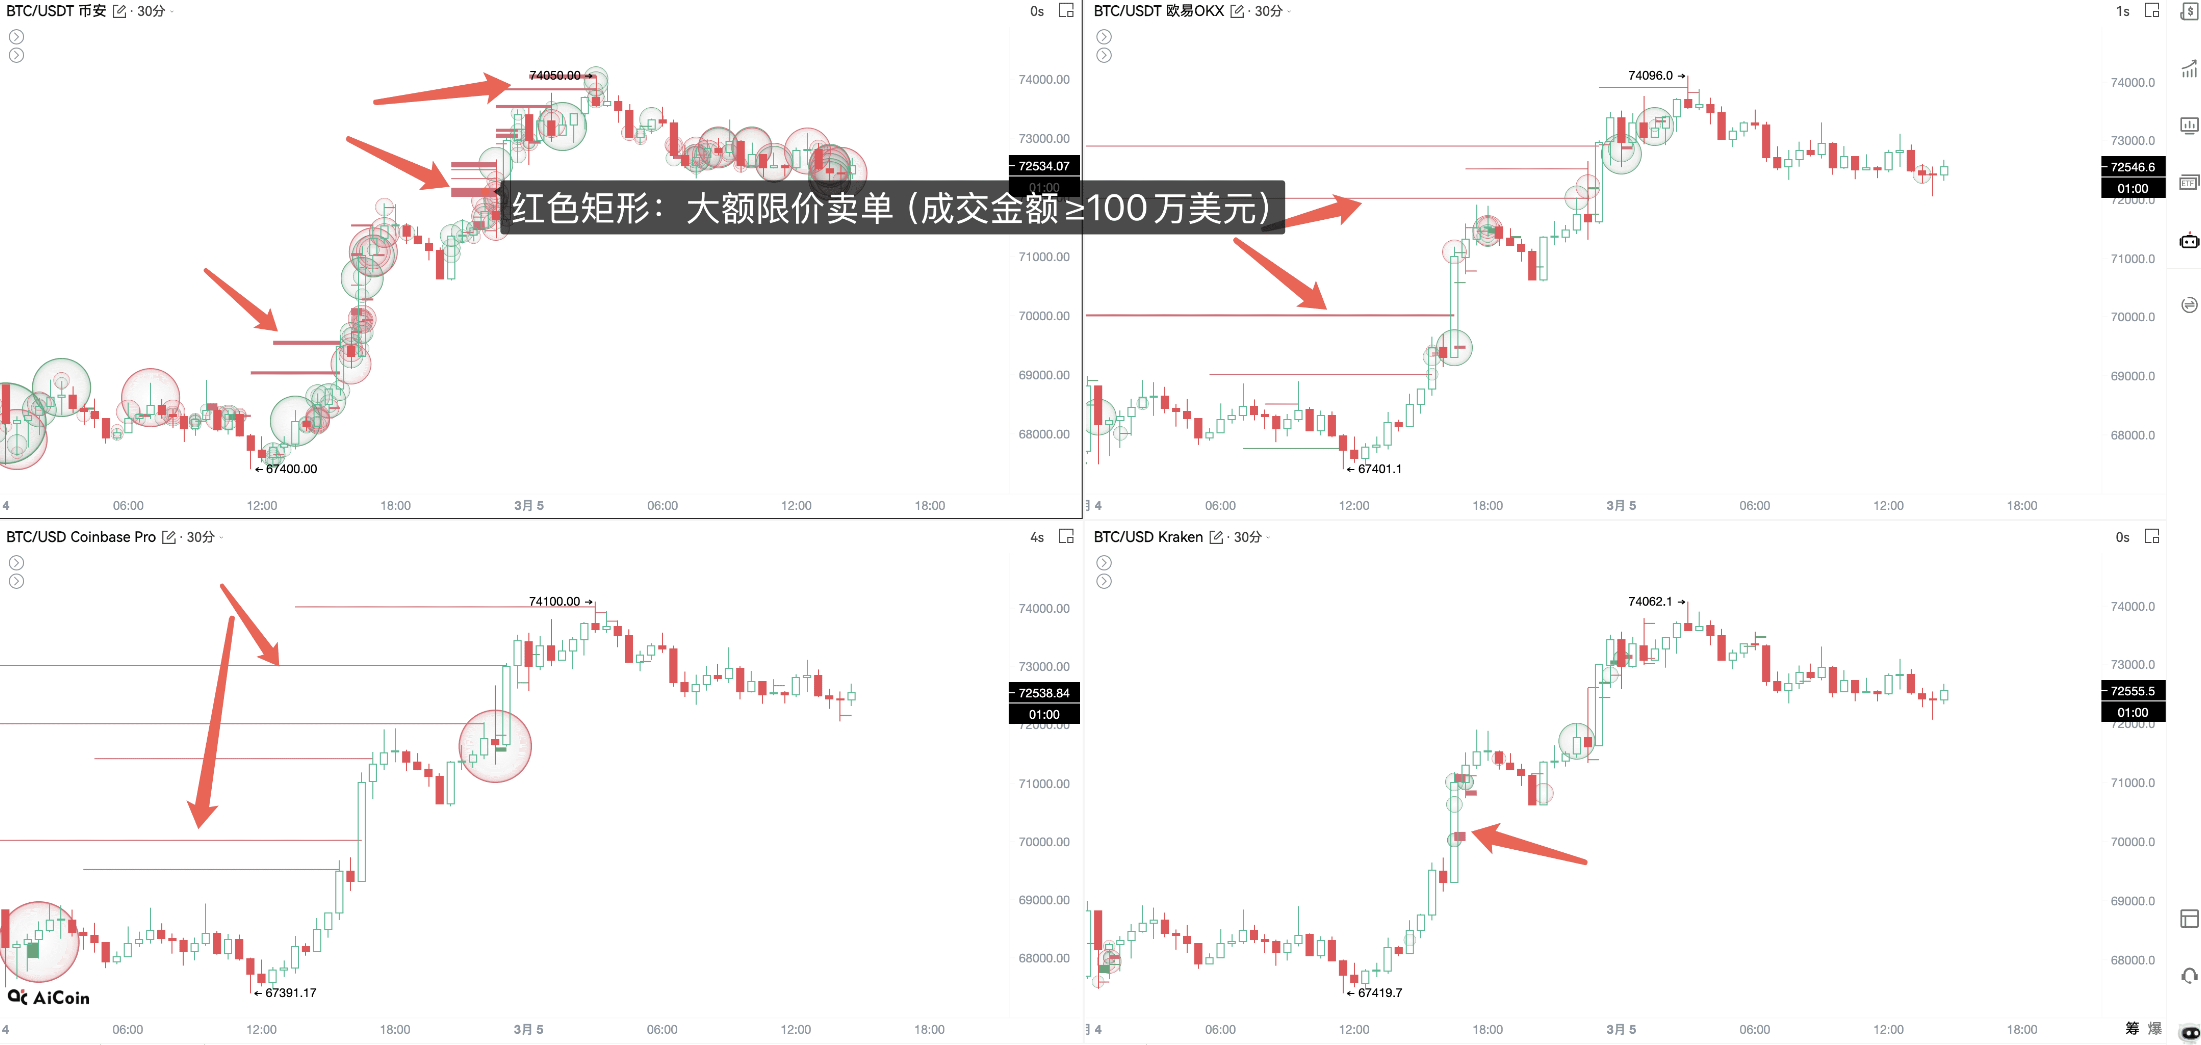
Looking at the chart, during this wave of increase, major platforms have placed significant limit sell orders, and these sell orders are tangible pressure points.
What was the result? All were actively consumed by capital, the buying pressure was very strong, the sell orders from the main were continuously consumed, and the price has not receded, which is a typical strong signal.
Now, let’s look at another key data point: the active buying behavior of the main capital.
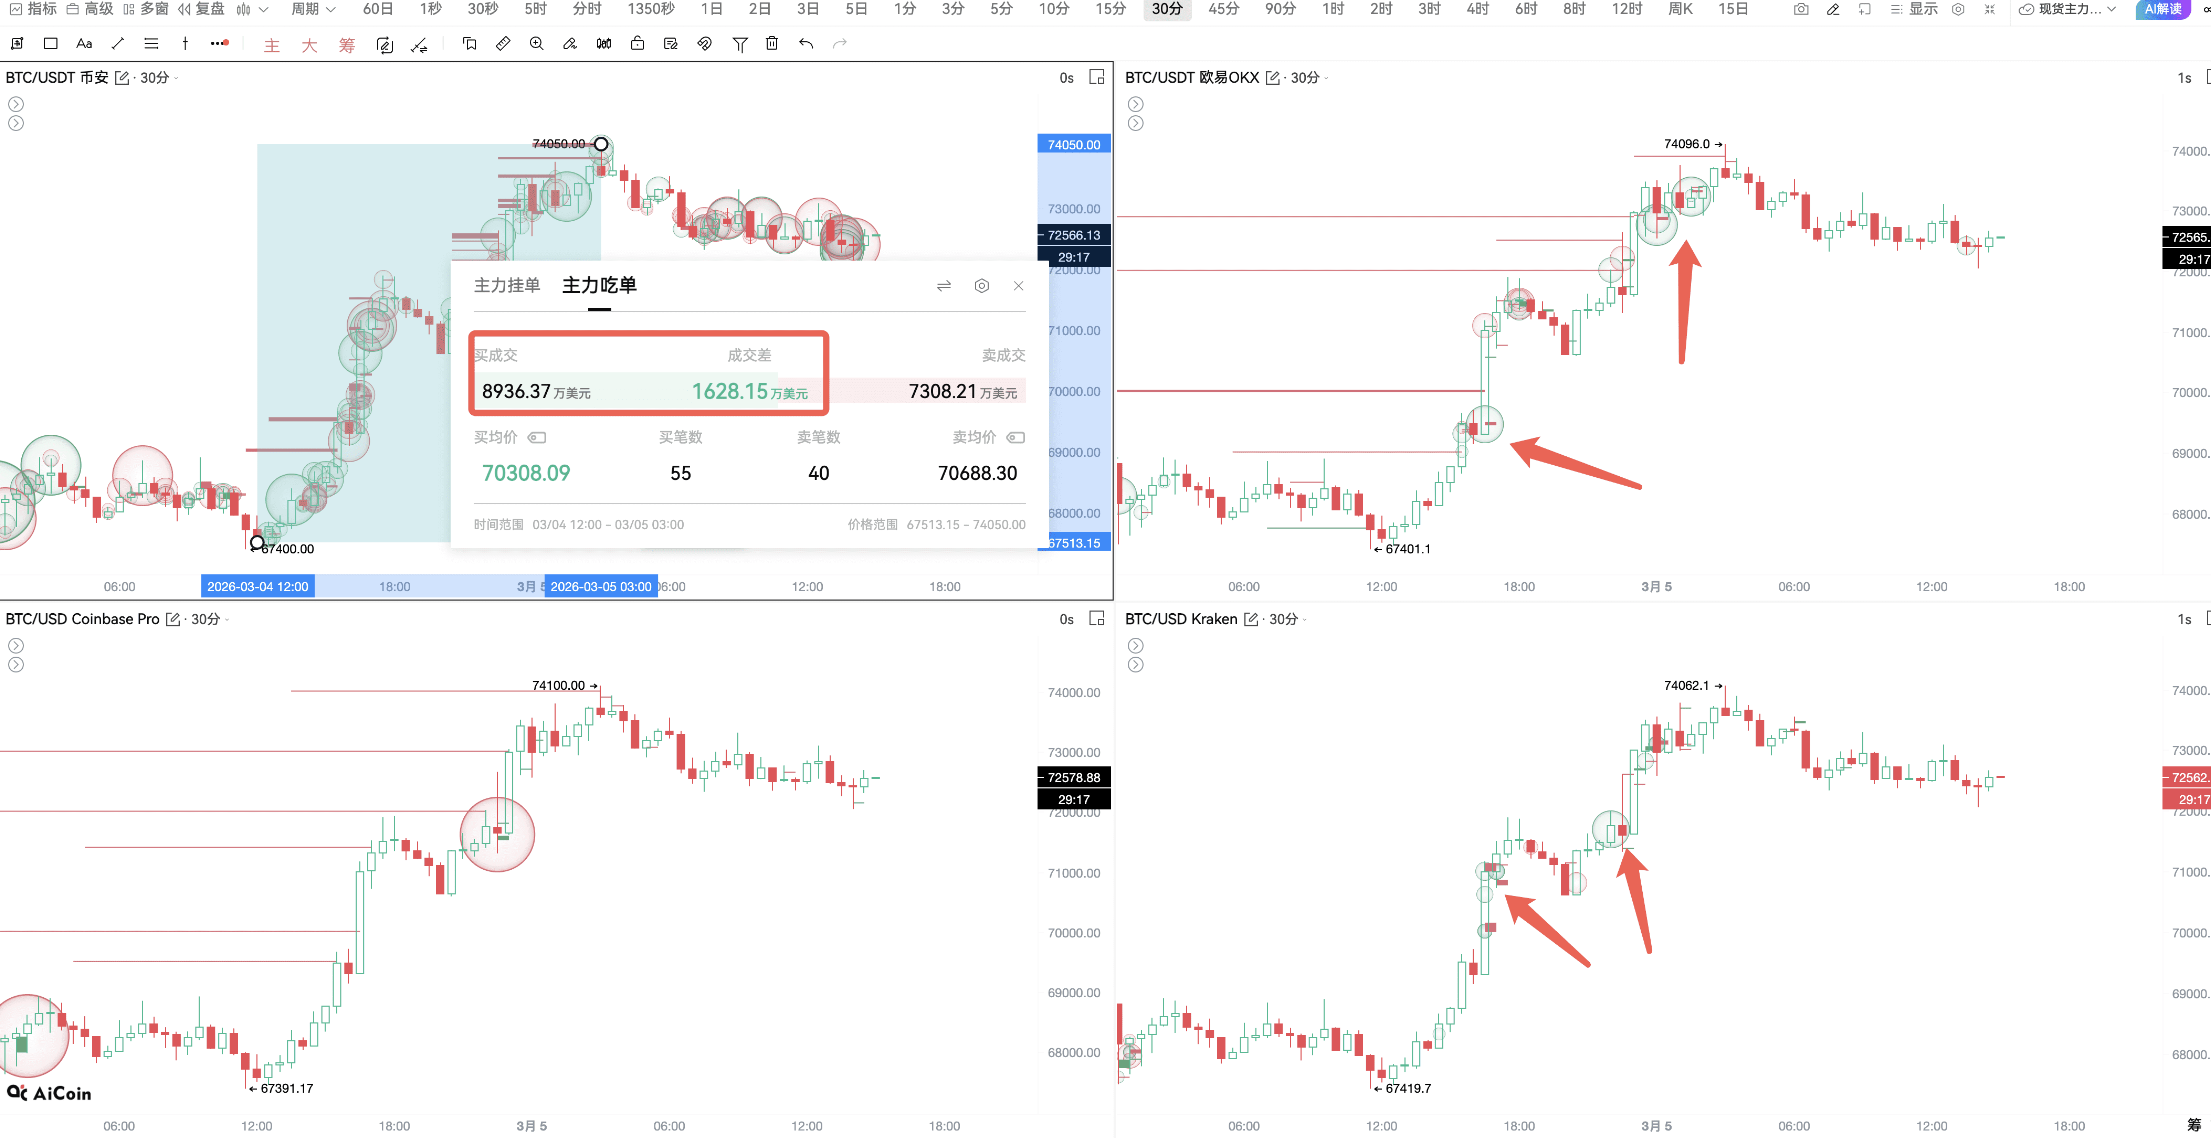
The green circles in the chart are all market buy orders.
The core performance during this period: main market buy > market sell, indicating that large capital is actively sweeping the market.
It should be noted that retail traders usually do not continuously use market buy orders (due to transaction fees and slippage), and those large market orders in the chart are all ≥$1 million spot orders, definitely indicating large players and main capital behavior.
To summarize the main actions:
The limit sell orders set by the main players were passively executed, while the main players actively issued market orders to sweep the market, which can be understood as: the main players are aggressively accumulating!
Additionally, tracking the limit sell orders from the main players, as well as executed limits and market executions, can all be done using our PRO indicators.
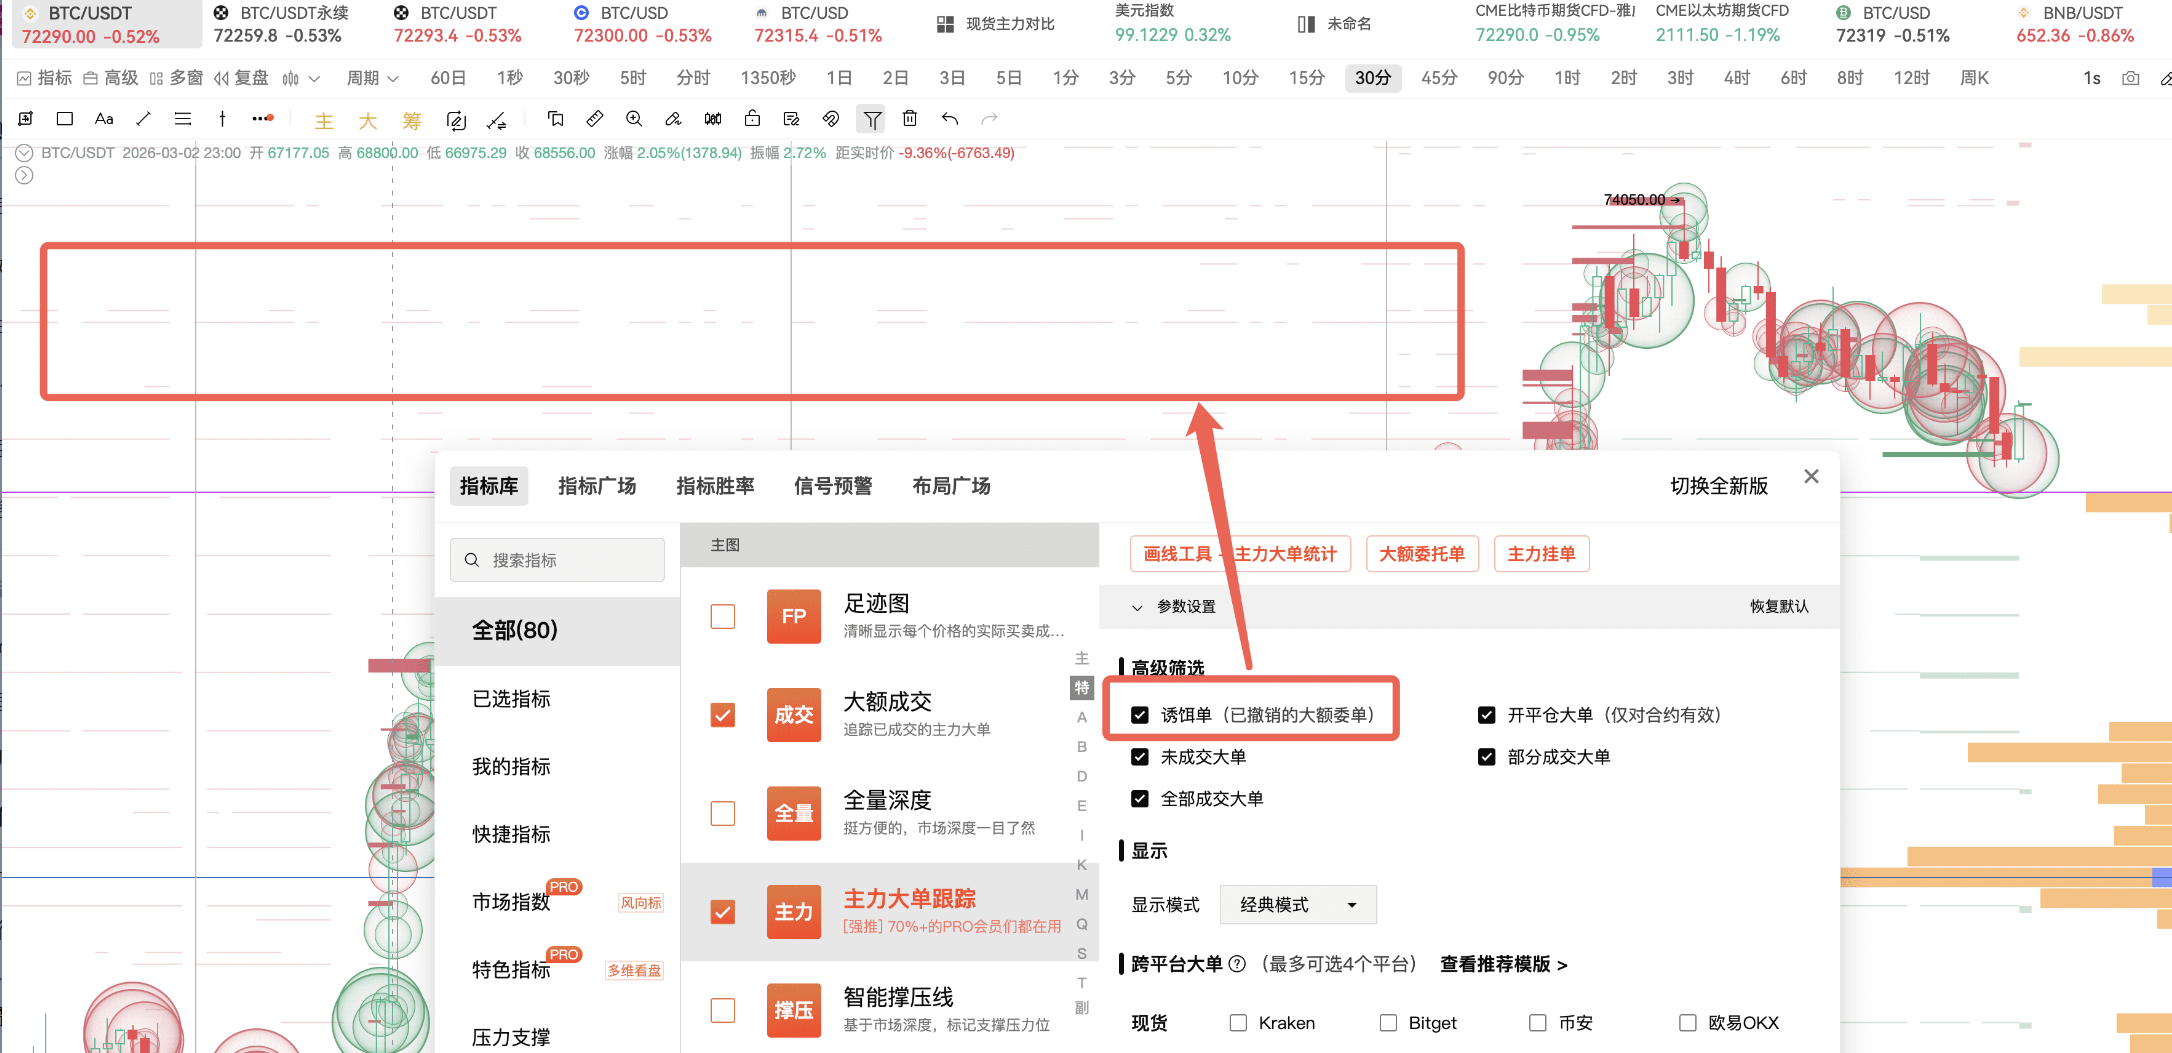
Another judgment technique: look for large orders of equal amounts frequently placed and canceled at the same price level.
If this characteristic is met, and the order duration is very short, it is usually a bait order, which can be clearly seen on the bait order display page.
By looking at all the data together: chip structure + main transactions, we can arrive at a clear judgment.
My view is very clear: this wave is a rebound, not a reversal.
I continue the viewpoint from last week: the major trend has not changed.
The core logic has two points:
First, the chip focus is moving up, indicating that the market structure has not deteriorated;
Second, the active market buying by the main players is increasing, indicating that real capital is supporting.
Therefore, the current market characterization is: structural rebound + main testing of upward pressure.
This evening, focus on two signals:
First, whether the chip continues to move up;
Second, whether the main capital continues to actively buy.
74,000 is a key watershed, and above 78,000-81,000, there is a CME gap.
If BTC can effectively break through 74,000, it will have a chance to sprint into this gap range.
Join our community to discuss together and grow stronger together!
Official Telegram community: https://t.me/aicoincn
AiCoin Chinese Twitter: https://x.com/AiCoinzh
OKX welfare group: https://aicoin.com/link/chat?cid=l61eM4owQ
Binance welfare group: https://aicoin.com/link/chat?cid=ynr7d1P6Z
This article only represents the author's personal view and does not represent the platform's stance or opinion. This article is for information sharing only and does not constitute any investment advice to anyone.
免责声明:本文章仅代表作者个人观点,不代表本平台的立场和观点。本文章仅供信息分享,不构成对任何人的任何投资建议。用户与作者之间的任何争议,与本平台无关。如网页中刊载的文章或图片涉及侵权,请提供相关的权利证明和身份证明发送邮件到support@aicoin.com,本平台相关工作人员将会进行核查。