Dear sisters, today we won't beat around the bush. Let's break down the three cycles, market news, and technical aspects directly, explaining the BTC forecast and trading thoughts clearly for everyone to understand, even newcomers can reference!
Sister Qinglan discusses the market: Recently, BTC's rebound has been very strong!
Let's first review the market situation of the past few days. I believe many sisters were sweating with anxiety ~ February 24th and February 5th were two critical low points, especially the drop on February 5th, which fell directly to over 62000 USD. How many people panicked and cut losses at that time? Fortunately, it then started a strong rebound, surging upward without disappointing anyone!
Speaking of the rebound, we must mention the heavyweight factor in the news – the Jane Street lawsuit triggered a short squeeze! As sisters know from the news, this directly allowed BTC to stabilize at 68000 USD, and there was even more explosive news: it was the first time in nearly a month and a half that short positions faced a liquidation of 589 million USD, directly crushing long positions! This is no small matter; it’s like sending rocket fuel to the bulls, with a large number of short positions forcibly liquidated, buying pressure surged, so how could the price not rise?
As for other news, such as Vitalik selling ETH, various countries' regulatory dynamics, and new coins on exchanges, Sister Qinglan tells everyone that these have little effect on BTC's trend in the short term, at most reflecting market vitality; we should focus on the key catalyst of the Jane Street short squeeze!
Technical Analysis: Three Cycles, All Bullish Signals!
Just looking at the news isn't enough; the technical analysis gives us the confidence to trade. Sister Qinglan divides it into three cycles, explaining it clearly without piling on professional jargon ~
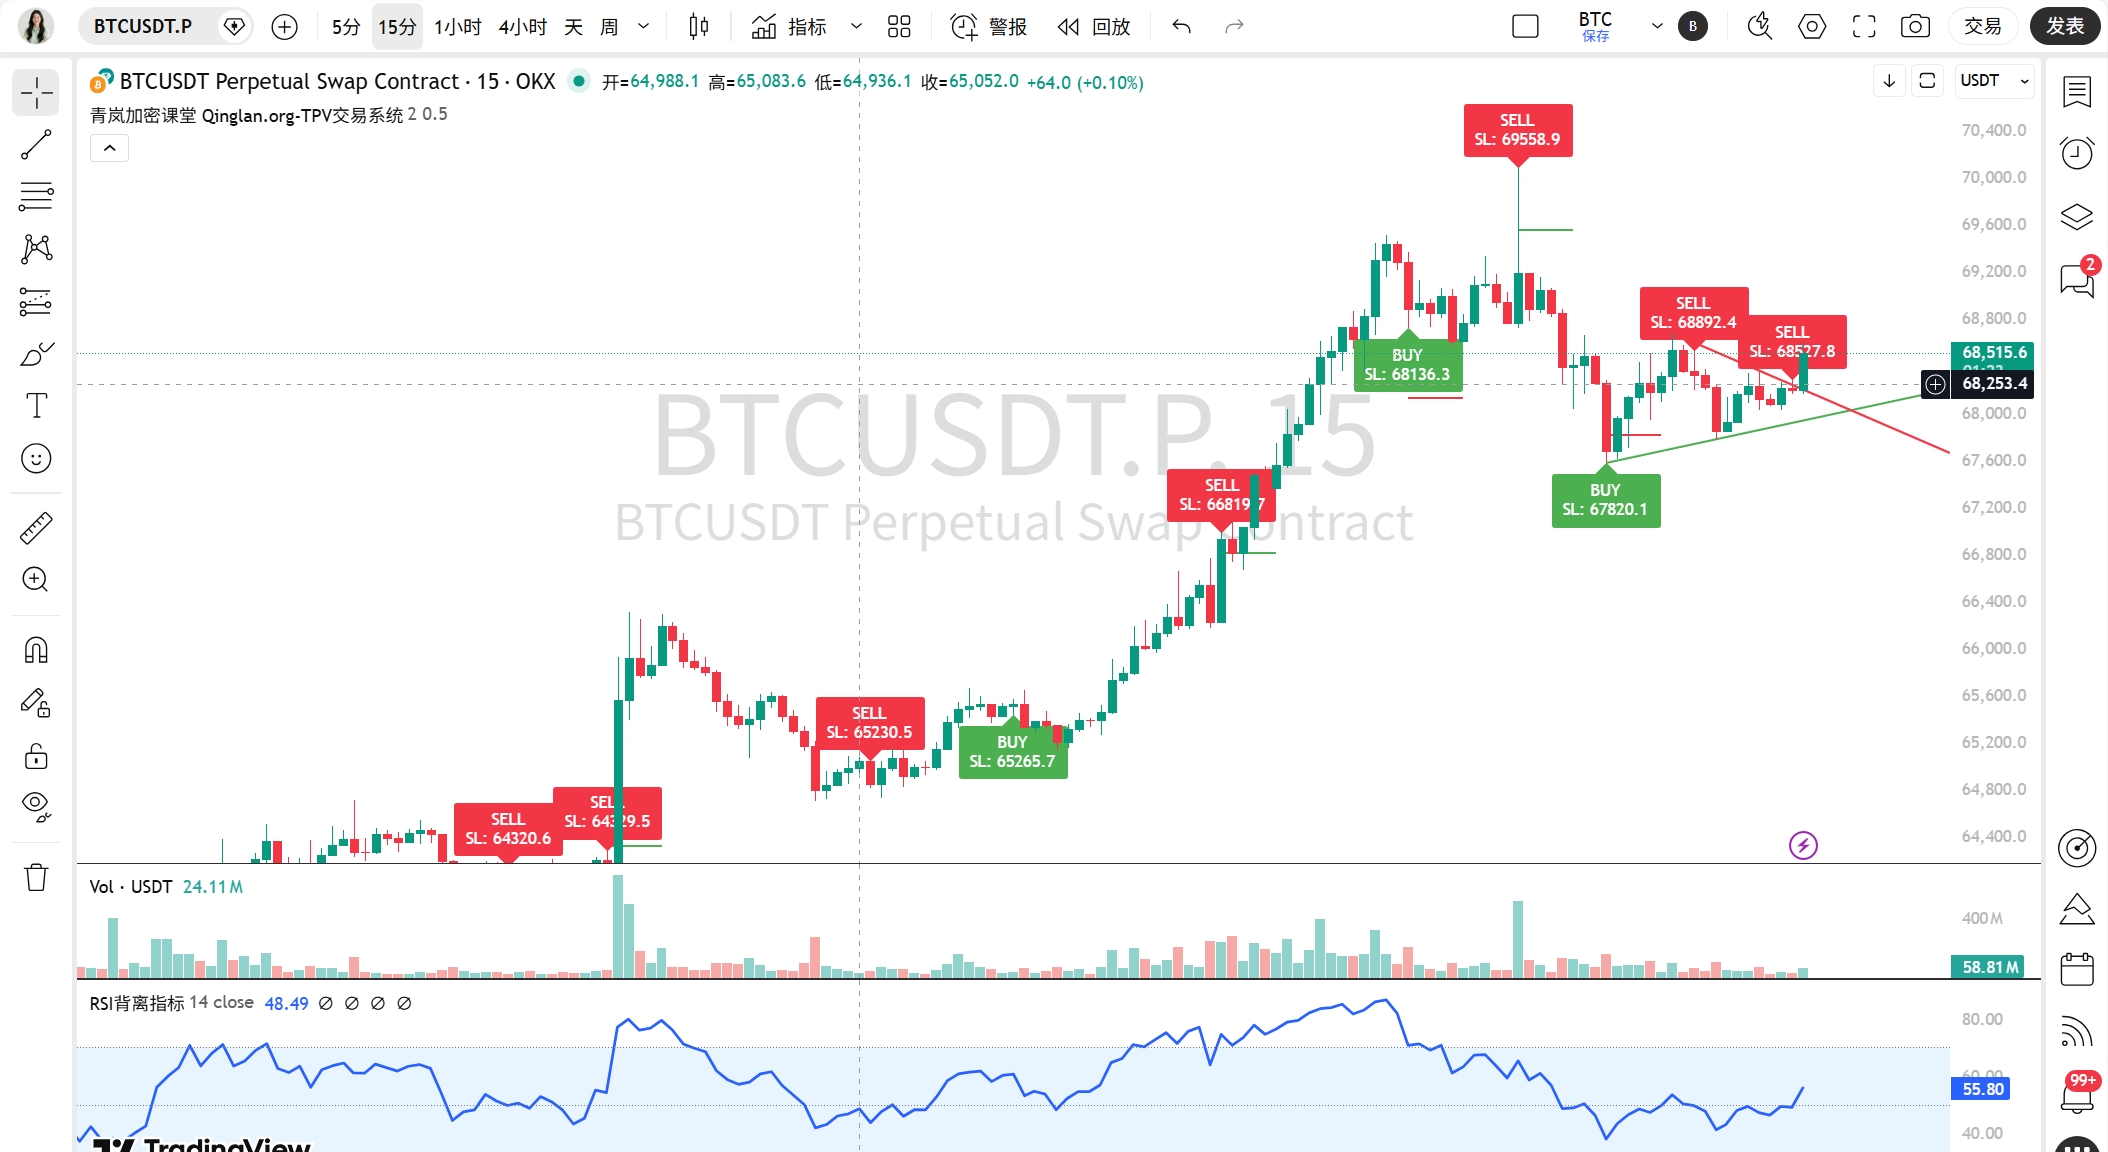
1. Short Term (15-Minute Chart): Upward Breakthrough, Momentum Strong
Since the evening of the 25th, BTC has entered a strong rally mode, climbing to around 69500 at about 3 AM today. Although there was a pullback, dropping to a low of 67600, it quickly rebounded. The current price has reached 68584, and the volume is increasing. This signal is very positive!
Key indicators to watch: Around 12 PM today, the 15-minute MACD formed a golden cross, and the histogram shifted from negative to positive, still expanding, indicating that bullish momentum is accelerating; RSI returned to 56.65, market sentiment is bullish; MA5 and MA10 are also above MA20, with the price standing firm above all short-term moving averages, bullish in the short term is a sure thing!
2. Mid-Term (1-Hour + 4-Hour Chart): Bulls in Control, Pullbacks are Strengthening
In the 1-hour chart, we can see that after the low on the 24th, it surged all the way up to a high of 69550; the 4-hour chart is even clearer, showing that since the bottom reversal on February 5th, the momentum has never weakened.
In terms of indicators, the 1-hour MA indicator formed a bullish arrangement in the morning of the 25th, and the MACD gave a golden cross on the evening of the 24th. Although there was a slight pullback afterward with green bars narrowing, this is not a reversal but a release of energy in the rising trend. RSI is at 66.45, although it has retreated from the overbought area, buying pressure is still present. The 4-hour chart is even stronger, as the MA has already formed a perfect bullish arrangement. After the MACD golden cross, the red bars have continuously expanded, and the RSI is at 61.61, showing a healthy upward trend, the mid-term bullish pattern is solid!
3. Long Term (1-Day Chart): Bottom Reversal, Upward Consolidation is Confirmed
The daily chart shows that BTC experienced a significant drop from mid-January to early February, but after hitting the bottom on February 5th, it strongly reversed, and now the price has stabilized above all long-term moving averages. This is a big signal!
What reassures Sister Qinglan the most is that the daily MACD gave a golden cross on February 15th, and the histogram has been continuously expanding from negative to positive, which is a clear signal of a bottom reversal; the RSI has risen from the oversold zone of 15 to 43.95, indicating that market sentiment has shifted from panic to optimism. In the long term, BTC has entered a new phase of upward consolidation!
Sister Qinglan's Exclusive Trading Thoughts: Divide into Short-Term and Mid-Long Term, Stability First
In conclusion, BTC this time is certainly a “return of the king,” bullish in all short, mid, and long cycles. Sister Qinglan has categorized the trading thoughts clearly for everyone, even newcomers can follow along!
✅ Short-Term Trading (suitable for sisters who like quick entries and exits)
Direction: Short-term bullish dominance, do not operate against the trend
Support and Resistance: Support is seen at 67500-68000, where bulls will actively defend; resistance focuses on the psychological level of 69500-70000
Operation Suggestions: When 15-minute MACD forms a golden cross and the price stabilizes above short-term moving averages, lightly enter long positions; a pullback to the support level and stabilization is also a good buying opportunity; breaking 70000 opens up more upward space, set stop-loss below 68000, prioritizing risk control!
✅ Mid-Long Term Trading (suitable for conservative sisters)
Direction: Clear long-term bullish outlook, hold onto quality chips
Support and Resistance: Mid-long term support is at 62000-64000, which is the starting point for this round of rebound; as long as we don't break below it, we're fine; apart from 70000, long-term resistance also includes the dense trading area of 72000-75000
Operation Suggestions: Now is the early stage of the trend, buying on dips is the most prudent, especially when the price stabilizes near daily and 4-hour moving averages during a pullback; stop-loss can be relaxed and placed below the daily MA20 or near the low point of this round of rising, holding patiently for greater profits!
Be Cautious of Reversal Risks (Reminder from Sister Qinglan)
Currently, there are no obvious top reversal signals in any cycle. The pullbacks in the 15-minute and 1-hour charts are normal consolidations during the upward movement, no need to panic. However, be aware: if the price approaches 69500-70000 and a large amount of selling pressure appears, along with a volume stagnation, and MACD and RSI show divergence (price makes a new high but the indicator does not), then we need to be cautious of short-term double top risks! However, as it stands, the market is still in the early stages of the trend, and the probability of a reversal is low; the bulls are still in control ~
Sister Qinglan's Trading Maxims
More quantifiable breakdowns of how real-time news impacts market sentiment have been updated in my Qinglan Crypto Classroom: www.qinglan.org
Dear sisters remember: The market is always right, but your strategy might not be! Respect the trend, control risks, do not be greedy or panic, let time help us make money, rather than hold us back ~
免责声明:本文章仅代表作者个人观点,不代表本平台的立场和观点。本文章仅供信息分享,不构成对任何人的任何投资建议。用户与作者之间的任何争议,与本平台无关。如网页中刊载的文章或图片涉及侵权,请提供相关的权利证明和身份证明发送邮件到support@aicoin.com,本平台相关工作人员将会进行核查。


