Authored by: Blockchain Knight
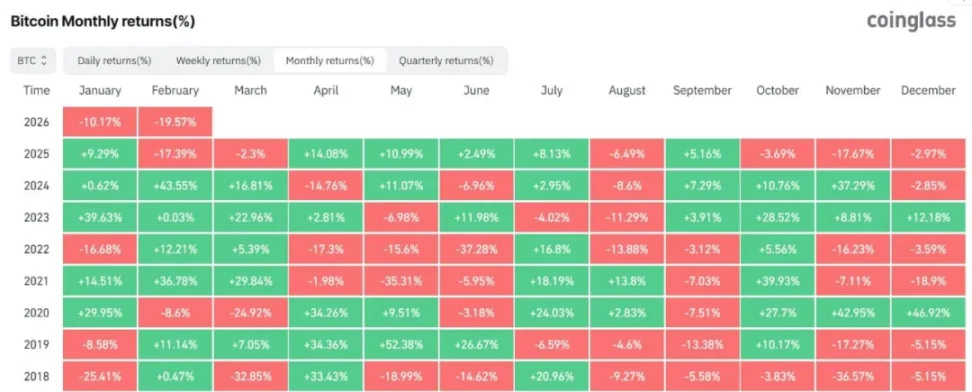
Bitcoin is approaching a concerning milestone and may close February with a decline, marking a potential fifth consecutive month of losses.
Moreover, this situation appears less of a cryptocurrency-specific decline and more of a macroeconomic-driven repricing.
This five-month decline will be noteworthy after the ETF era, representing the longest monthly downturn for Bitcoin since the bear market of 2018, when Bitcoin fell for six consecutive months.
Bitcoin's price has dropped below $63,000, falling nearly 20% this month, the largest monthly drop since June 2022.
However, the continuous price drop itself is not the main issue.
The bigger shift is in the pricing mechanism of Bitcoin, where ETF fund flows, interest rate expectations, and cross-asset risk sentiment now hold more weight than the native cryptocurrency catalysts.
As a result, Bitcoin traders are no longer focused on when the price will hit new highs.
Instead, the discussion has shifted to identifying the next lasting support level, with significant attention on the $58,000 price point.
Market Driven by ETFs and Macroeconomics
In recent weeks, Bitcoin's trading has increasingly begun to resemble that of a high-beta risk tool rather than an independent digital asset.
This distinction matters, as it alters how traders interpret market movements.
In a cryptocurrency-dominated market, narratives surrounding adoption, protocol upgrades, or long-term scarcity might dictate short-term price movements.
In the current setting, key inputs have become more familiar to macro traders, including fund flow data, options positioning, and broader risk appetite.
This shift is most evident in the behavior of ETFs.
When spot Bitcoin ETF funds are continuously flowing in, pullbacks often trigger automatic demand.
These fund flows act as a buffer, not because market sentiment has turned bullish, but because the structure of ETFs requires buying support.
Now the situation is quite the opposite. Continuous fund outflows may not only weaken support but could also become a source of supply pressure.
So far this year, net outflows from U.S. spot Bitcoin ETFs have exceeded $4.5 billion, indicating that even as parts of the market search for a bottom, institutional demand via ETFs is still under pressure.
This marks a significant shift in marginal demand and also explains why an economic rebound is hard to sustain.
Data from CryptoQuant further corroborates why spot Bitcoin ETFs have become an indispensable part of Bitcoin's price performance.
Since May 2025, daily trading volume for Bitcoin spot ETFs has surpassed the total trading volume of centralized exchanges worldwide. Currently, 55% of Bitcoin's daily trading volume comes from ETFs.
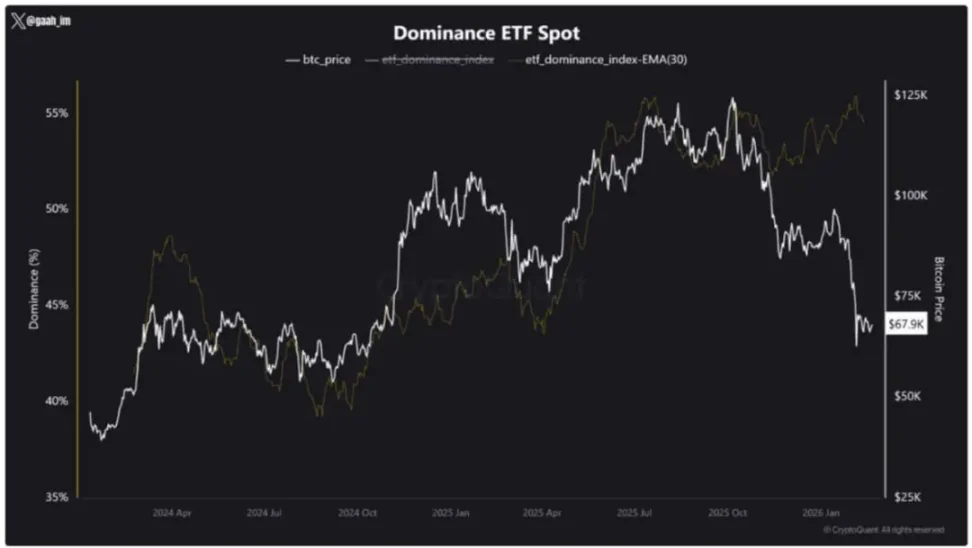
Essentially, institutional fund flows have now become the primary liquidity channel of the market, no longer just a part of it.
This alters the center of gravity of the market, as retail investors are increasingly influenced by the price discovery process dominated by Wall Street.
The result is that market movements resemble macro assets under pressure, with highs continually lowering, support levels being tested repeatedly, and the market returning to the same price areas until the market backdrop improves or a stronger bottom forms.
Why $58,000 Became a Key Pressure Test Level
The growing attention on the $58,000 price level arises not from a single chart formation, but from the convergence of multiple theoretical frameworks.
The first is the long-term technical structure. The 200-week moving average remains one of the most closely watched indicators in the Bitcoin market.
In previous bear phases and adjustments at cycle peaks, price movements nearing this level often trigger a broader reassessment, whether in corrections within an uptrend or the beginning of deeper repricing.
The second point is the gravitational pull of on-chain cost bases. Below the contentious area, traders focus on composite cost basis metrics, including anchored values like realized price types.
As Bitcoin's price starts to converge with the average embedded purchase price of holders, market behavior tends to shift.
Some investors lock in losses to reduce risk, while others enter the market because the price appears cheaper in relation to the network's historical purchase records.
The third is the demand clustering within the current range.
Recent on-chain analysis indicates competition exists between $60,000 and $69,000, with demand consistently absorbing repeated selling pressure.
If this area is clearly broken through, then $58,000 will become the next clearer reference point, positioned below the cluster and above deeper cost base anchors.
Therefore, $58,000 is best understood as a pressure test rather than an ultimate bottom line.
If the market holds this price, it could signal the beginning of a bottom formation.
If it falls below this price, market attention may quickly shift to deeper on-chain levels, such as the mid-range around $50,000.
Options Market Guiding Downside, Not Panic
Derivative data further confirms why $58,000 has become the focal point.
Data from Deribit shows that in the current range, as prices continue to decline, options market traders are betting on downside through protective trades and bearish trends.
The structure of these trades is important, as it helps explain what types of market conditions participants are preparing for.
The company states that the put skew of BTC has returned to levels seen on February 5, with implied volatility under the seven-day measure exceeding realized volatility by over 10%.
This combination indicates a strong demand for downside protection and hasn't seen a larger spot crash like that on February 5.
Demand is primarily concentrated around the $58,000 strike price.
Traders are active in $58,000 put options, put spreads, and risk reversal strategies, with the derivatives market increasingly focused around this price point as a major downward reference.
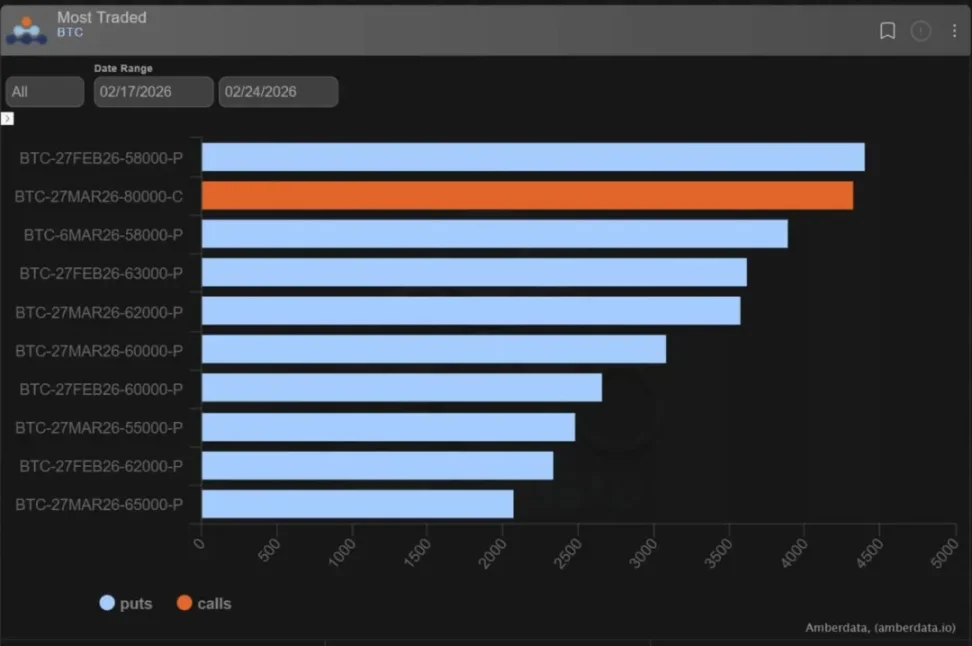
Deribit highlights that the most notable example is the addition of $58,000 put options on March 6, where approximately $200 million in notional was purchased for about $2 million in premium.
This is significant as it indicates that funds are preparing for slower volatility rather than a sudden collapse.
During bearish market periods, put spreads and risk reversal strategies may prove more effective than directly buying puts, as they can lower option premiums and extend the duration of potential trading gains.
Meanwhile, Galaxy Digital’s head of research, Alex Thorn, notes that Bitcoin is nearing historically oversold territory.
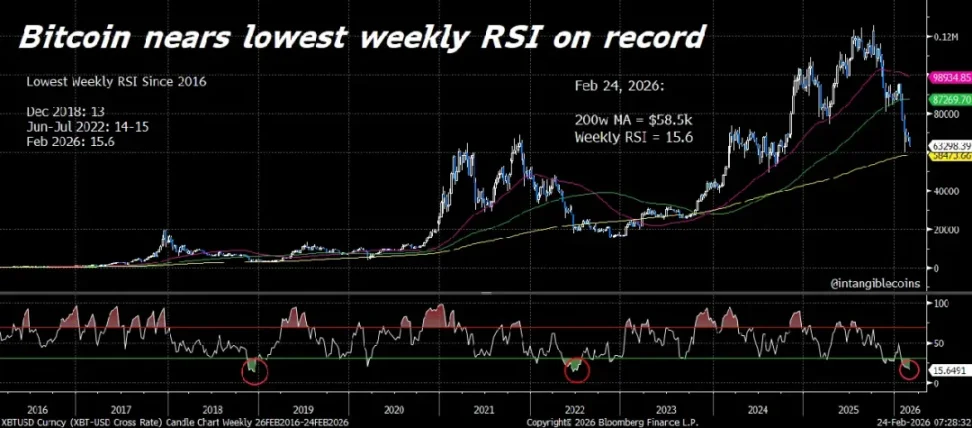
Thorn mentions that the weekly RSI is lower than during any periods he refers to as beyond the darkest phases of the bear market.
He points out that since 2016, the only lower readings occurred in November/December 2018 (when Bitcoin fell from around $6,000 to $3,000) and June/July 2022 (when Three Arrows Capital collapsed, and signs of Genesis bankruptcy were still unclear).
This does not guarantee a market rebound, but it does indicate that the current market structure has statistically become oversold, even if the market still needs catalysts to stabilize.
On-Chain Data Shows Deeper Pain Points and Supports
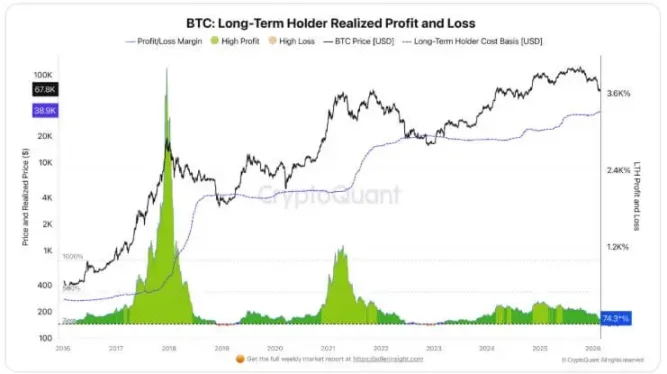
Long-term holder data provided by CryptoQuant adds another layer of meaning to the market's decision tree.
The company states that long-term holders (LTHs) are generally less sensitive to short-term price fluctuations, with their average profit still around 74%.
This means this group has not yet faced widespread pressure, but as spot prices decline, their profit margins are shrinking.
CryptoQuant estimates the cost basis for LTHs to be around $38,900, a figure that has been rising as short-term holders who bought at higher prices gradually transition to long-term holders.
In other words, the pain threshold is not fixed but increases with the cycle.
CryptoQuant notes that historically, bear markets are typically characterized by prices falling below the LTH cost basis, followed by an eventual capitulation phase marked by about a 20% actual loss.
This thorough transformation can often eliminate leverage, thus allowing for a more enduring rebuilding.
CryptoQuant cautions that this is based on a limited number of observations. This premise is crucial, especially in the current cycle.
The ownership structure of Bitcoin has changed. Institutions, corporate entities, and sovereign actors now play a larger role than in previous cycles.
These participants bring different mandates, time horizons, and liquidity conditions, and these structural changes could alter market behavior around traditional on-chain pain points.
This is also one of the reasons why the price range of $50,000 to $60,000 is so important.
It could be the area where old cycle patterns meet new cycle market structures, allowing traders to discover whether institutional participation will mitigate pullbacks or merely amplify them through ETF flows and macro-sensitive positions.
The Next Steps Depend on Whether the Market Can Repair Itself
To clearly describe Bitcoin's movement by the end of the month, it should be viewed as a series of pathways rather than a single prediction.
The basic expectation is for organized oscillations. Bitcoin will continue to trade within the competitive range of $60,000 to $69,000, experiencing severe intraday fluctuations without decisive breakthroughs.
February's close in the red will formally establish a consecutive five-month decline, with the market viewing this as a reset rather than a collapse.
This pathway will likely require a sustained slowdown in ETF outflows, alleviation of spot selling pressure, and the options market to maintain a defensive posture and avoid new volatility surges.
The bearish scenario is mechanical selling. A break below the $60,000 demand zone will trigger stop-loss orders and systematic selling, leading prices to test $58,000.
If the 200-week EMA fails to attract sufficient demand, attention will shift to deeper cost basis anchor points in the mid-$50,000 range.
In this case, the catalysts may not be crypto-specific shocks but rather the continuous decline of ETFs, the overall weak risk sentiment in the market, and the derivatives market consistently paying high premiums for downside protection.
The bullish driver is fund flow. If Bitcoin retains its current demand zone, ETF fund flows stabilize and eventually turn positive, and option skews begin to normalize.
This would allow prices to rise back to higher on-chain averages associated with more expansive economic conditions.
In this scenario, the end of winning streaks is not due to an immediate improvement in market sentiment but because marginal buyers are returning.
免责声明:本文章仅代表作者个人观点,不代表本平台的立场和观点。本文章仅供信息分享,不构成对任何人的任何投资建议。用户与作者之间的任何争议,与本平台无关。如网页中刊载的文章或图片涉及侵权,请提供相关的权利证明和身份证明发送邮件到support@aicoin.com,本平台相关工作人员将会进行核查。


