The daily chart continues to frame the broader narrative: stabilization within a descending structure. Price remains below the prior peak near $97,900 and is oscillating between $68,000 and $70,000, reflecting balance rather than breakout conditions. Major support stands at $60,000 to $62,000, with intermediate support at $66,500 to $68,000. Overhead, $72,000 to $75,000 remains the primary resistance band, and only a decisive daily close above $75,000 would invalidate the prevailing macro structure. Until then, the bias is cautious. This is digestion, not ignition.
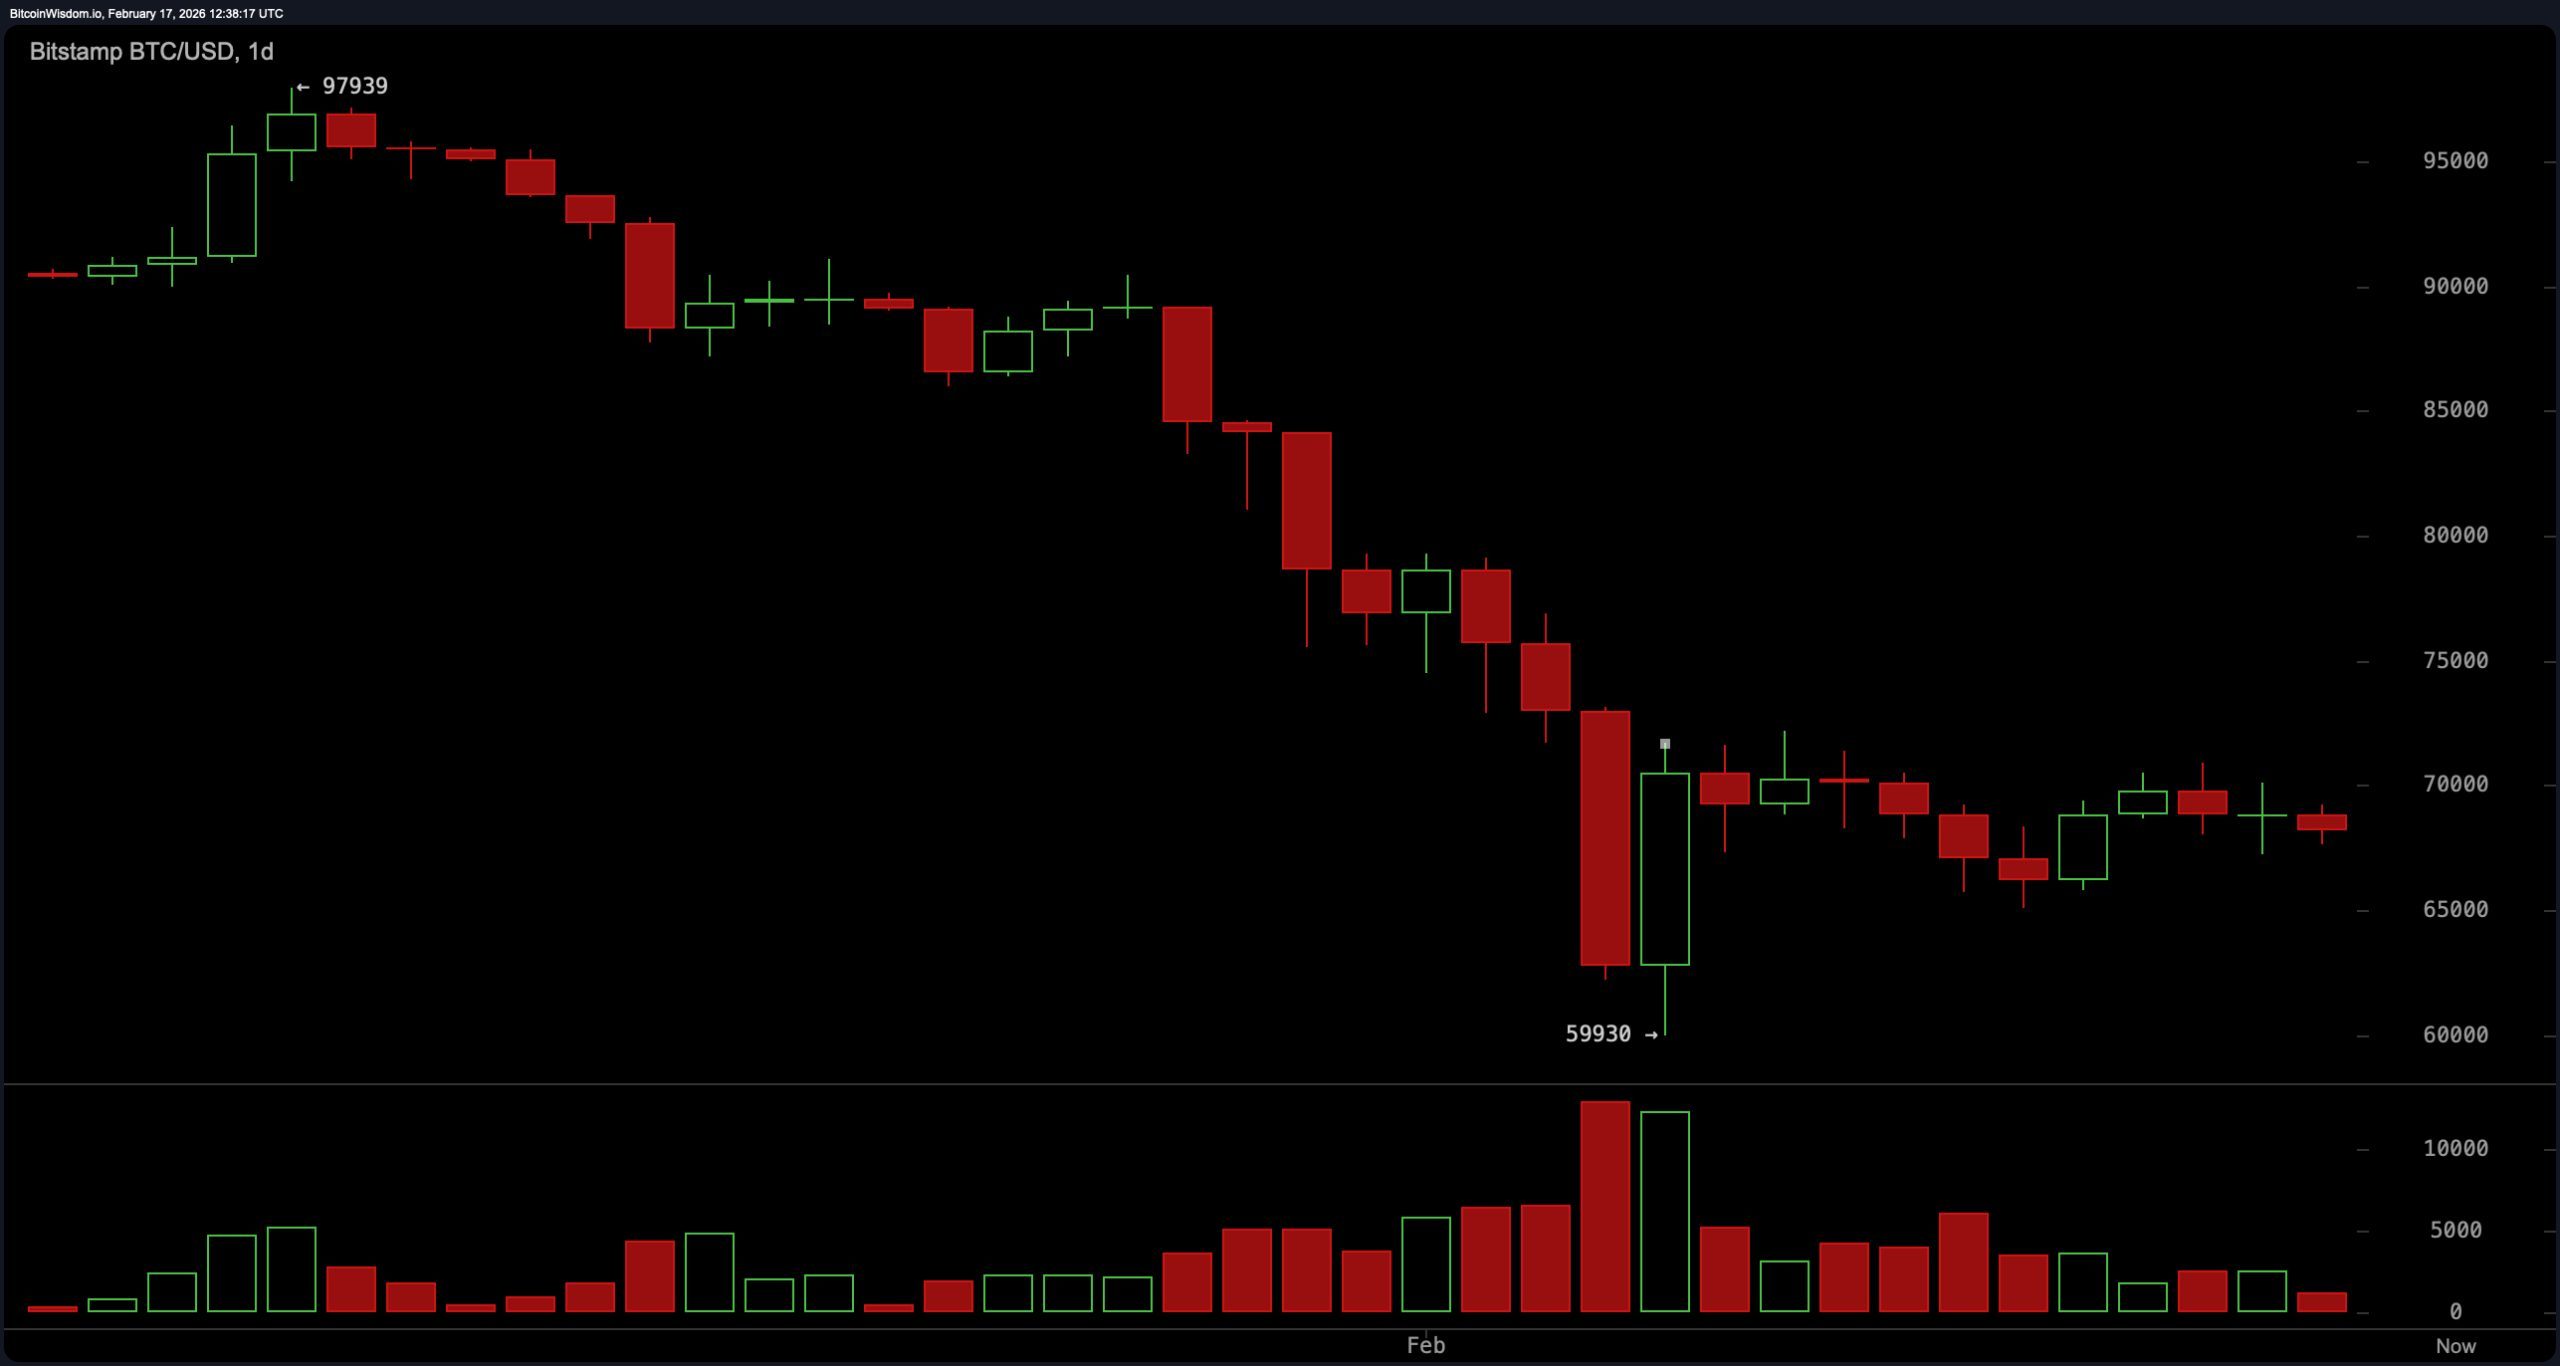
BTC/USD 1-day chart via Bitstamp on Feb. 17, 2026.
On the four-hour chart, bitcoin is fluctuating within a defined range following its vigorous recovery from the $60,000 threshold. A sequence of descending peaks is emerging, gradually compressing price action into lateral consolidation. Volume has diminished during upward attempts, signaling limited conviction behind rallies. The defined trade zones remain clear: support between $66,500 and $68,000 and resistance between $72,000 and $73,000. Mean-reversion dynamics dominate this time frame, as neither side has delivered the decisive expansion required to shift structure. In plain terms, this is a range trader’s playground — not a breakout artist’s stage.
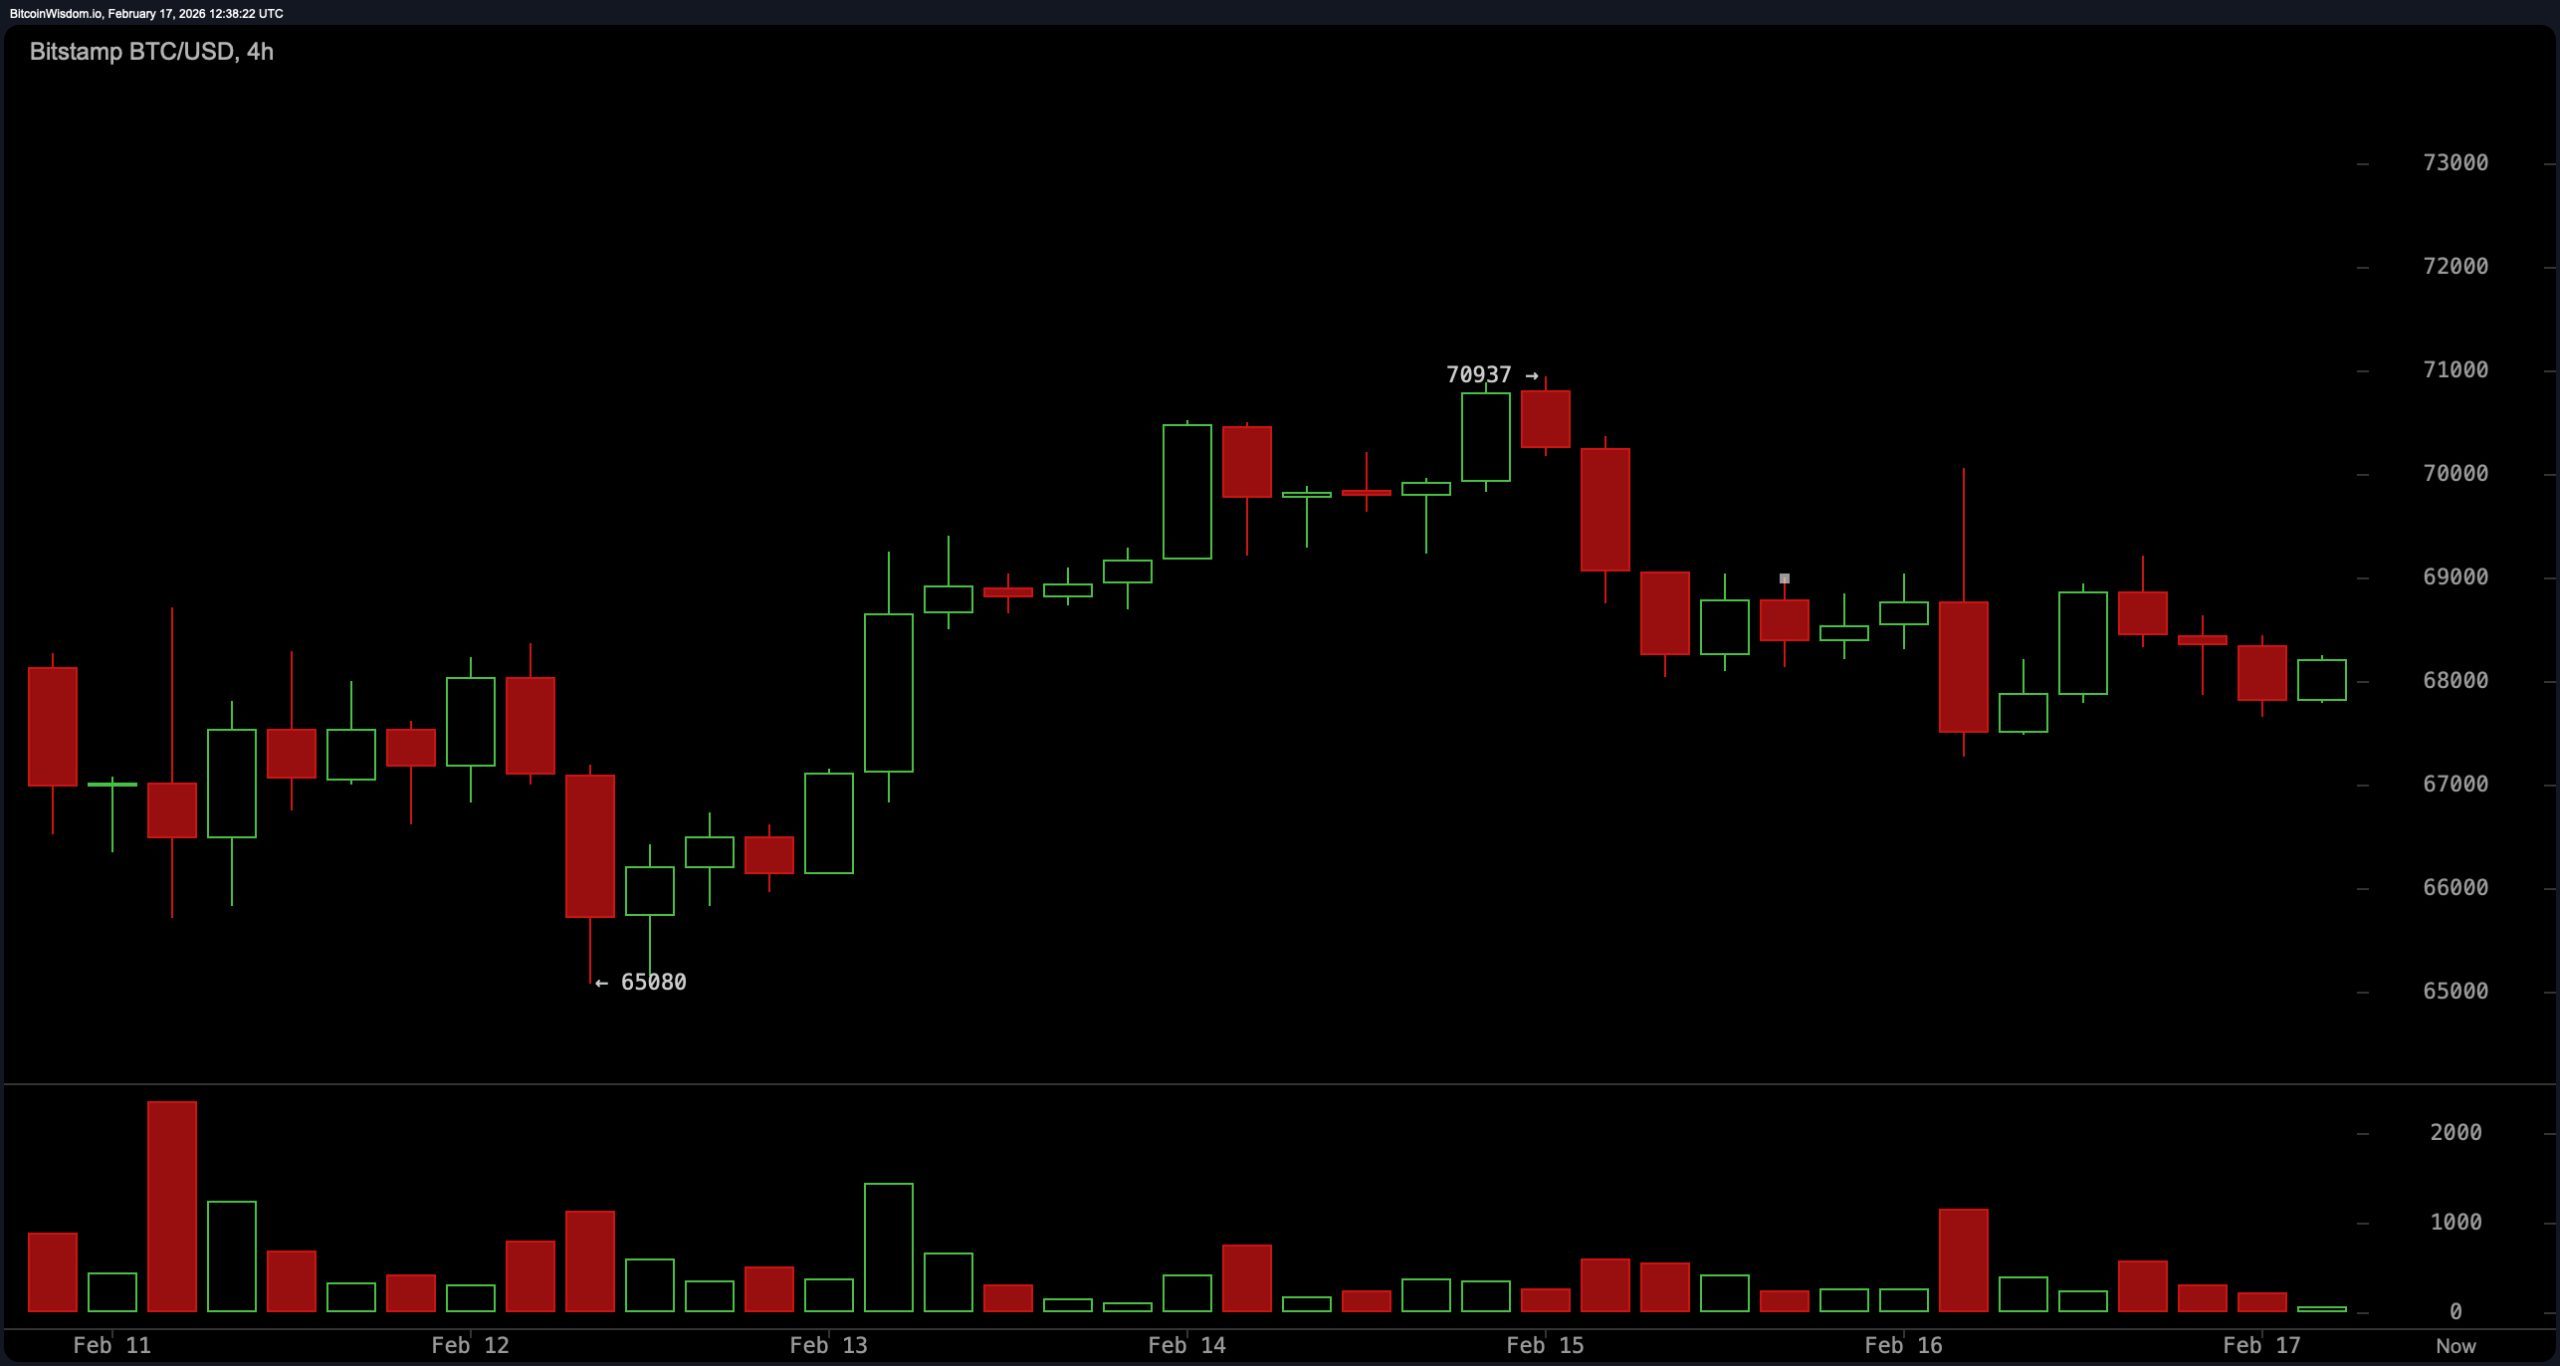
BTC/USD 4-hour chart via Bitstamp on Feb. 17, 2026.
The one-hour chart leans softer. Descending peaks and marginal new lows characterize the short-term trend, while momentum appears subdued. Recoveries have been corrective in nature rather than impulsive, reinforcing the idea that intraday strength lacks sustained follow-through. The $68,000 to $68,500 zone has functioned as a bounce area, while failed recoveries near $70,500 to $71,000 have attracted renewed pressure. Sellers maintain influence over intraday flows, and until that sequence of lower highs is disrupted, the short-term structure remains tactically fragile.
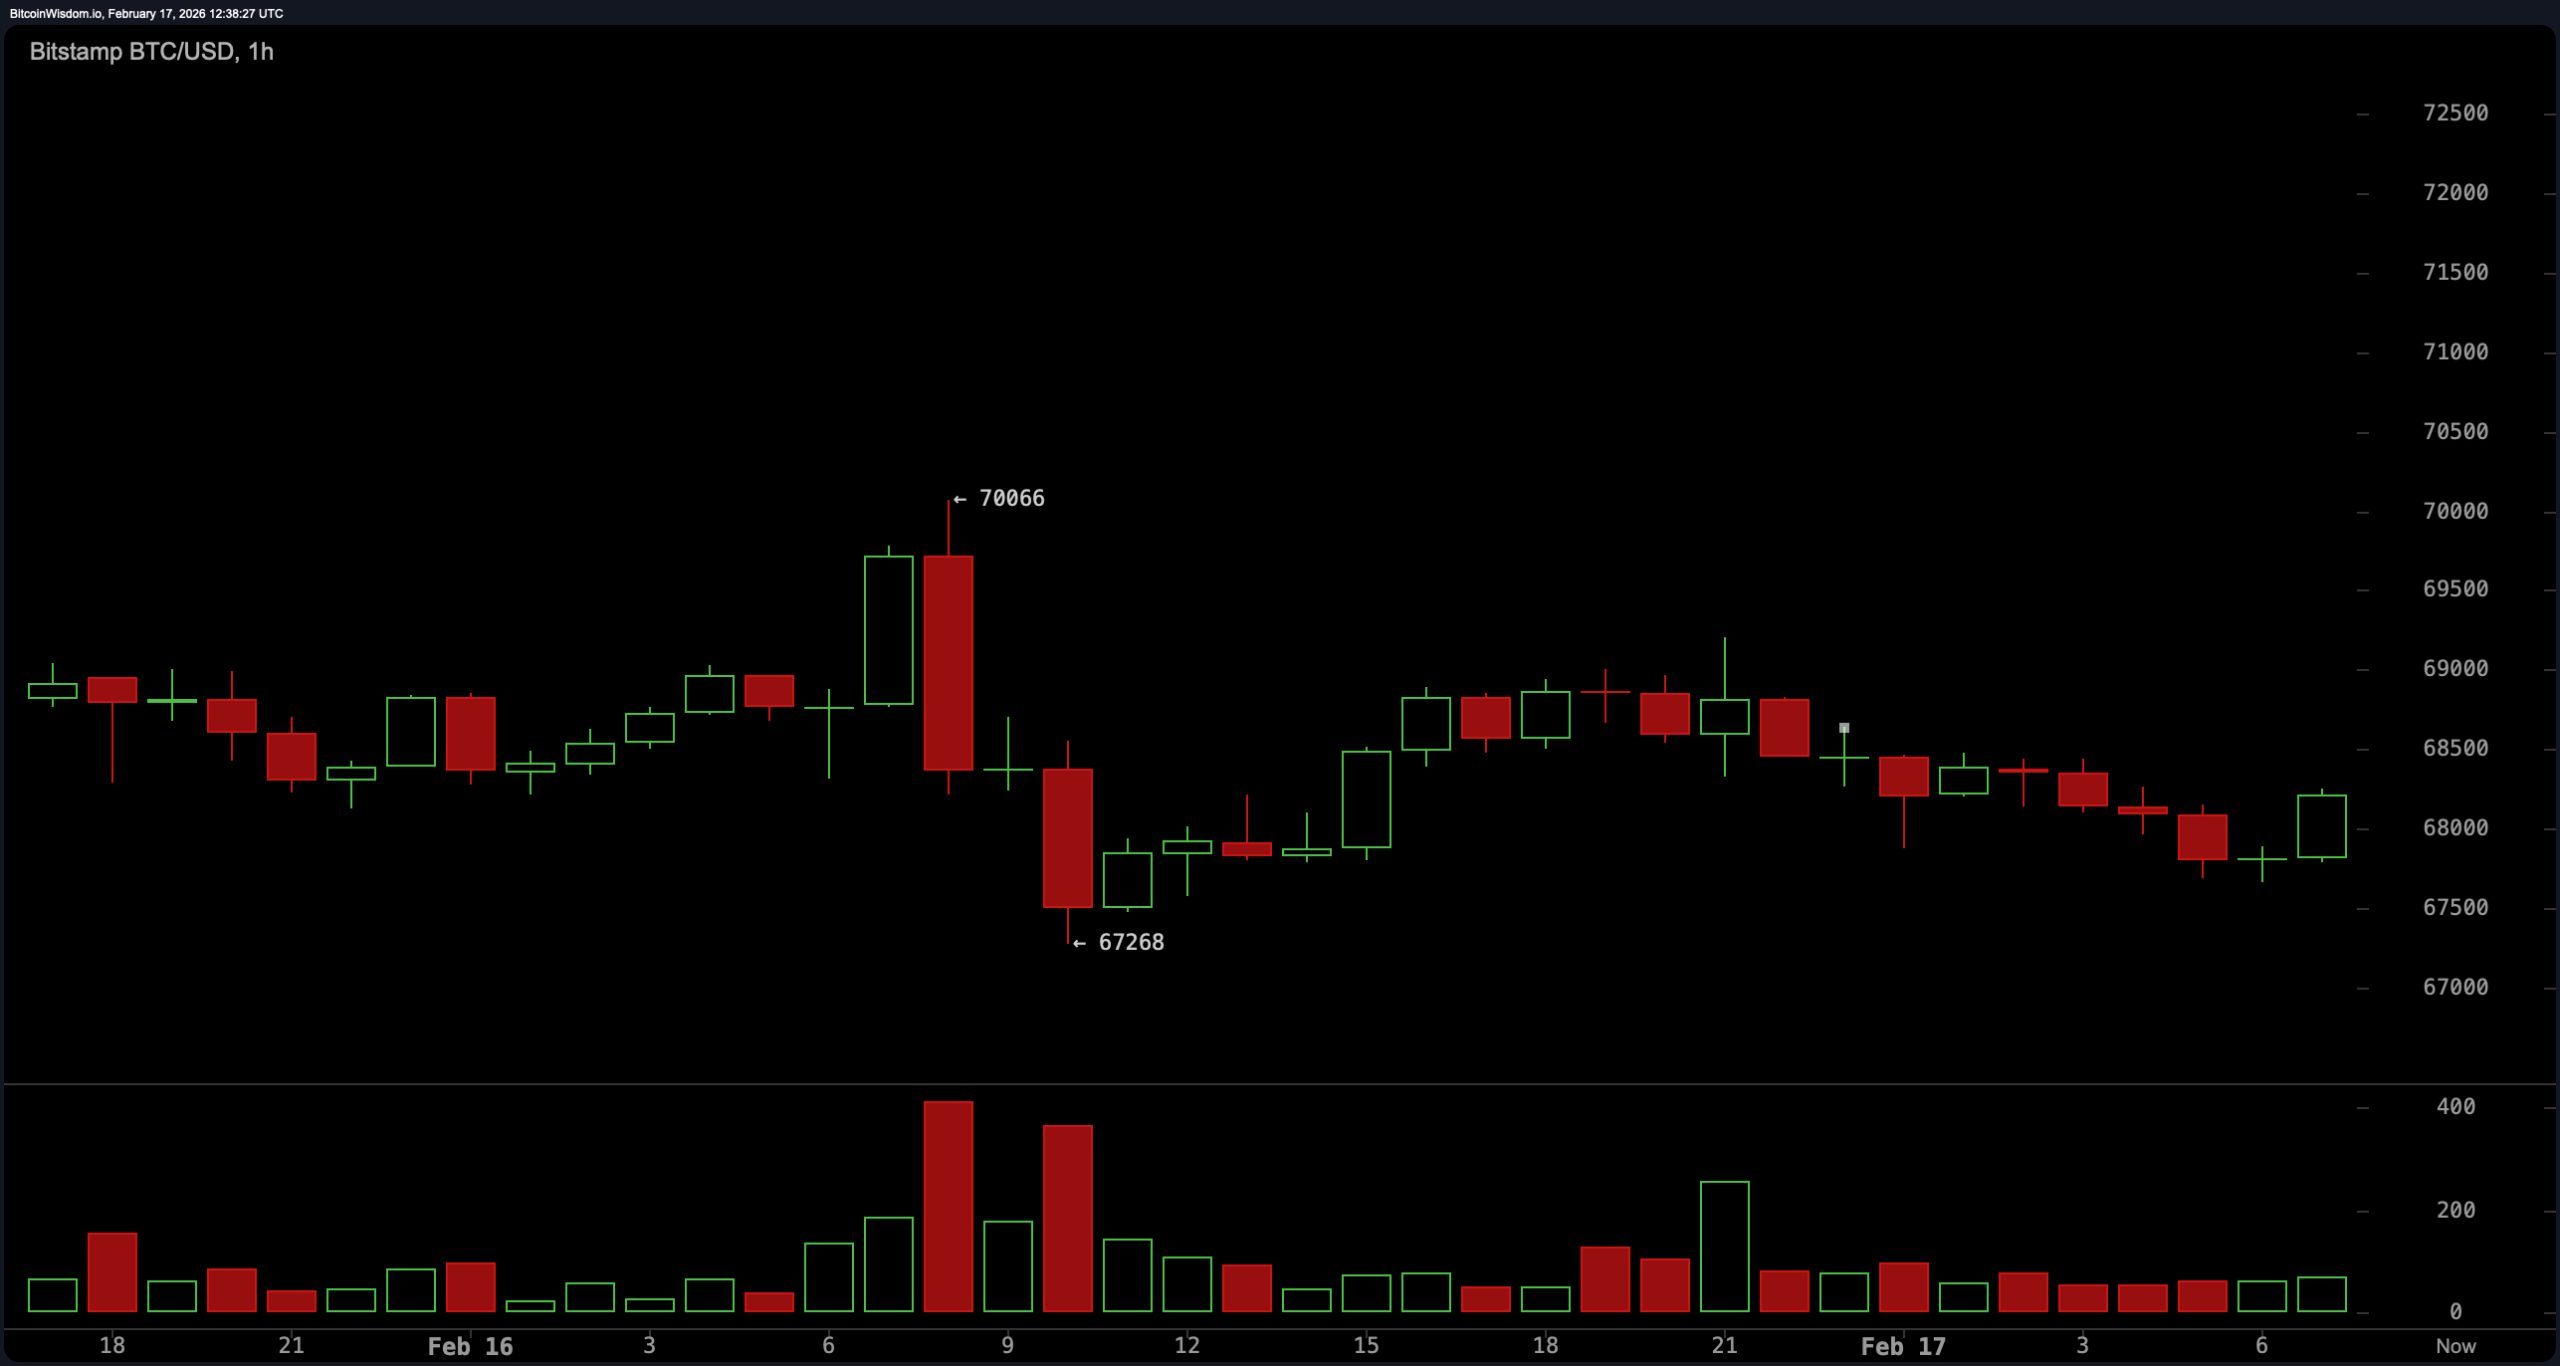
BTC/USD 1-hour chart via Bitstamp on Feb. 17, 2026.
Oscillators reflect a market in equilibrium rather than exhaustion. The relative strength index ( RSI) at 36, Stochastic at 48 and commodity channel index (CCI) at negative 47 all register neutral readings. The average directional index (ADX) at 57 signals strong trend conditions, though not necessarily directional clarity. The Awesome oscillator prints negative 11,127, while momentum at negative 453 and the moving average convergence divergence ( MACD) level at negative 4,643 show constructive signals within the report’s framework. Internally, there are flickers of stabilization — but no fireworks.
Moving averages (MAs) continue to lean heavy. The exponential moving average (EMA) (10) at $69,519 contrasts with the simple moving average (SMA) (10) at $68,739. The EMA (20) at $72,810 and SMA (20) at $72,074 reinforce near-term overhead resistance, while the EMA (50) at $80,180 and SMA (50) at $83,491 sit well above the current price. Higher still, the EMA (100) at $87,067 and SMA (100) at $86,987, along with the EMA (200) at $93,608 and SMA (200) at $100,105, underscore the broader technical gravity bitcoin must eventually overcome.
Bull Verdict:
A decisive four-hour close above $72,500 with expanding participation would shift short- and mid-term structure, opening the door toward the $72,000 to $75,000 resistance corridor and challenging the descending framework on the daily chart. Sustained strength above $75,000 would invalidate the broader bearish structure and signal that compression has resolved to the upside.
Bear Verdict:
A breach of $66,000 would confirm weakening support on the lower time frames and expose bitcoin to a move back toward the $60,000 to $62,000 major support zone. Failure to defend that corridor would reinforce the prevailing descending formation on the daily chart and extend the current corrective phase rather than conclude it.
- What is bitcoin’s price on Feb. 17, 2026? Bitcoin is trading at $68,827.93, consolidating between key support at $66,500 and resistance near $72,000.
- Is bitcoin bullish or bearish right now? Bitcoin remains range-bound within a descending structure, with cautious bias until a decisive break above $75,000 or below $66,000.
- What are the key bitcoin support and resistance levels? Major support sits at $60,000 to $62,000, while major resistance stands between $72,000 and $75,000.
- What would confirm bitcoin’s next breakout? A strong four-hour close above $72,500 or a breakdown below $66,000 would signal the next directional move.
免责声明:本文章仅代表作者个人观点,不代表本平台的立场和观点。本文章仅供信息分享,不构成对任何人的任何投资建议。用户与作者之间的任何争议,与本平台无关。如网页中刊载的文章或图片涉及侵权,请提供相关的权利证明和身份证明发送邮件到support@aicoin.com,本平台相关工作人员将会进行核查。


