
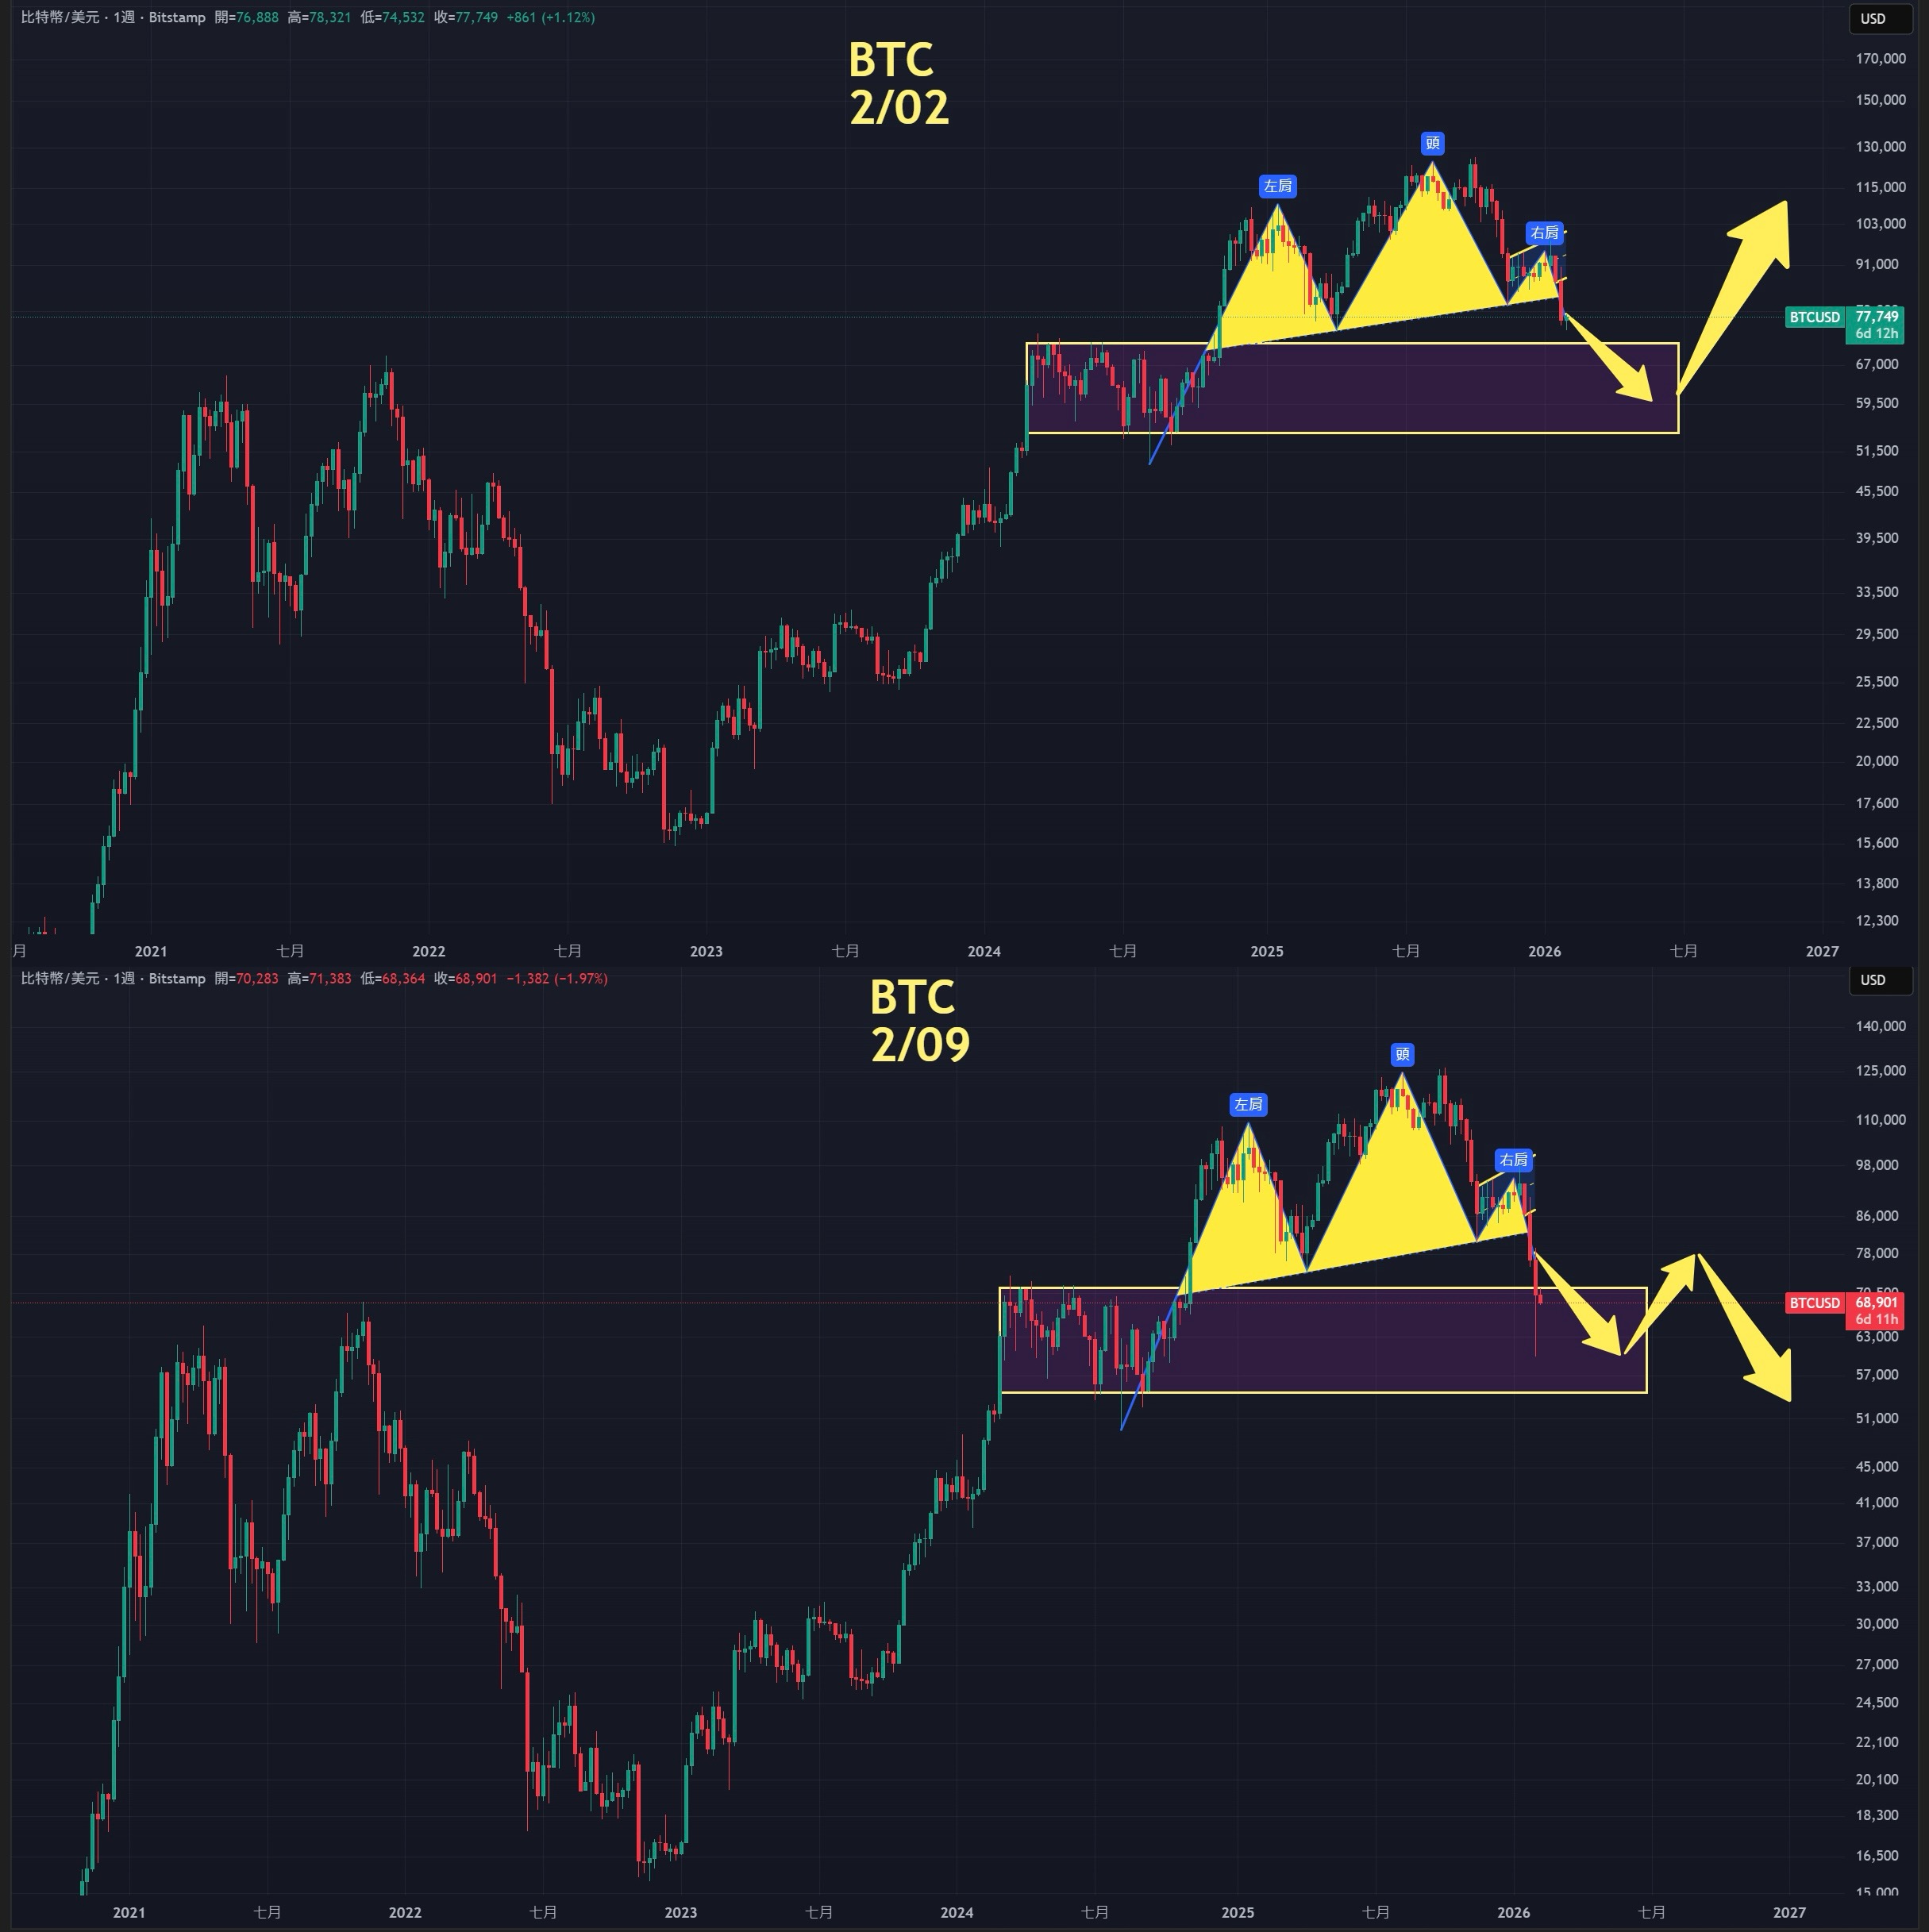
Since the false breakout at 98,000, Bitcoin has replicated the Spring Festival market of 21 years ago, plummeting by 37,000 points, a direct drop of 38%. The market analysis on the 2nd indicated that the decline is not yet over, with the entire weekly and monthly charts forming a head and shoulders pattern. If a proportional decline occurs, the probability of dropping to 50,000 to 60,000 increases, with the Coinbase price directly reaching 60,000. After a significant drop, a short-term rebound of over 10,000 points occurred, indicating that this is a phase bottom with support. After a second test, the rebound target is seen in the range of 74,500 to 79,000, and after the rebound, it will continue to decline.
Since 126,000, there has been a 52% drop. If we follow the previous bear market decline of 75-80%, the lowest could be between 25,000 to 36,000, which could be a good opportunity for medium to long-term bottom fishing. Currently, it is still testing the support of the 50,000 to 60,000 dense trading area.
The U.S. stock market is still fluctuating at high levels, with short-term corrections, but it has not yet entered a unilateral decline. However, the market is teetering on the edge, and the trend of an impending storm is becoming increasingly obvious. The unresolved issues in the U.S. stock market remain a hidden danger; as for gold and silver, the characteristics of a phase top or historical top are becoming more apparent, with a short-term bias towards a rebound, but after the rebound, it will continue to decline.
Bitcoin
The weekly and monthly M head has broken down. If there is a strong rebound afterward, it will test the pressure zone of 74,500 to 79,000.
The daily line shows a volume increase in the decline and a pin bar formation, which still has strength. Those who did not bottom out previously can wait for a second test; the rebound still needs to be exited.
Support: 60,000
Resistance: 74,500—79,000
Ethereum
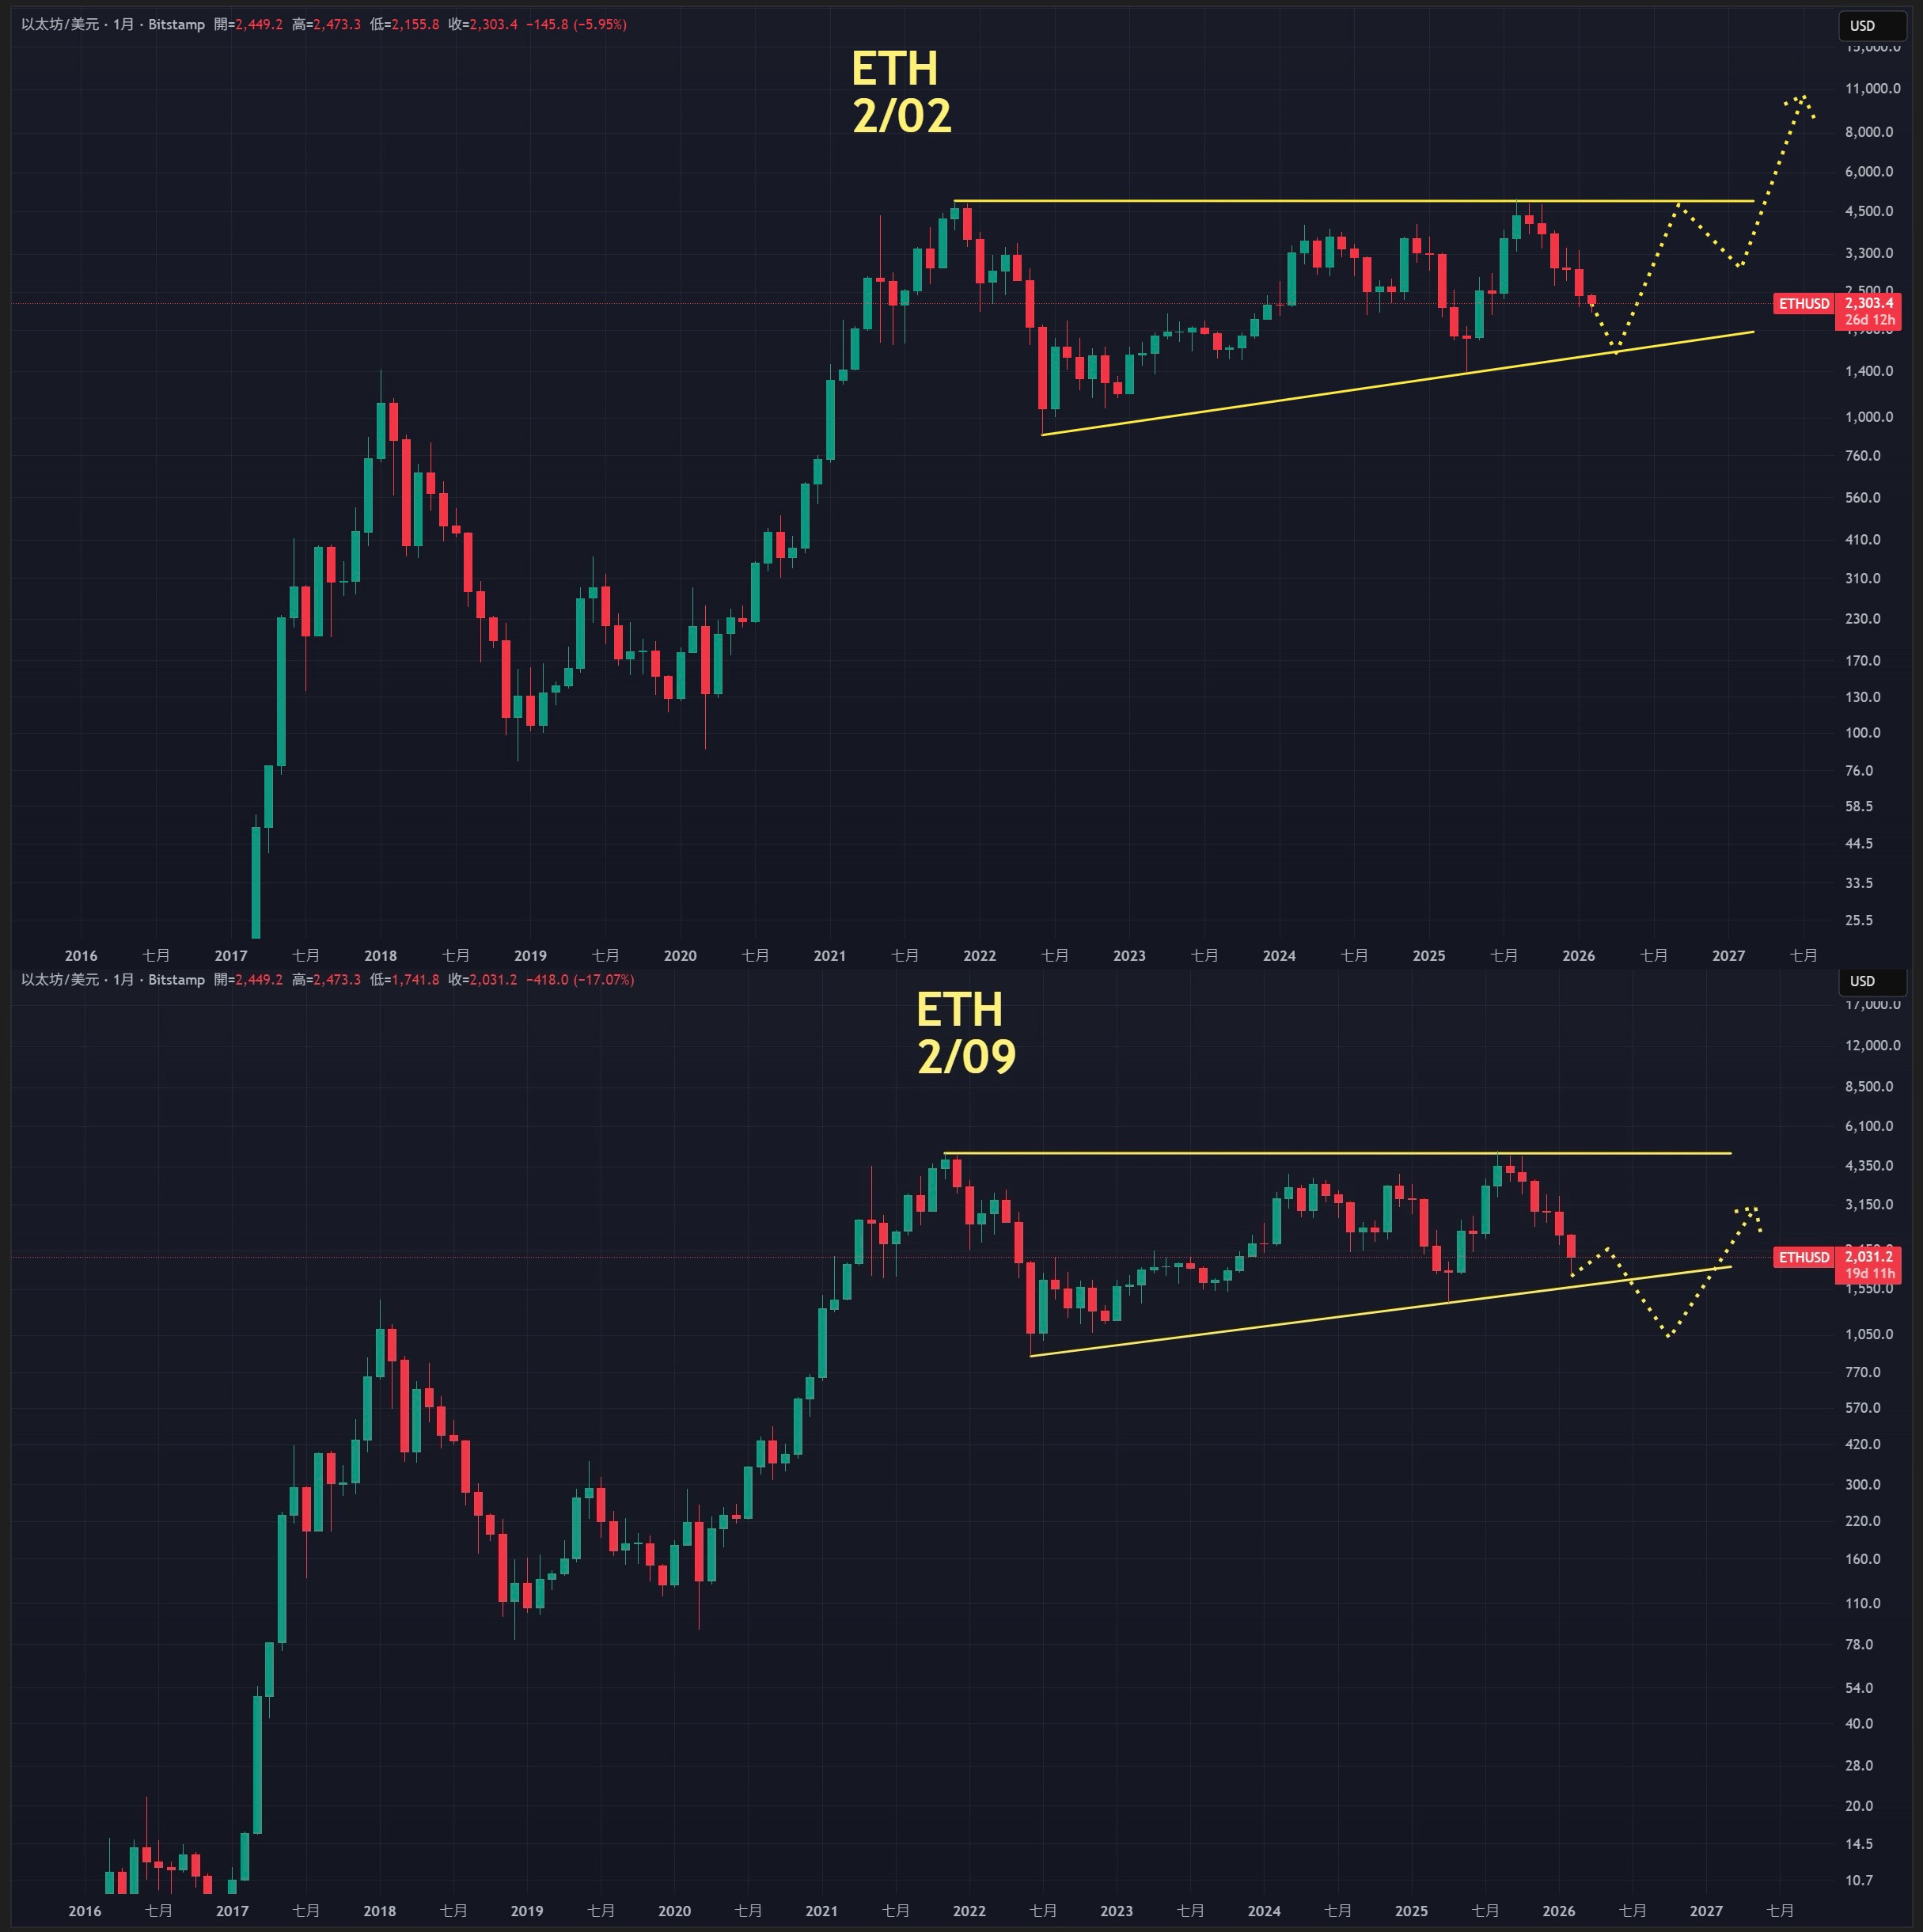
The monthly line is still under the influence of MACD, with the overall trend still bearish. The daily line shows a pin bar with volume, and the next resistance to watch for the rebound is 2,400—2,600.
The weekly line has dropped to the lower edge of a converging triangle, which has support. If we follow the decline of Bitcoin in the bear market, Ethereum may replicate the 21-year decline, directly starting with three-digit and four-digit numbers. However, the next rebound is also expected to be quite strong.
Support: 1,747
Resistance: 2,380—2,575
If you like my views, please like, comment, and share. Let's navigate through the bull and bear markets together!!!
This article is time-sensitive and for reference only, updated in real-time.
Focusing on K-line technical research, sharing global investment opportunities. Public account: BTC Trading Prince Fusu

免责声明:本文章仅代表作者个人观点,不代表本平台的立场和观点。本文章仅供信息分享,不构成对任何人的任何投资建议。用户与作者之间的任何争议,与本平台无关。如网页中刊载的文章或图片涉及侵权,请提供相关的权利证明和身份证明发送邮件到support@aicoin.com,本平台相关工作人员将会进行核查。