Bitcoin One-Hour Market Analysis
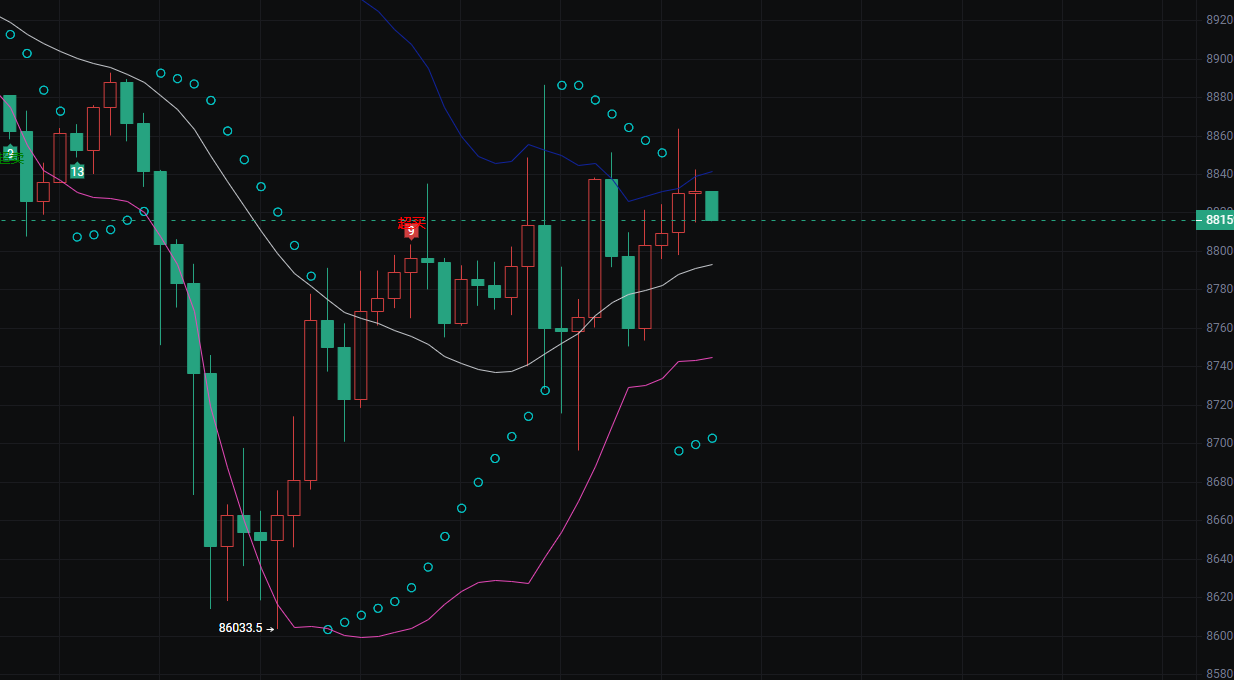
The price has rebounded from the lowest point of 86033.5 and is currently around 88178.9, in a high-level consolidation phase after a recent rebound.
The previous rapid decline has been mostly recovered by the rebound, with the short-term trend shifting from weak to strong, but it has temporarily entered a state of fluctuation.
2. Indicator Signals
White Moving Average: The price is running above the moving average, indicating that short-term bullish strength is dominant, but it is close to the moving average, and the support strength is currently average.
Blue Upper Trend Line: Previously suppressed the price, and the current price is close to this position. If it can break through, it will open up further upward space; otherwise, it may encounter resistance and fall back.
Purple Lower Trend Line: Turning upwards from a low position, indicating that the medium-term downward momentum has exhausted, which is a signal of warming trend.
Scatter Indicator: After a dense scatter at low levels, it is now diverging upwards. Currently, the number of high-level scatters is beginning to decrease, suggesting that short-term bullish momentum has weakened.
3. K-Line Patterns
Recent K-lines show alternating red and green with small bodies, indicating that both bulls and bears have increased divergence at the current price level, with no clear directional consensus.
This high-level fluctuation pattern is typically a power accumulation phase before choosing a direction.
4. Support and Resistance
Support Level: The lower level of 86772.3 is the lower edge of the recent fluctuation range and is also an important support; followed by the previous low of 86033.5.
Resistance Level: The upper blue trend line (around 88600) is direct resistance; further resistance is at the previous high of around 89200.
Ethereum One-Hour Market Analysis
1. Trend and Price Position
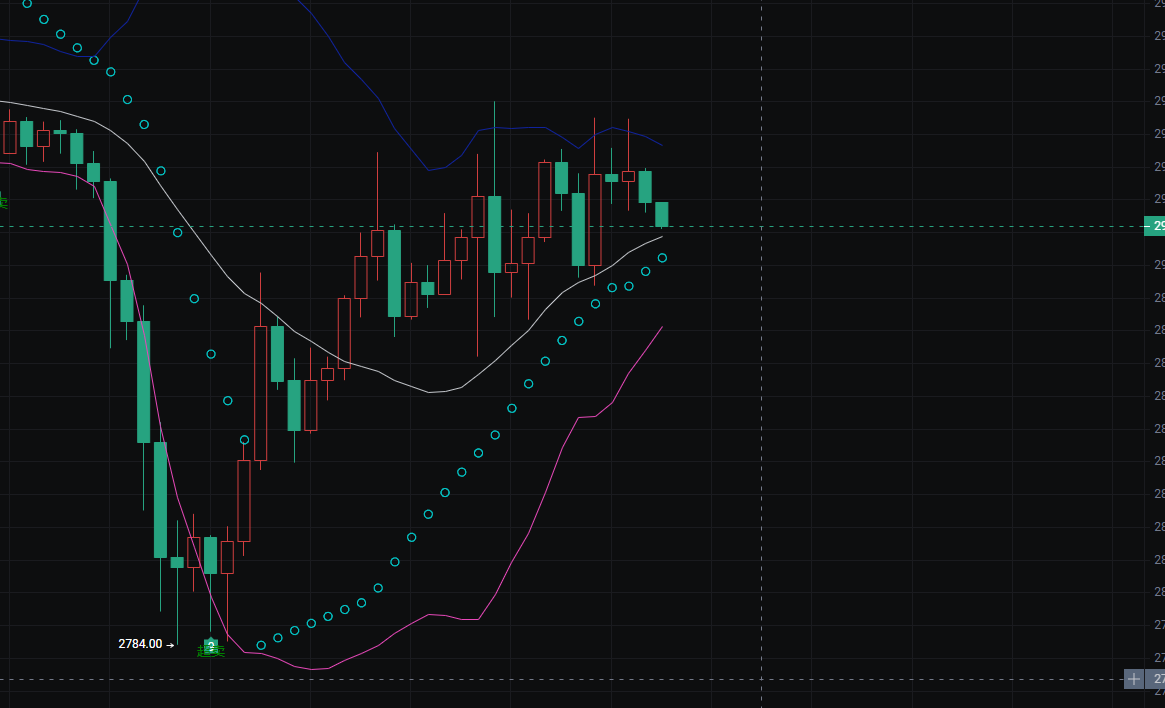
The price has completed a strong rebound from the lowest point of 2784.00 and is currently in a high-level consolidation phase around 2910.
The previous deep V rebound has reversed the short-term downward trend, but current bullish momentum has weakened, entering a phase of fluctuation to choose a direction.
2. Indicator Signals
White Moving Average: The price is running above the moving average, and the short-term bullish pattern has not been broken, but the K-line is starting to approach the moving average, and the support strength has weakened.
Blue Upper Trend Line: Previously suppressed the price, and the current price is close to this position. If it cannot break through, it may trigger a pullback.
Purple Lower Trend Line: Continuously turning upwards from a low position, indicating that the medium-term downward momentum has exhausted, which is a signal of warming trend.
Scatter Indicator: After a dense scatter at low levels, it is now diverging upwards. Currently, the number of high-level scatters is decreasing, suggesting that short-term bullish strength is diminishing.
3. K-Line Patterns
Recent K-lines show alternating red and green with shrinking bodies, indicating that both bulls and bears have significant divergence at the current price level, with no dominant force temporarily.
This high-level fluctuation is a typical power accumulation pattern, and the subsequent breakout direction will determine the short-term trend.
4. Support and Resistance
Support Level: The lower range of 2880-2900 is important support, followed by the previous low of 2784.00.
Resistance Level: The upper blue trend line (around 2940) is direct resistance, and further resistance is at the previous rebound high of around 2950.
Daily, at irregular times, internal channels share more real-time trading strategies. If you have no direction in long-term operations or have been losing for a long time, contact the teacher in the Telegram channel—Big Bear https://t.me/BTDX9045
免责声明:本文章仅代表作者个人观点,不代表本平台的立场和观点。本文章仅供信息分享,不构成对任何人的任何投资建议。用户与作者之间的任何争议,与本平台无关。如网页中刊载的文章或图片涉及侵权,请提供相关的权利证明和身份证明发送邮件到support@aicoin.com,本平台相关工作人员将会进行核查。