Liying in the Cryptocurrency Circle: Bitcoin (BTC) Latest Market Analysis
Article Published on 2026.1.18-----00:30
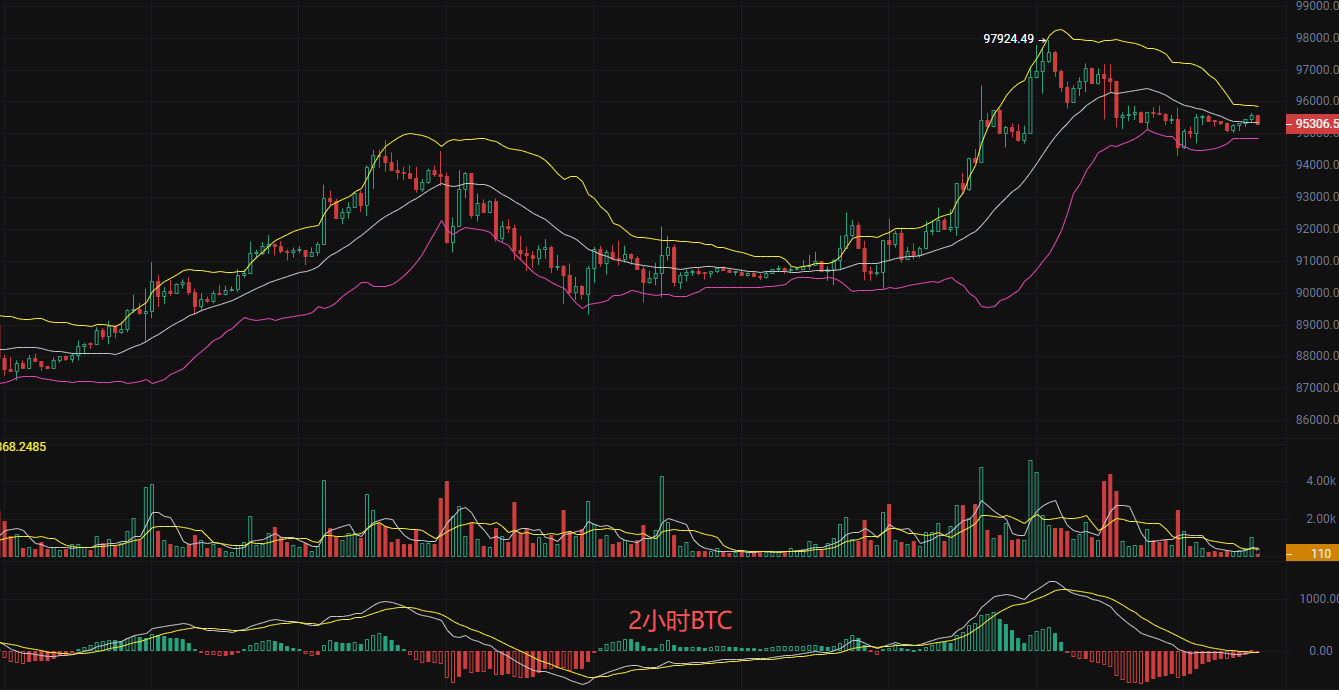
The current price of Bitcoin is 95,300. Liying mentioned yesterday that there is a demand for a short-term pullback, and the focus remains on high volatility. Currently, the daily chart is oscillating at a high level, with two consecutive days of bearish closes, indicating fierce competition for volatility in the short term. The 2-hour K-line shows a slight pullback trend, with high points gradually declining, while low points have not clearly broken down. The MACD on the 2-hour chart shows a short-term bullish dominance, but the strength is weakening. The main force is close to EMA7, slightly below EMA30 but far above EMA120. What does this indicate? It suggests that there is short-term adjustment pressure, but the long-term trend remains bullish, and the medium-term still shows a tendency for a pullback. The strategy is to focus on high volatility for short-term trades, entering and exiting quickly.
Short-term Reference:
- For bullish positions at 94,000 and 93,500, exit if it falls below 93,000, targeting above 95,500 aiming for 96,500.
- For bearish positions at 96,000 and 97,000, exit if it falls below 97,500, targeting below 95,500 aiming for 94,500.
Ethereum (ETH) Latest Market Analysis
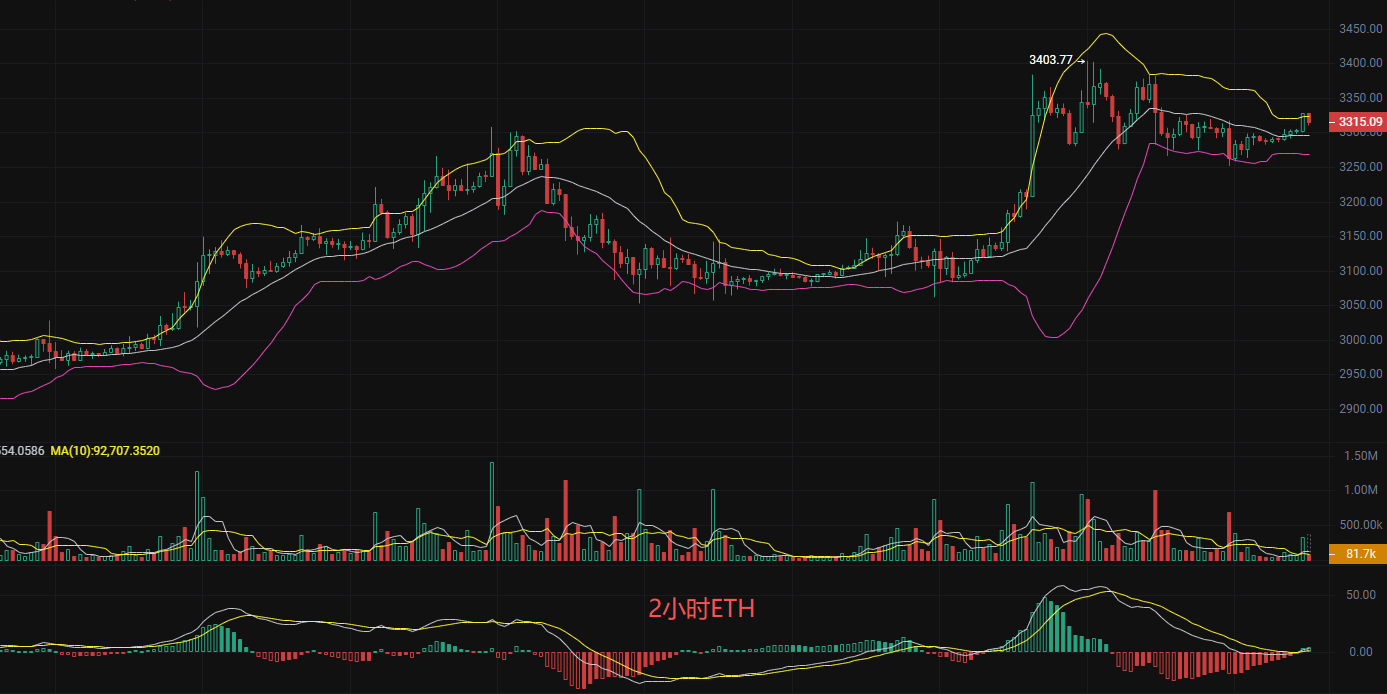
Before publication, the current price of Ethereum is 3,313. Liying's strategy remains unchanged; the market is still consolidating around 3,300 without providing entry opportunities, so there is no rush. Currently, the daily chart is oscillating around 3,300, having experienced a rapid rise followed by a pullback, and is now in a high-level consolidation phase. The 2-hour K-line has formed a slight upward trend, with high points gradually increasing, but the upward momentum has weakened in the short term. The MACD on the 2-hour chart shows a weakening bullish force; however, the daily MACD remains positive, indicating bullish dominance. The main force has broken through EMA7, EMA30, and EMA120, with short-term, medium-term, and long-term moving averages showing a bullish arrangement, providing strong support. However, Liying has some doubts as the trading volume has significantly decreased compared to previous days, indicating a lack of willingness to chase prices at high levels. The atmosphere created is bullish without volume support, which can only be described as artificially high. Liying still insists on the main theme of high volatility.
Short-term Reference:
- For bullish positions at 3,290 and 3,250, exit if it falls below 3,230, targeting above 3,350 aiming for 3,400.
- For bearish positions at 3,350 and 3,400, exit if it falls below 3,420, targeting below 3,250 aiming for 3,200.
The above content is exclusively original by Liying; please indicate the source when reprinting! Article publication review may have delays, and market conditions change rapidly. The above suggestions are for reference only, and risks are to be borne by the reader. I hope Liying's insights will be helpful to you!

The content of the article is time-sensitive and for reference only; risks are to be borne by the reader.
免责声明:本文章仅代表作者个人观点,不代表本平台的立场和观点。本文章仅供信息分享,不构成对任何人的任何投资建议。用户与作者之间的任何争议,与本平台无关。如网页中刊载的文章或图片涉及侵权,请提供相关的权利证明和身份证明发送邮件到support@aicoin.com,本平台相关工作人员将会进行核查。