📊 Ethereum One-Hour Level Market Chart Analysis
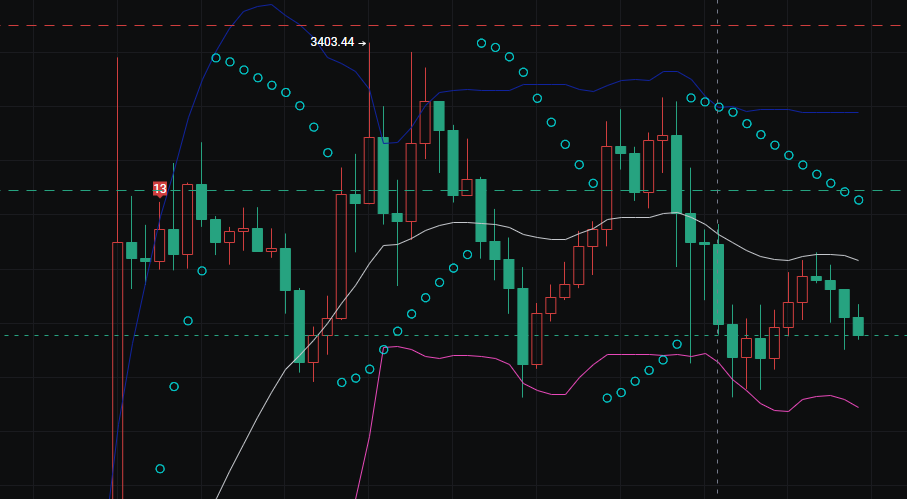
- Trend and Price Structure Overall Trend: After the price surged to a high of 3403.44, it has shown a clear downward trend, with the recent K-line center of gravity continuously moving downwards, indicating a phase of correction.
Support and Resistance:
Upper Resistance: Previous high of 3403.44 and the area of the blue moving average (Bollinger Band upper band).
Lower Support: Attention can be paid to the support strength near the previous low and the purple moving average (Bollinger Band lower band).
- Indicator Signals Bollinger Band: The price has fallen from the Bollinger Band upper band and is currently between the middle band and lower band, with signs of the Bollinger Band opening narrowing, indicating a decrease in short-term volatility.
Moving Average System: The price has fallen below the white moving average (Bollinger Band middle band), and the short-term moving averages are showing a downward trend, further confirming a short-term weak pattern.
K-line Pattern: Recently, a combination of K-lines dominated by multiple bearish candles has appeared, with weak rebound strength, indicating that bearish forces are prevailing at this stage.
- Subsequent Trend Projection Bearish Scenario: If the price cannot effectively stabilize above the white moving average (middle band), it is likely to continue to test the support of the lower purple moving average (lower band) and the previous low.
Bullish Scenario: If it can quickly recover above the white moving average (middle band) and stabilize, it may trigger a technical rebound, challenging the resistance of the upper blue moving average (upper band).
🔍 Core Observation Points Short-term Resistance Level:
White Moving Average (Bollinger Band Middle Band) If the price cannot stay above this line, the bearish pattern continues; if it stabilizes, it triggers a technical rebound.
Important Resistance Level: Previous high of 3403.44 + Blue Moving Average (Bollinger Band Upper Band) If a rebound encounters resistance here and falls back, it is a clear signal to sell high.
Short-term Support Level: Purple Moving Average (Bollinger Band Lower Band) If support is gained upon retesting this level, a light position can be attempted; if it breaks down, look to the previous low.
Key Support Level: Previous Low If lost, it opens up further downward space, and strict stop-loss is required.
🎯 Long and Short Signal Trigger Conditions
Bullish Signal: Price stabilizes above the white moving average (middle band) with a bullish candle breakout pattern and the Bollinger Band opening expands upward again.
Bearish Signal: Price falls below the purple moving average (lower band) with a bearish candle breakout pattern and the Bollinger Band lower band continues to turn downward.
🛡️ Risk Management Tips
If currently holding a long position, it is recommended to set the stop-loss below the key support level (e.g., below the previous low). If currently in a flat position, wait for the price to break through the resistance level or fall below the support level before following the trend to avoid entering early.
📊 Bitcoin One-Hour Level Market Chart Analysis
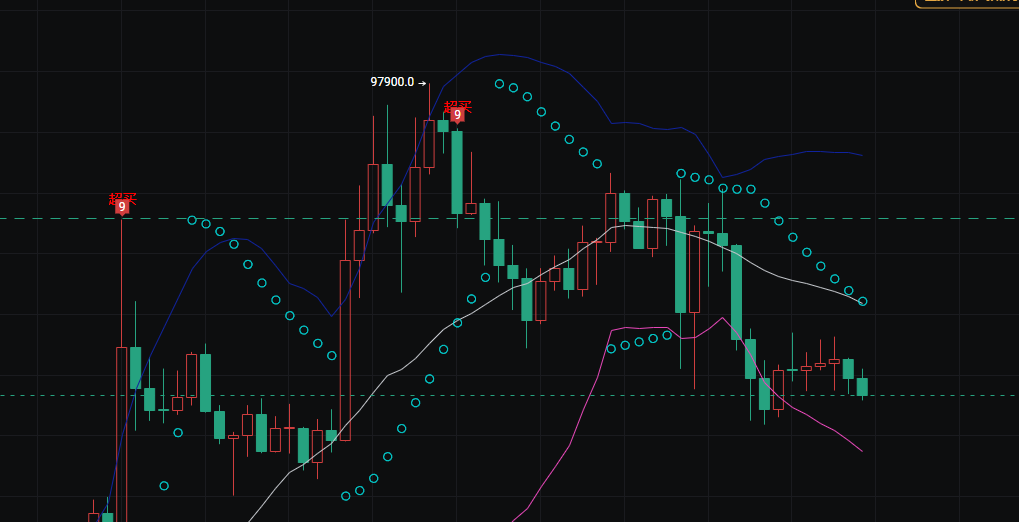
- Trend and Price Structure Overall Trend: After the price surged to a high of 97900.0, it has shown a clear downward trend, with the recent K-line center of gravity continuously moving downwards, indicating a phase of correction.
Support and Resistance:
Upper Resistance: Previous high of 97900.0 and the area of the blue moving average (Bollinger Band upper band), with the white moving average (Bollinger Band middle band) also exerting pressure in between.
Lower Support: The current price has fallen to the lower edge of the previous fluctuation range, with the purple moving average (Bollinger Band lower band) also below, serving as important short-term support.
- Indicator Signals
Bollinger Band: The price has quickly fallen from the Bollinger Band upper band and is currently near the lower band, with signs of the Bollinger Band opening expanding and then narrowing, indicating a decrease in short-term volatility.
Moving Average System: The price has fallen below the white moving average (Bollinger Band middle band), and the short-term moving averages are showing a downward trend, further confirming a short-term weak pattern.
K-line Pattern: Recently, a combination of K-lines dominated by multiple long bearish candles has appeared, with weak rebound strength, indicating that bearish forces are prevailing at this stage.
- Subsequent Trend Projection Bearish Scenario: If the price cannot effectively stabilize above the white moving average (middle band), it is likely to continue to test the support of the lower purple moving average (lower band) and the previous low.
Bullish Scenario: If it can quickly recover above the white moving average (middle band) and stabilize, it may trigger a technical rebound, challenging the resistance of the upper blue moving average (upper band).
🔍 Core Observation Points
Short-term Resistance Level: White Moving Average (Bollinger Band Middle Band) If the price cannot stay above this line, the bearish pattern continues; if it stabilizes, it triggers a technical rebound.
Important Resistance Level: Previous high of 97900.0 + Blue Moving Average (Bollinger Band Upper Band) If a rebound encounters resistance here and falls back, it is a clear signal to sell high.
Short-term Support Level: Purple Moving Average (Bollinger Band Lower Band) If support is gained upon retesting this level, a light position can be attempted; if it breaks down, look to the previous fluctuation range's low.
Key Support Level: Previous Fluctuation Range Low If lost, it opens up further downward space, and strict stop-loss is required.
🎯 Long and Short Signal Trigger Conditions
Bullish Signal: Price stabilizes above the white moving average (middle band) with a bullish candle breakout pattern and the Bollinger Band opening expands upward again.
Bearish Signal: Price falls below the purple moving average (lower band) with a bearish candle breakout pattern and the Bollinger Band lower band continues to turn downward.
🛡️ Risk Management Tips If currently holding a long position, it is recommended to set the stop-loss below the key support level (e.g., below the previous fluctuation range low). If currently in a flat position, wait for the price to break through the resistance level or fall below the support level before following the trend to avoid entering early.
Daily, at irregular times, internal channels share more real-time trading strategies. If you have no direction in long-term operations or have been losing for a long time, follow the public account to contact the teacher—Bitcoin Big Bear.

免责声明:本文章仅代表作者个人观点,不代表本平台的立场和观点。本文章仅供信息分享,不构成对任何人的任何投资建议。用户与作者之间的任何争议,与本平台无关。如网页中刊载的文章或图片涉及侵权,请提供相关的权利证明和身份证明发送邮件到support@aicoin.com,本平台相关工作人员将会进行核查。