Introduction
Recently, attentive investors may have noticed that a tool called the Supertrend Indicator has been appearing more frequently on the market pages of both OKX and Binance. It is no longer just a hidden indicator for quantitative traders or deep users; it has been directly integrated into the viewing systems of leading exchanges, becoming a trend reference that ordinary investors can access with a single click.
This change is not coincidental. As the market's volatility structure has become more complex, presenting a state of "high-frequency fluctuations + breakout trends," more and more retail investors have realized that they are not losing due to misjudging the direction, but rather because they do not know when to hold on and when to exit.
Against this backdrop, the Supertrend Indicator has been thrust into the spotlight. Its purpose is not to enable investors to precisely buy at the bottom and sell at the top, but to help market participants achieve something more important—surviving within the trend.
From the almost simultaneous promotion of this indicator by OKX and Binance, it is clear that this is not a simple functional addition, but rather a clear signal release: trend trading is transitioning from an "advanced strategy" to a "basic skill."

Figure 1: Supertrend Indicator (Data source: OKX)
1. What is the Supertrend Indicator?
Supertrend is a trend-following indicator based on the Average True Range (ATR). Its core is not to calculate the average price but to dynamically adjust the position of a trend reference line based on the current volatility intensity of the market.
In actual display, it is usually presented as a clearly colored line on the candlestick chart:
- Price running above the trend line → Market is in a bullish trend
- Price breaking below the trend line → Market enters a bearish or weak phase
This design has a very intuitive benefit:
The trend state itself is the answer, rather than a signal that needs explanation.
More importantly, Supertrend is not a static indicator.
- When market volatility increases, the trend line automatically widens, reducing false breakouts;
- When the market stabilizes, the trend line gradually tightens, increasing the sensitivity of trend switches.
Functionally, it resembles a "breathing trend defense line."

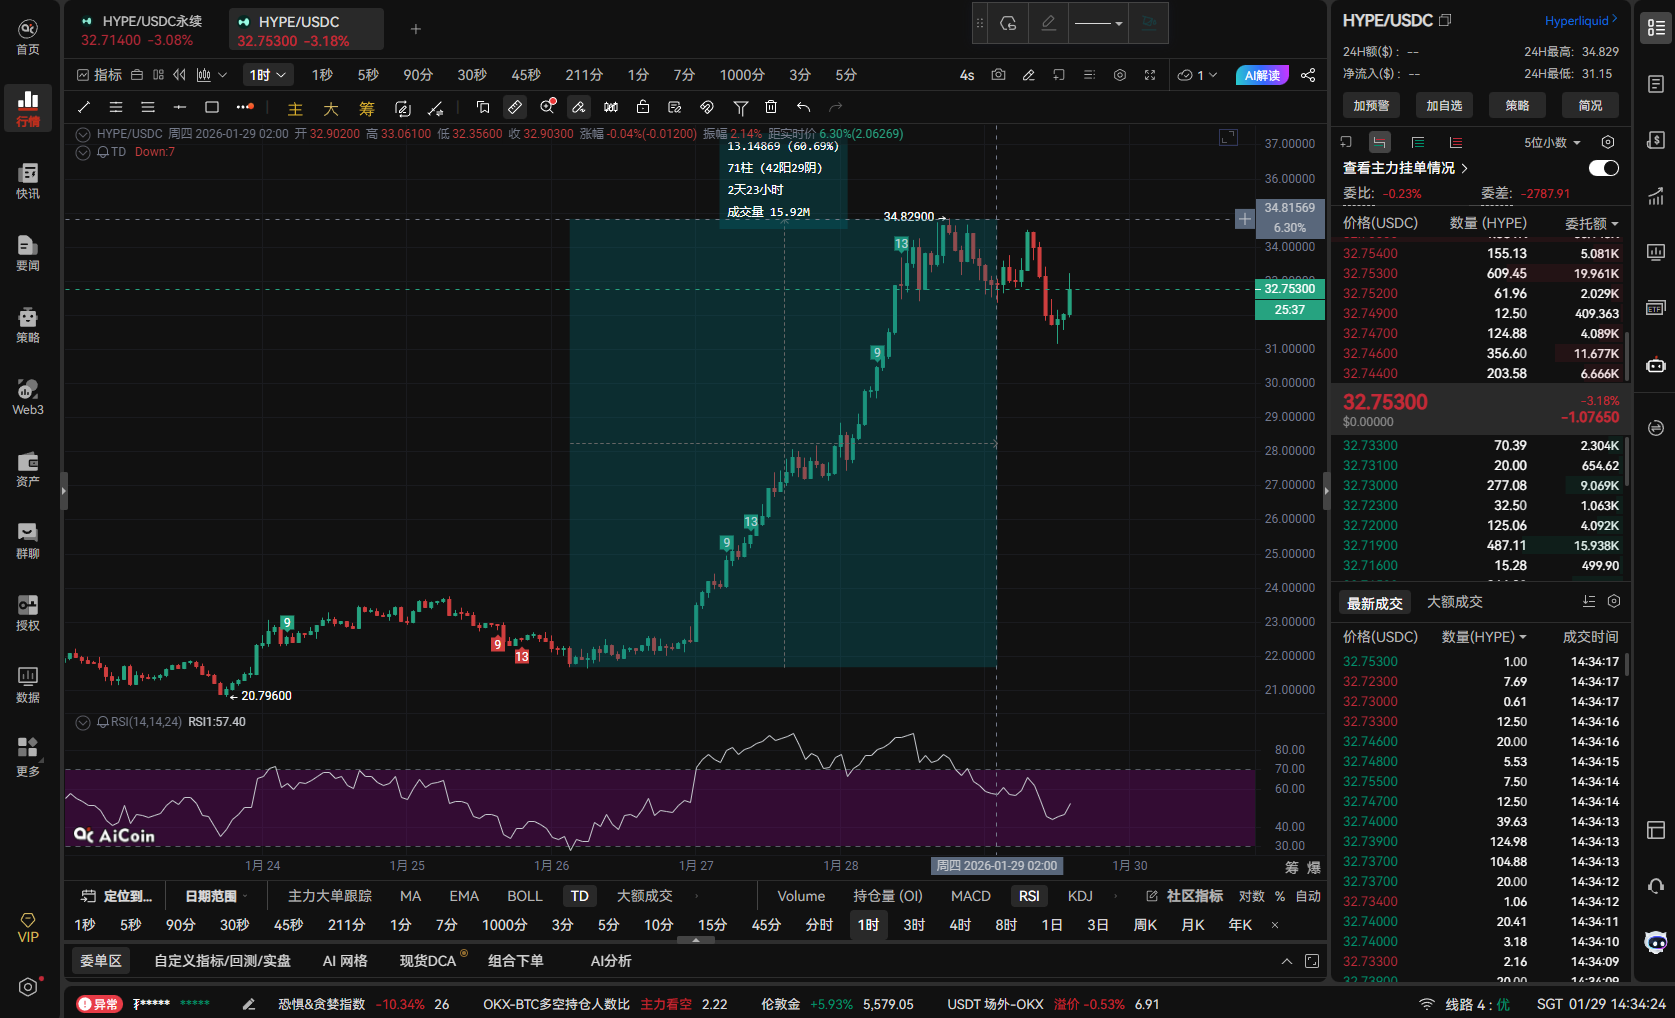
Figure 2: Supertrend Indicator (Data source: AiCoin)
2. Why is Supertrend more "like risk control" than many classic indicators?
The core of most classic technical indicators is to "generate trading signals," while Supertrend jumps out of this framework from its design logic—it is closer to an institution's "risk constraint tool," with its core mission being "dynamic risk control," rather than "precise prediction." This is the most fundamental difference between it and indicators like moving averages and MACD.
The reason it is considered more "like risk control" stems from two underlying designs that precisely adapt to the high volatility characteristics of the crypto market:
1. Centered on "volatility," not "price" itself, dynamically adapting to risk
The core calculation factor of Supertrend is ATR (Average True Range), which quantifies "the true volatility intensity of the market," rather than simply tracking price. This means its adjustments revolve around "risk changes," achieving "risk-adaptive control":
When the market diverges (e.g., BTC surges/drops sharply), ATR amplifies, and the trend line automatically moves away from the price, widening the risk control threshold to prevent investors from being washed out due to short-term pullbacks, thus preserving core profits;
When the market converges (e.g., ETH oscillates sideways), ATR shrinks, and the trend line approaches the price, increasing sensitivity. Once the oscillation range is broken, it immediately signals the risk of a trend reversal.
In contrast, classic indicators like moving averages and MACD focus on price or fixed parameters, lacking a dynamic adjustment mechanism, leading to lagging stop losses in bull markets and distorted signals in sideways markets, making it difficult to cope with the dynamic risks of the crypto market.
2. Naturally equipped with "trailing stop loss" functionality, replacing emotional decision-making with rules
In trend trading, "reasonable exit" is more challenging than "precise entry"—when in profit, there is a fear of reversing too early and taking profits, and when in loss, there is a tendency to hold on in hope. The design of Supertrend provides a visual exit rule, transforming stop loss/take profit from "based on feeling" to "following rules":
The "dynamic protection line" for trend positions: During the holding period, the trend line moves in sync with the price, neither limiting profit growth nor missing the opportunity to lock in profits when the market reverses;
The "rigid exit condition" for medium to long-term strategies: Regardless of market sentiment, if the price breaks below the trend line, it triggers a stop loss, avoiding deep entrapment risks.
This mechanism does not require manual parameter adjustments; it is entirely data-driven, perfectly avoiding emotional interference, while classic indicators require manual stop loss settings, which can fail due to unreasonable parameters or emotional fluctuations.
In summary, the core value of Supertrend lies not in "more accurate signals," but in "a more stable risk control framework"—dynamic risk adaptation + rigid exit rules, precisely addressing the risk control pain points in the crypto market. This is also the key reason why leading exchanges like OKX and Binance are eager to adopt it: in a high-volatility market, a risk control tool that "protects the principal" is far more favored than a signal tool that "earns quick money."
3. How to use the Supertrend indicator on AiCoin
On the AiCoin platform, we can not only clearly identify market trends using the Supertrend indicator but also achieve automated trading through the platform's custom indicator system.
The specific operation path is simple: open the bottom navigation bar of AiCoin, go to "Custom Indicators" - "Indicator Editor," copy and paste the source code below (which has set trading functions for automated trading), save it, click "Run in Real-time" on the right, adjust the parameters, and click "Create Real-time" to place orders automatically.

Figure 3: Path for placing real-time orders using the Supertrend Indicator (Data source: AiCoin)
The custom indicator feature of AiCoin is powerful— the platform supports one-click backtesting of indicators, allowing users to intuitively view the historical performance of indicators: after saving the indicator, simply click "Indicator Backtest" to quickly obtain results; additionally, the platform offers a "Professional Backtest" mode, unlocking more refined backtesting options to meet different levels of analysis needs.

Figure 4: Indicator backtesting results (Data source: AiCoin)
The source code is as follows (for reference only, not investment advice):
// @version=2
// Create your custom script here
// ============================================================================
// Parameter definitions
// ============================================================================
atrfactor = 3 // ATR multiplier
atrperiod = 10 // ATR period
// ============================================================================
// SuperTrend indicator calculation
// ============================================================================
[supertrend, direction] = supertrend(atrfactor, atrperiod)
// ============================================================================
// Signal logic
// ============================================================================
// Bullish signal: trend changes from bearish to bullish
longsignal = direction < 0 and direction[1] > 0
// Bearish signal: trend changes from bullish to bearish
shortsignal = direction > 0 and direction[1] < 0
// ============================================================================
// Trading logic
// ============================================================================
// Closing operations
exitLongPercent(shortsignal, id='Close Long', price='market', percent=100)
exitShortPercent(longsignal, id='Close Short', price='market', percent=100)
// Opening operations
enterLongPercent(longsignal, id='Open Long', price='market', percent=100)
enterShortPercent(shortsignal, id='Open Short', price='market', percent=100)
// ============================================================================
// Plotting logic (red for down, green for up)
// ============================================================================
// Bullish trend line (green - up)
plot_up = plot(direction < 0 ? supertrend : na, title='Bullish Trend Line', color='rgba(0,184,131,1)', lineWidth=2)
// Bearish trend line (red - down)
plot_down = plot(direction > 0 ? supertrend : na, title='Bearish Trend Line', color='rgba(232,74,84,1)', lineWidth=2)
// Price midline (for filling)
plot_mid = plot(ohlc4, title='Midline', color='rgba(0,0,0,0)', lineWidth=0, display=false)
// Fill area (bullish green, bearish red)
fill(plotmid, plotup, color='rgba(0,184,131,0.1)')
fill(plotmid, plotdown, color='rgba(232,74,84,0.1)')
// Mark trading signals
plotText(longsignal, title='Open Long Signal', text='Open Long', refSeries=supertrend, bgColor='rgba(0,184,131,1)', color='white', fontSize=12, placement='bottom')
plotText(shortsignal, title='Open Short Signal', text='Open Short', refSeries=supertrend, bgColor='rgba(232,74,84,1)', color='white', fontSize=12, placement='top')
// ============================================================================
// Alert logic
// ============================================================================
alertcondition(longsignal, title='SuperTrend Open Long Signal', direction='buy')
alertcondition(shortsignal, title='SuperTrend Open Short Signal', direction='sell')
alertcondition(direction != direction[1], title='SuperTrend Trend Change')
Conclusion
The rise of the Supertrend Indicator is fundamentally about hitting the essence of the crypto market: "risk control is king." It does not pursue precise predictions but uses dynamic trend lines and clear rules to help investors solve the critical problem of "when to hold on and when to exit."
The competition between OKX and Binance reflects their understanding of retail investors' urgent need for "simple and effective risk control tools." Moreover, the custom scripts provided by AiCoin allow this "rule-based trading" to take root, enabling users to enjoy quantitative-level risk control without complex operations.
Of course, no indicator is perfect; Supertrend still needs to be combined with position control, cycle resonance, and other strategies. However, it is undeniable that its popularity is lowering the threshold for trend trading and risk control, allowing more retail investors to break free from emotional interference and "survive and hold" in a high-volatility market. For ordinary investors, effectively using this "risk control key" is the core confidence for long-term profitability.
免责声明:本文章仅代表作者个人观点,不代表本平台的立场和观点。本文章仅供信息分享,不构成对任何人的任何投资建议。用户与作者之间的任何争议,与本平台无关。如网页中刊载的文章或图片涉及侵权,请提供相关的权利证明和身份证明发送邮件到support@aicoin.com,本平台相关工作人员将会进行核查。