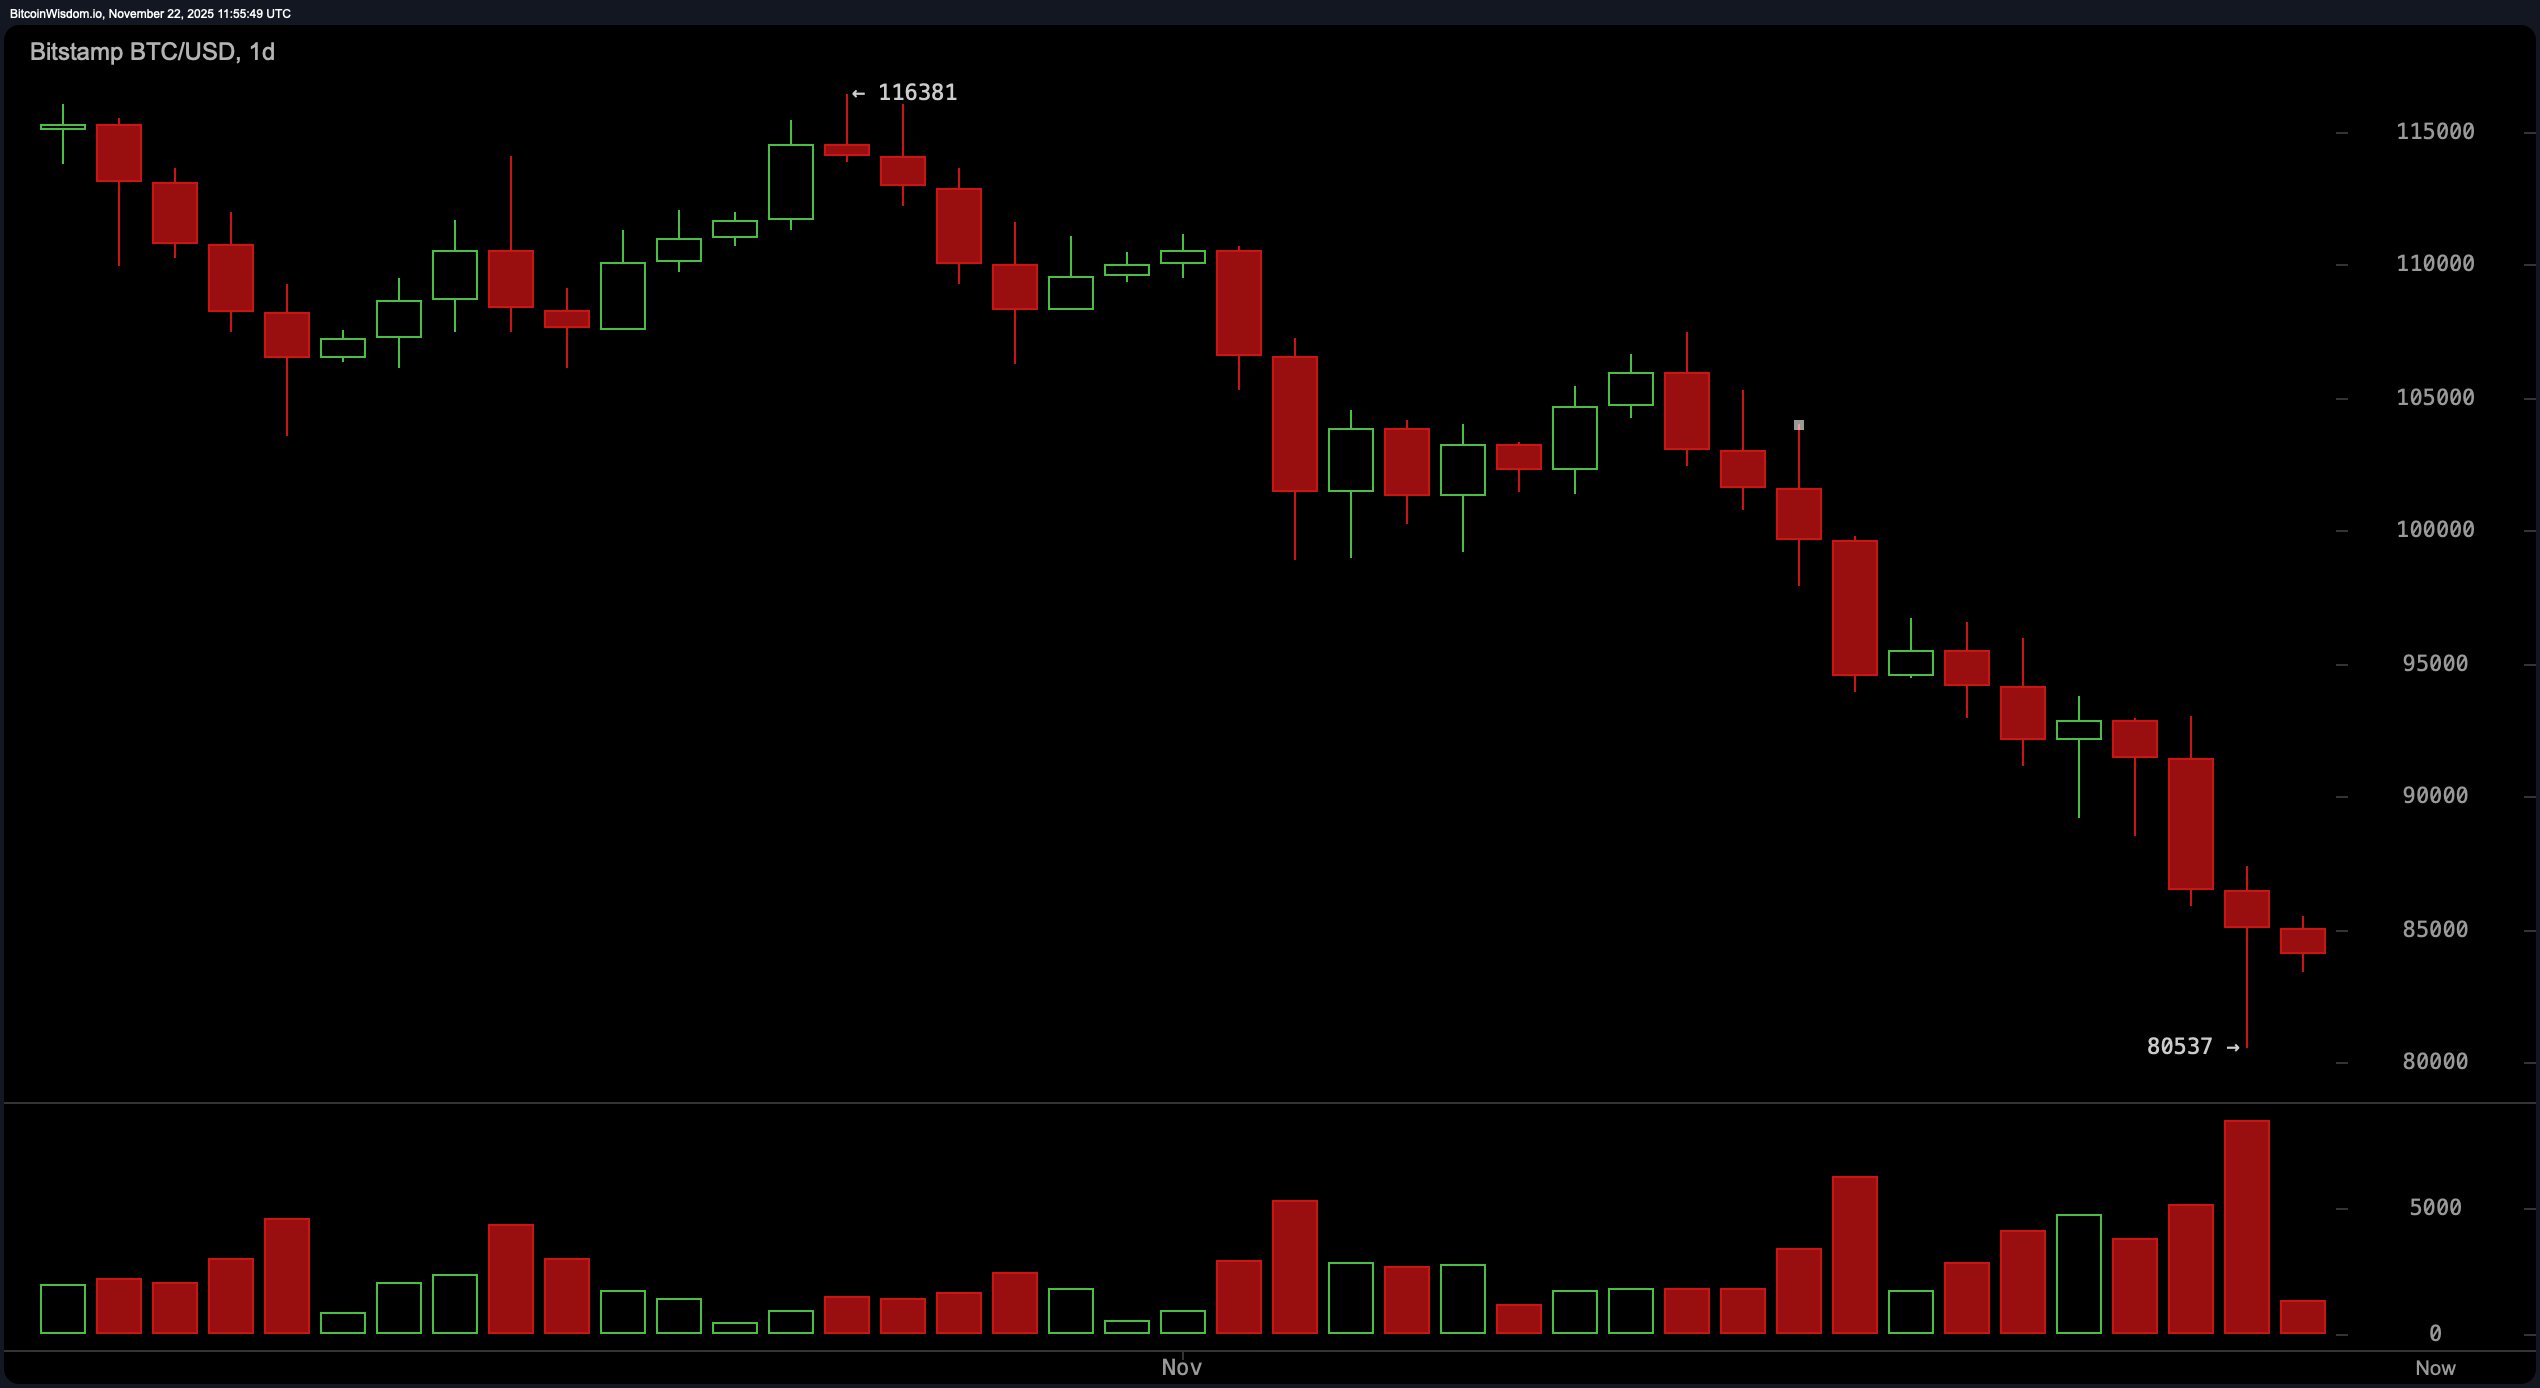
From the daily chart perspective, bitcoin is painting a textbook downtrend—straight out of the bear’s playbook. Price action has tumbled from the recent peak of $116,381 to a low of $80,537 with almost no meaningful bounce, a move that screams distribution. Selling volume has increased as prices approached the lows, adding fuel to an already bearish fire. The last few candlesticks have small bodies, hinting at market indecision rather than conviction. For any chance of reclaiming bullish momentum, the price would need to stomp decisively into the $87,000 to $90,000 range, and so far, it’s barely lifting a toe.

BTC/USD 1-day chart via Bitstamp on Nov. 22, 2025.
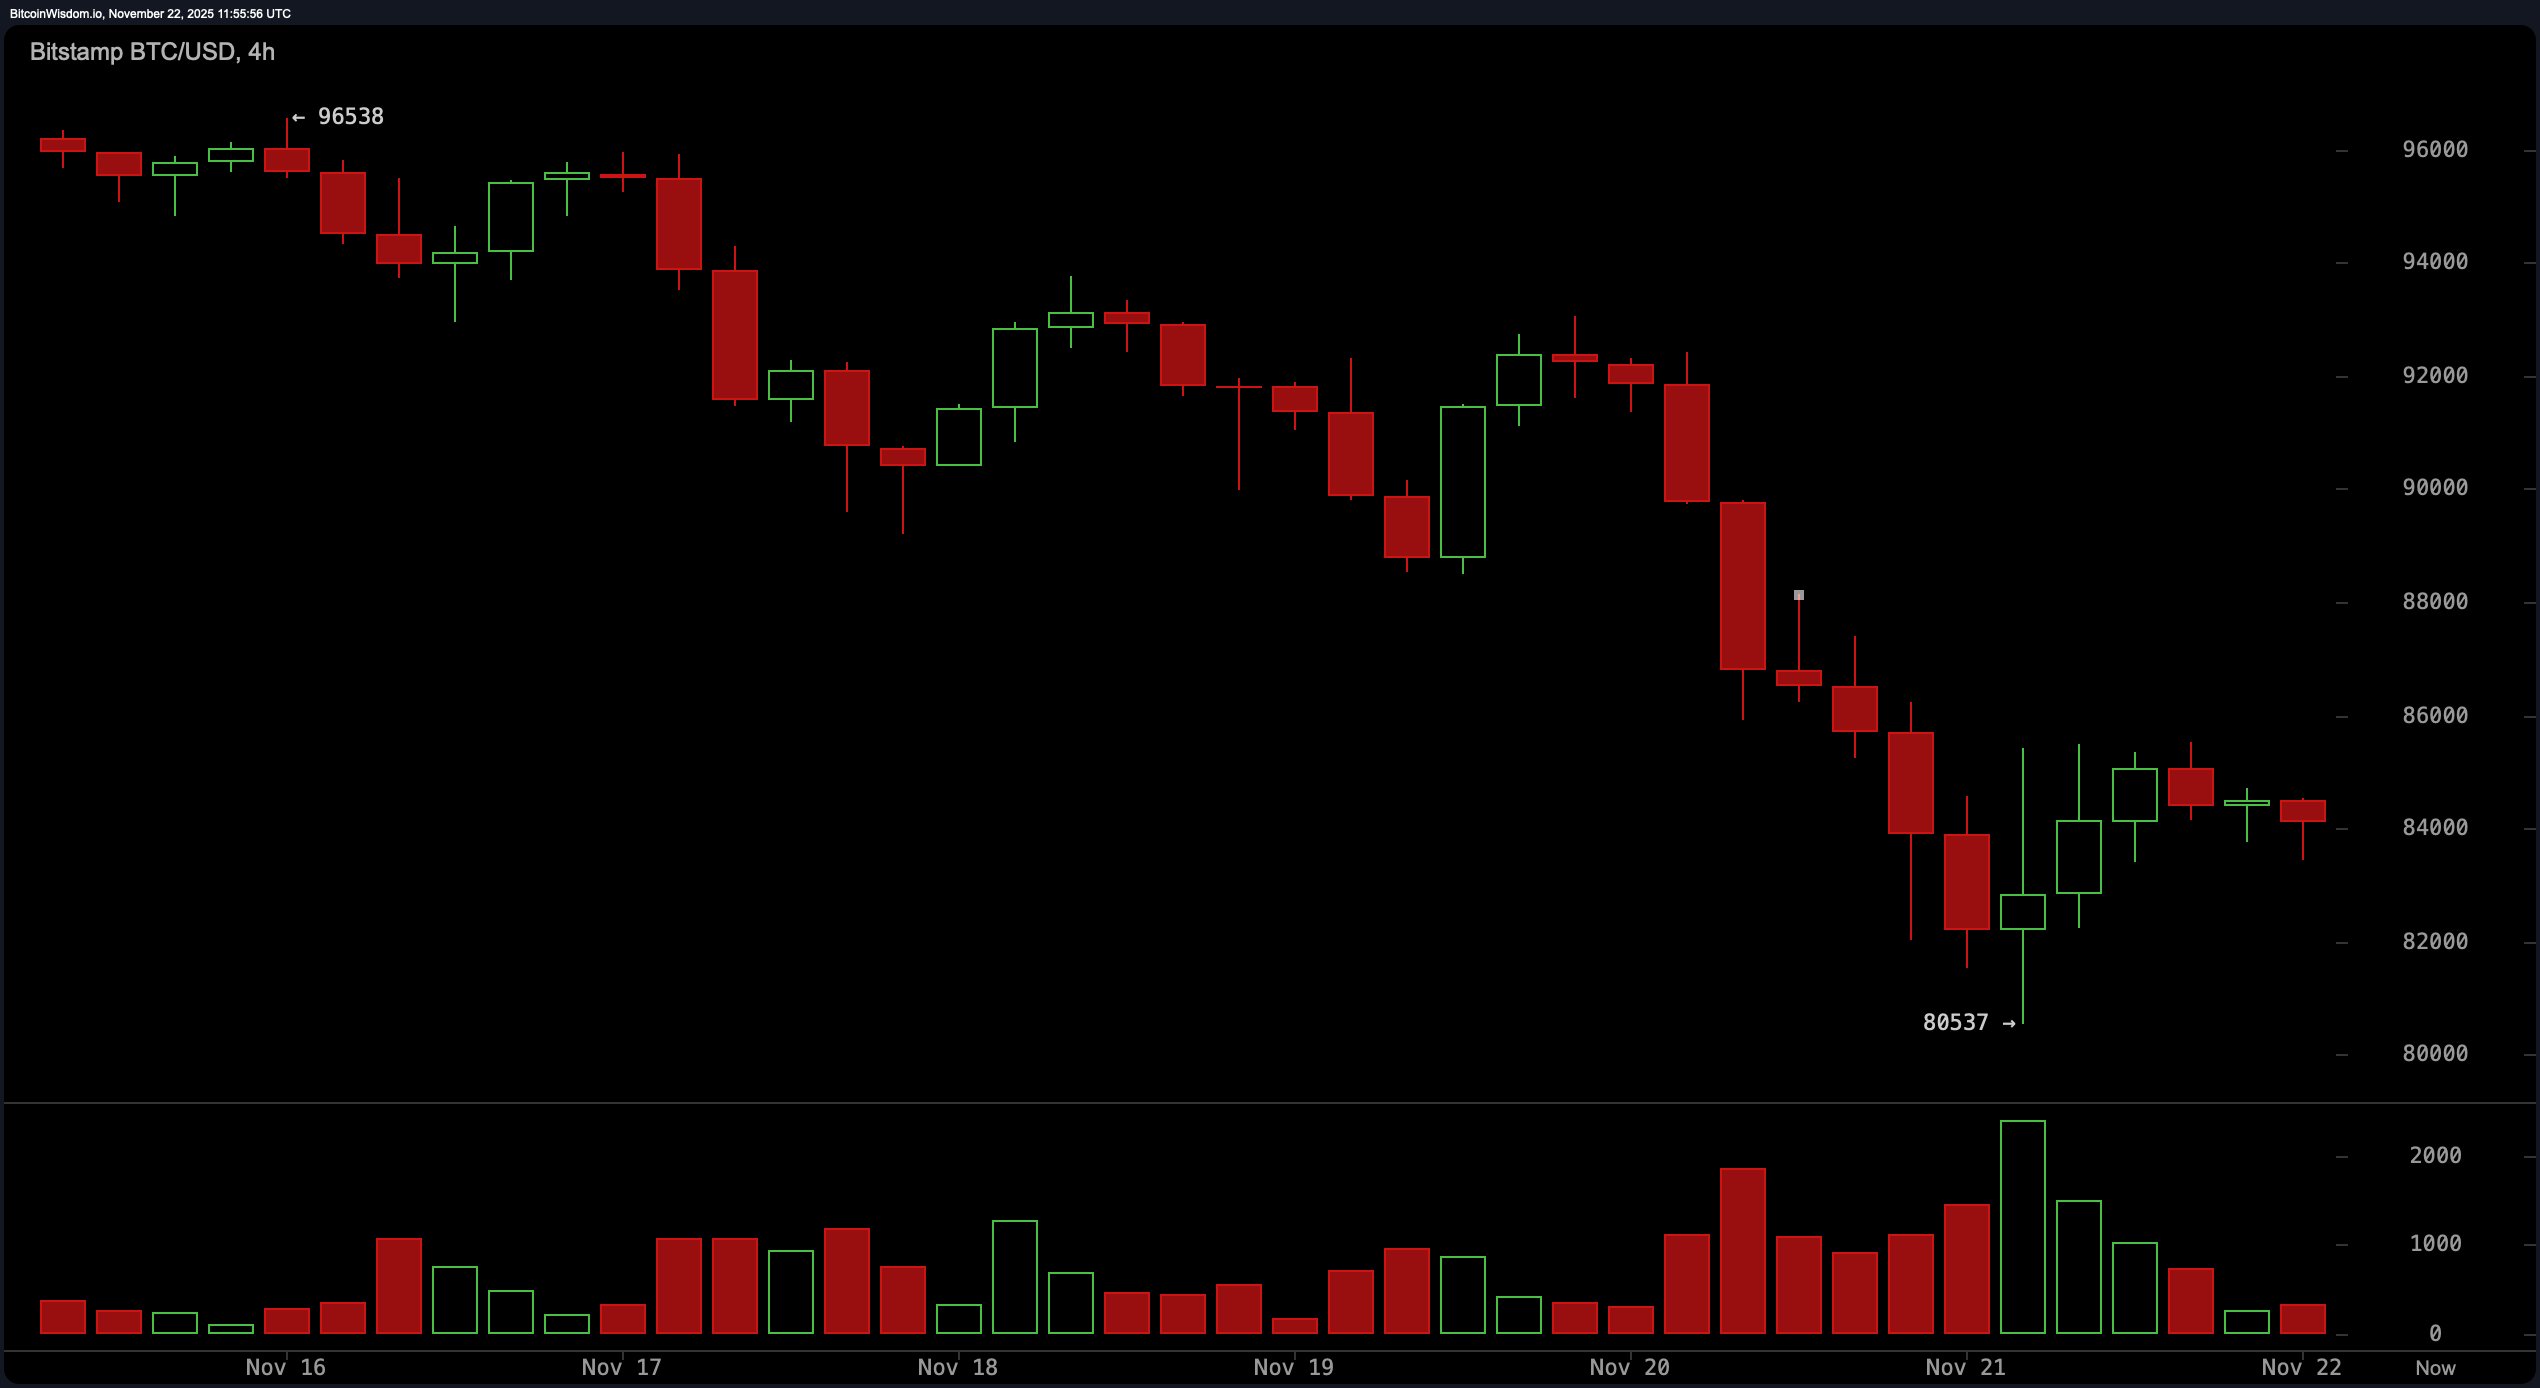
The 4-hour chart shows bitcoin attempting a limp bounce from the $80,537 low to the $84,000–$85,000 zone. But let’s not be fooled by weak legs—this rebound is happening on declining volume, a hallmark of a bear flag rather than a bullish reversal. Without conviction or buyers stepping in with volume, the setup favors further downside. Should price crumble below $83,000 with strong volume, that would likely confirm the next leg down. Conversely, a move above $86,000 on robust green candles would force a rethink—but that’s a big “if” in the current climate.

BTC/USD 4-hour chart via Bitstamp on Nov. 22, 2025.
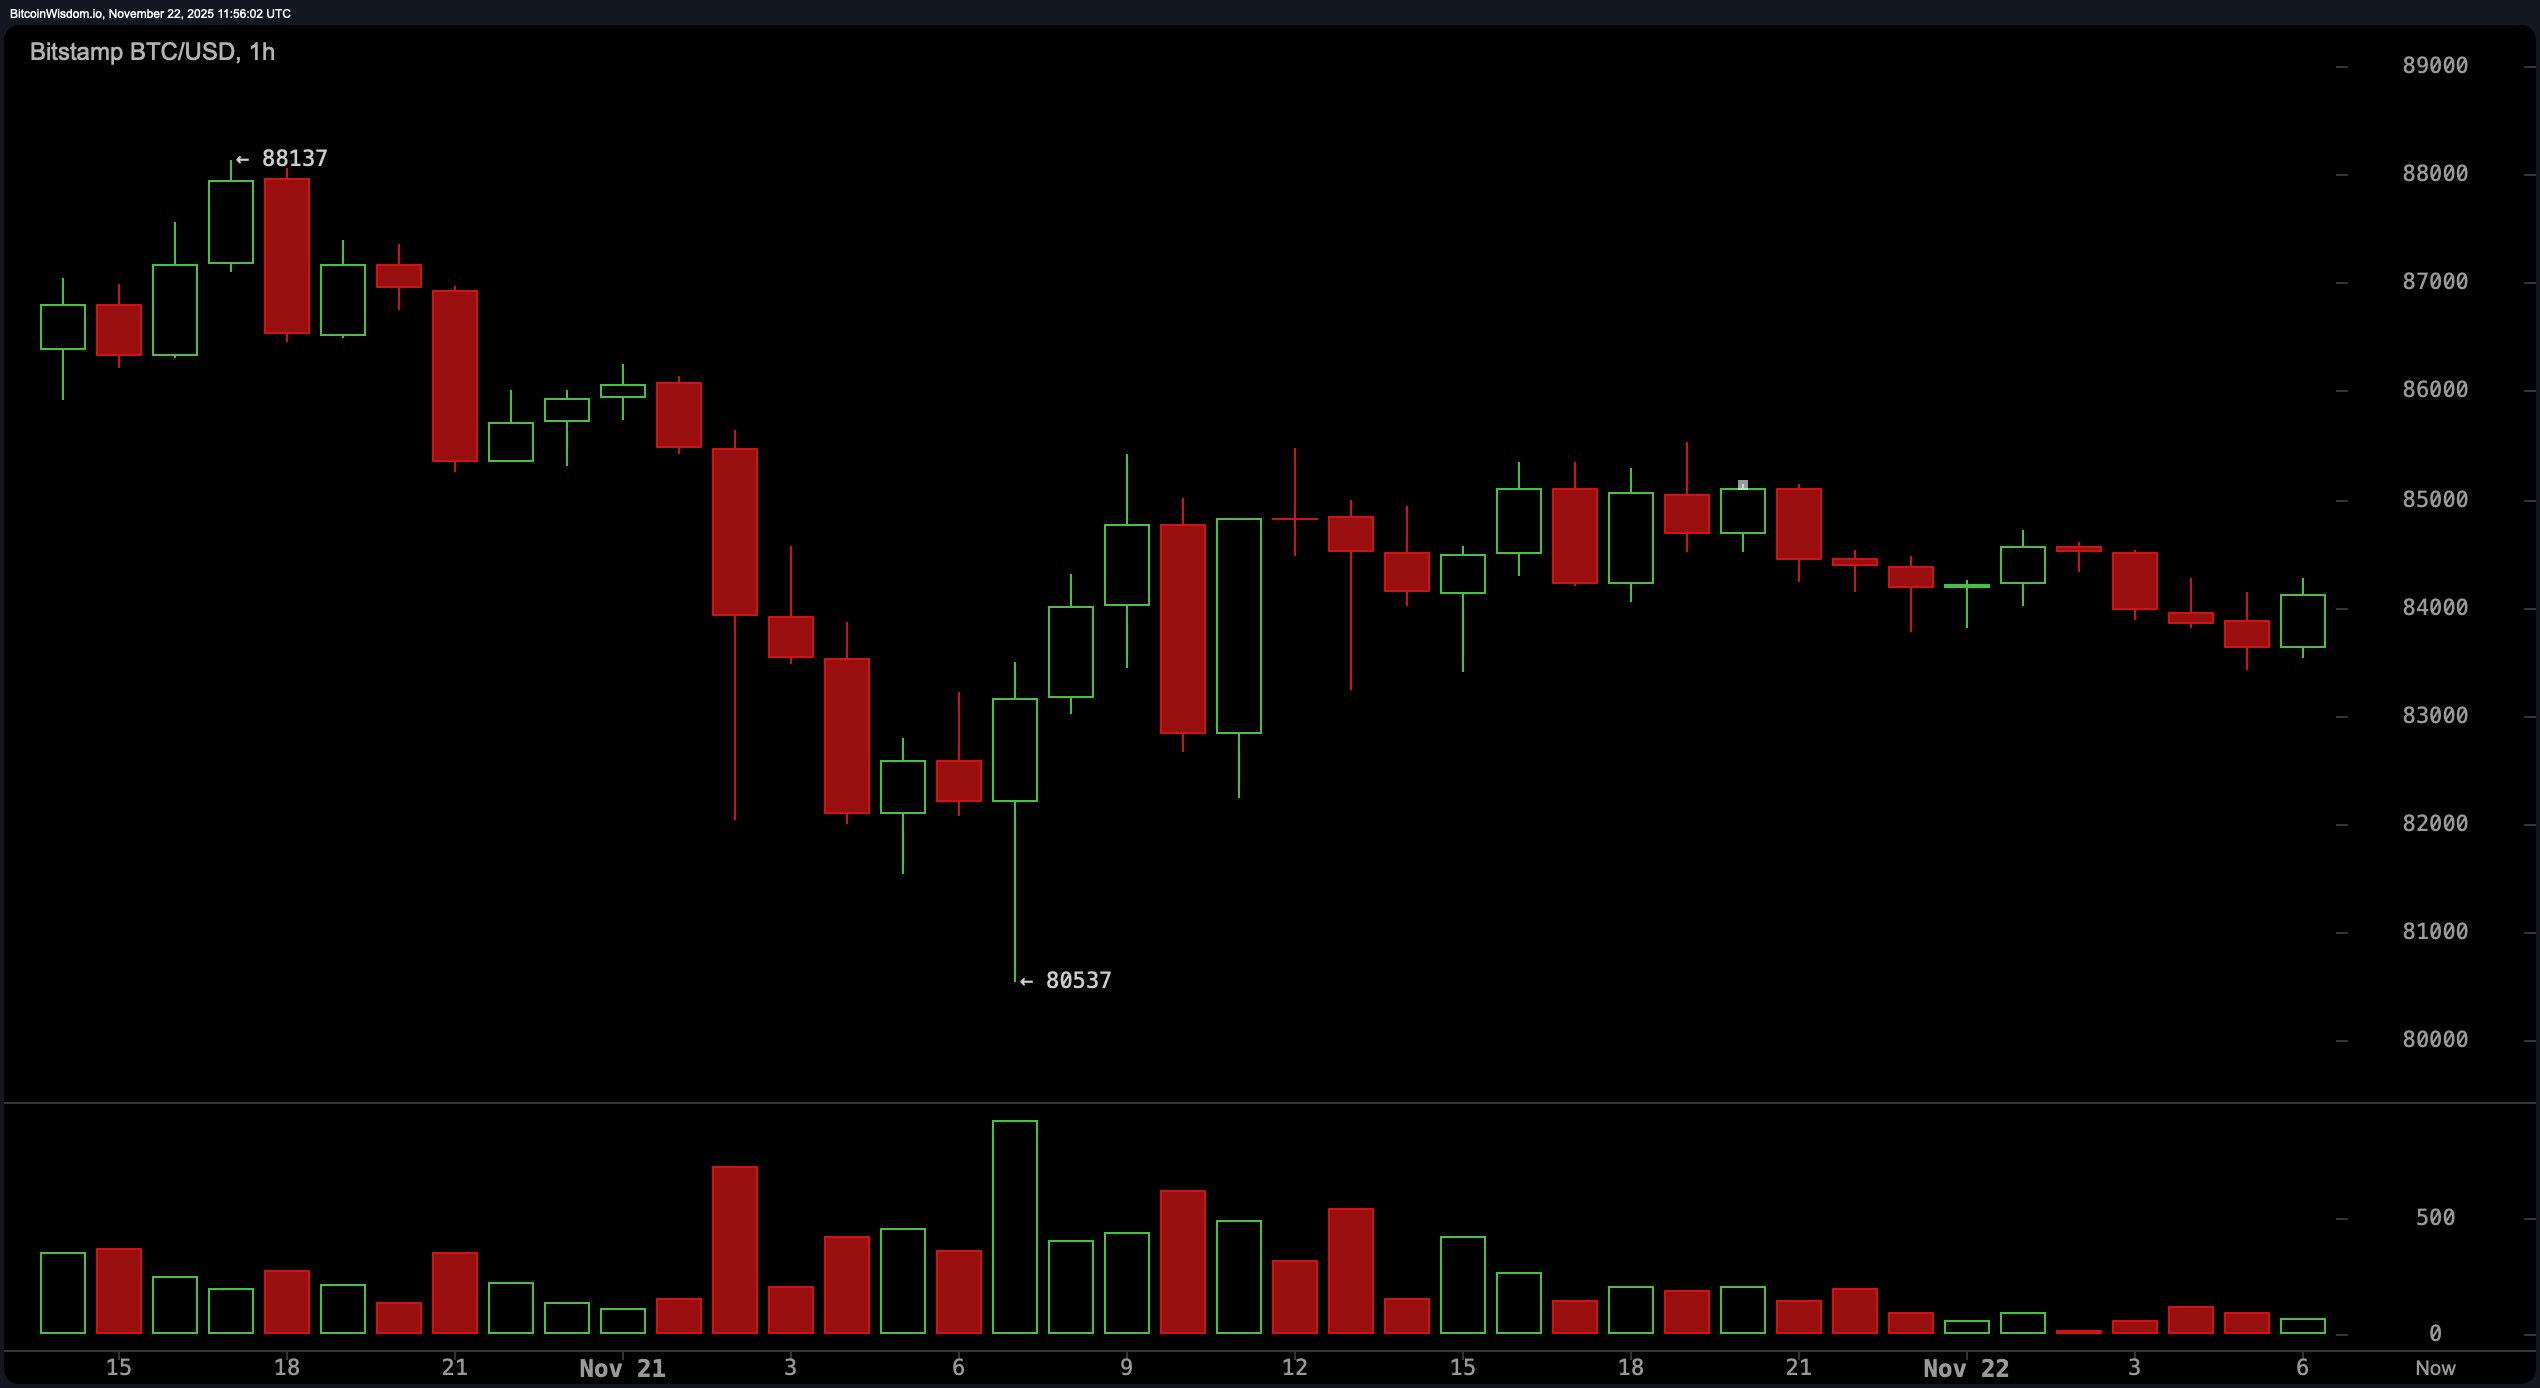
Zooming in to the 1-hour chart, there’s a whiff of bullish divergence—the kind that gets short-term traders a bit twitchy. Price has been crawling sideways between $83,500 and $84,000 while volume ticks upward on green candles. However, resistance at $85,000 is proving sticky. Aggressive traders might eye a break and close above that level for a quick scalp, but smart money should wait for higher timeframe confirmation. A breakdown below $82,000, on the other hand, could have the price searching for support at speed.

BTC/USD 1-hour chart via Bitstamp on Nov. 22, 2025.
The indicators aren’t sugarcoating anything. The relative strength index (RSI) sits at 23, the Stochastic at 11, and the commodity channel index (CCI) has plunged to −148—all suggesting an oversold but uncertain environment. Momentum has dipped to −17,433, aligning with the bearish read, though it curiously aligns with the CCI’s optimism. Meanwhile, the moving average convergence divergence (MACD) level at −5,949 is dragging its feet in outright negativity, underlining how fragile any bullish case currently is.
As for moving averages, let’s just say bitcoin is speed-dating with resistance. Every single exponential moving average (EMA) and simple moving average (SMA) from the 10-period to the 200-period is signaling bearish. The EMA (10) at $91,164 and SMA (10) at $91,618 show price well below recent averages, with longer-term EMAs and SMAs such as the EMA (200) at $106,372 and SMA (200) at $110,261, only reinforcing the dominant trend. Until price starts reclaiming some of these levels with intent, the outlook remains a one-way street lined with red.
Bull Verdict:
If bitcoin manages to reclaim the $87,000 to $90,000 range on convincing volume and begins closing above key resistance zones like $85,000, the bulls could argue for a structural recovery. Short-term divergences and oversold oscillators offer a sliver of hope—but only if buyers stop flirting and start committing.
Bear Verdict:
With price suppressed below all major moving averages, volume favoring downside moves, and every significant timeframe still charting lower highs and lower lows, the bears remain firmly in the driver’s seat. Until bitcoin proves it can hold above $86,000 with conviction, the dominant trend says: more pain ahead.
- Where is bitcoin currently trading?
As of November 22, 2025, bitcoin is priced at $84,135. - What’s the trading range for bitcoin today?
The 24-hour price band is between $81,050 and $85,428. - Is the current trend for bitcoin up or down?
All major timeframes indicate a clear downtrend with no confirmed reversal. - What do technical indicators say about bitcoin’s momentum?
Most oscillators and moving averages show bearish conditions, with little bullish confirmation.
免责声明:本文章仅代表作者个人观点,不代表本平台的立场和观点。本文章仅供信息分享,不构成对任何人的任何投资建议。用户与作者之间的任何争议,与本平台无关。如网页中刊载的文章或图片涉及侵权,请提供相关的权利证明和身份证明发送邮件到support@aicoin.com,本平台相关工作人员将会进行核查。


