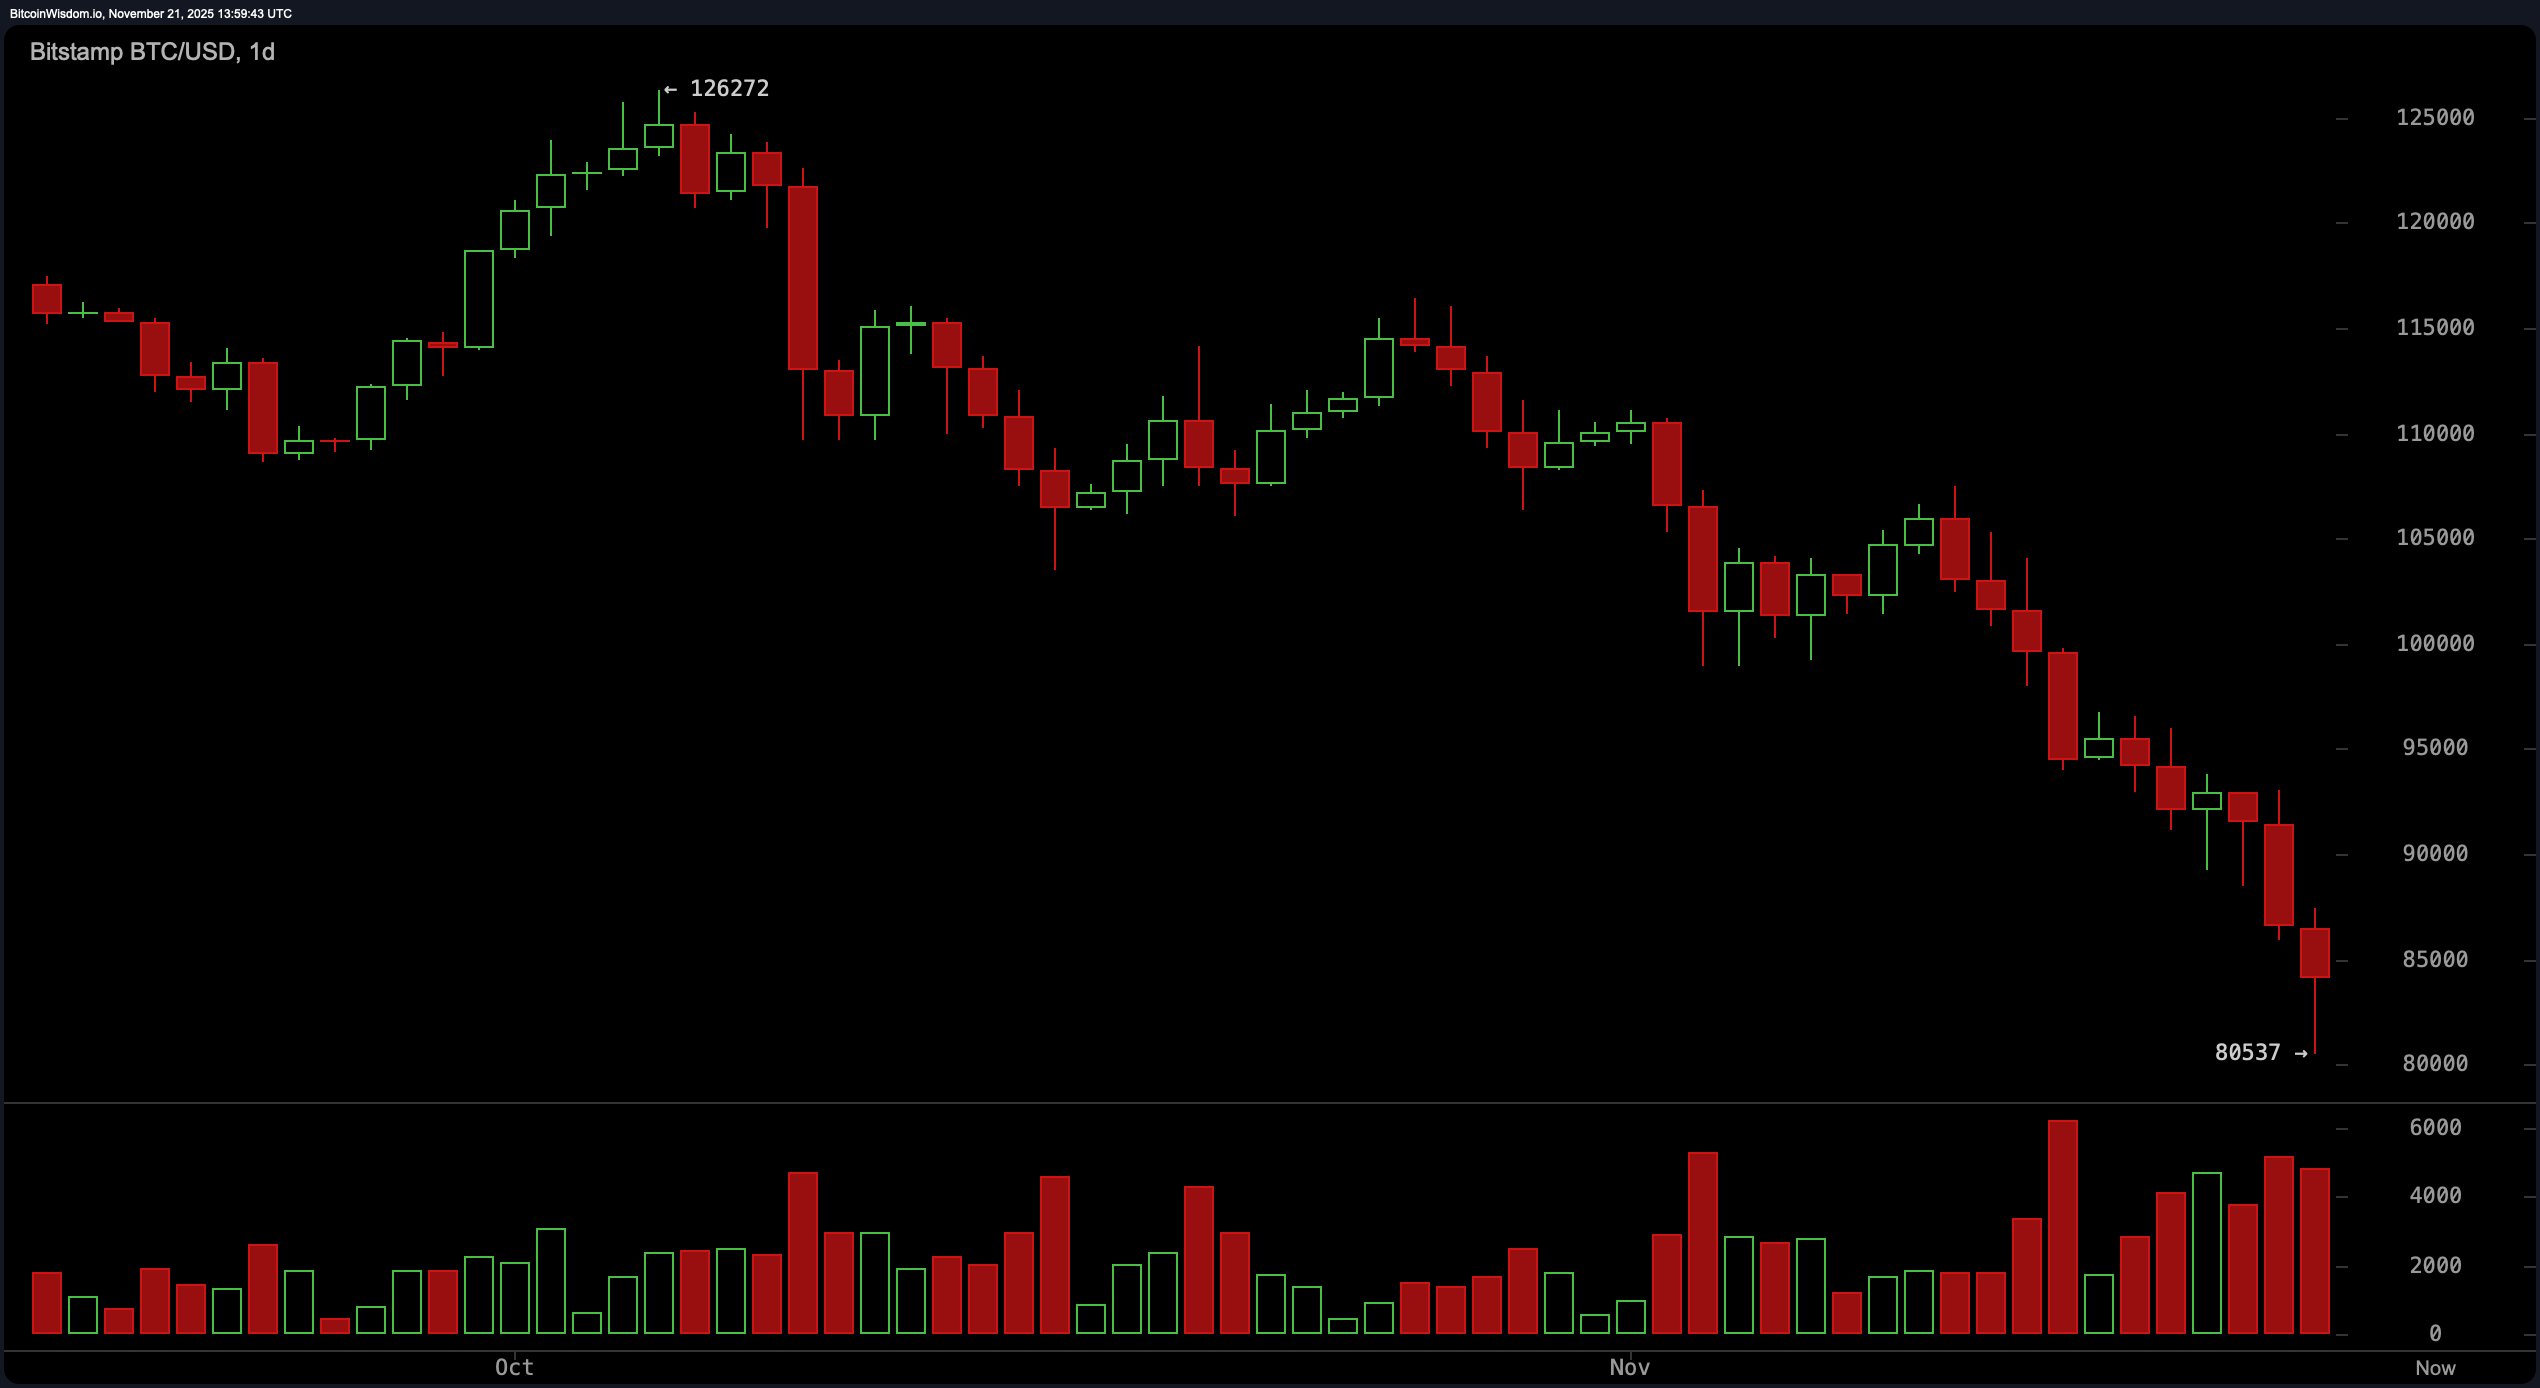
Today’s daily chart offers a rather dramatic backdrop: bitcoin has tumbled from a high of $126,272 to lows scraping the psychological $80,537 support. That’s a 36% drawdown—enough to make even the most diamond-handed holders reach for chamomile tea. A series of lower highs and lows, combined with heavy red candle action, confirm the bearish macro sentiment.
The resistance ceiling looms ominously at $92,000 to $95,000, while the $80,000 zone braces itself as psychological armor against further slippage. Volume surged during the recent drop, suggesting potential capitulation—a classic precursor to a bounce, but not a guarantee.

BTC/USD 1-day chart via Bitstamp on Nov. 21, 2025.
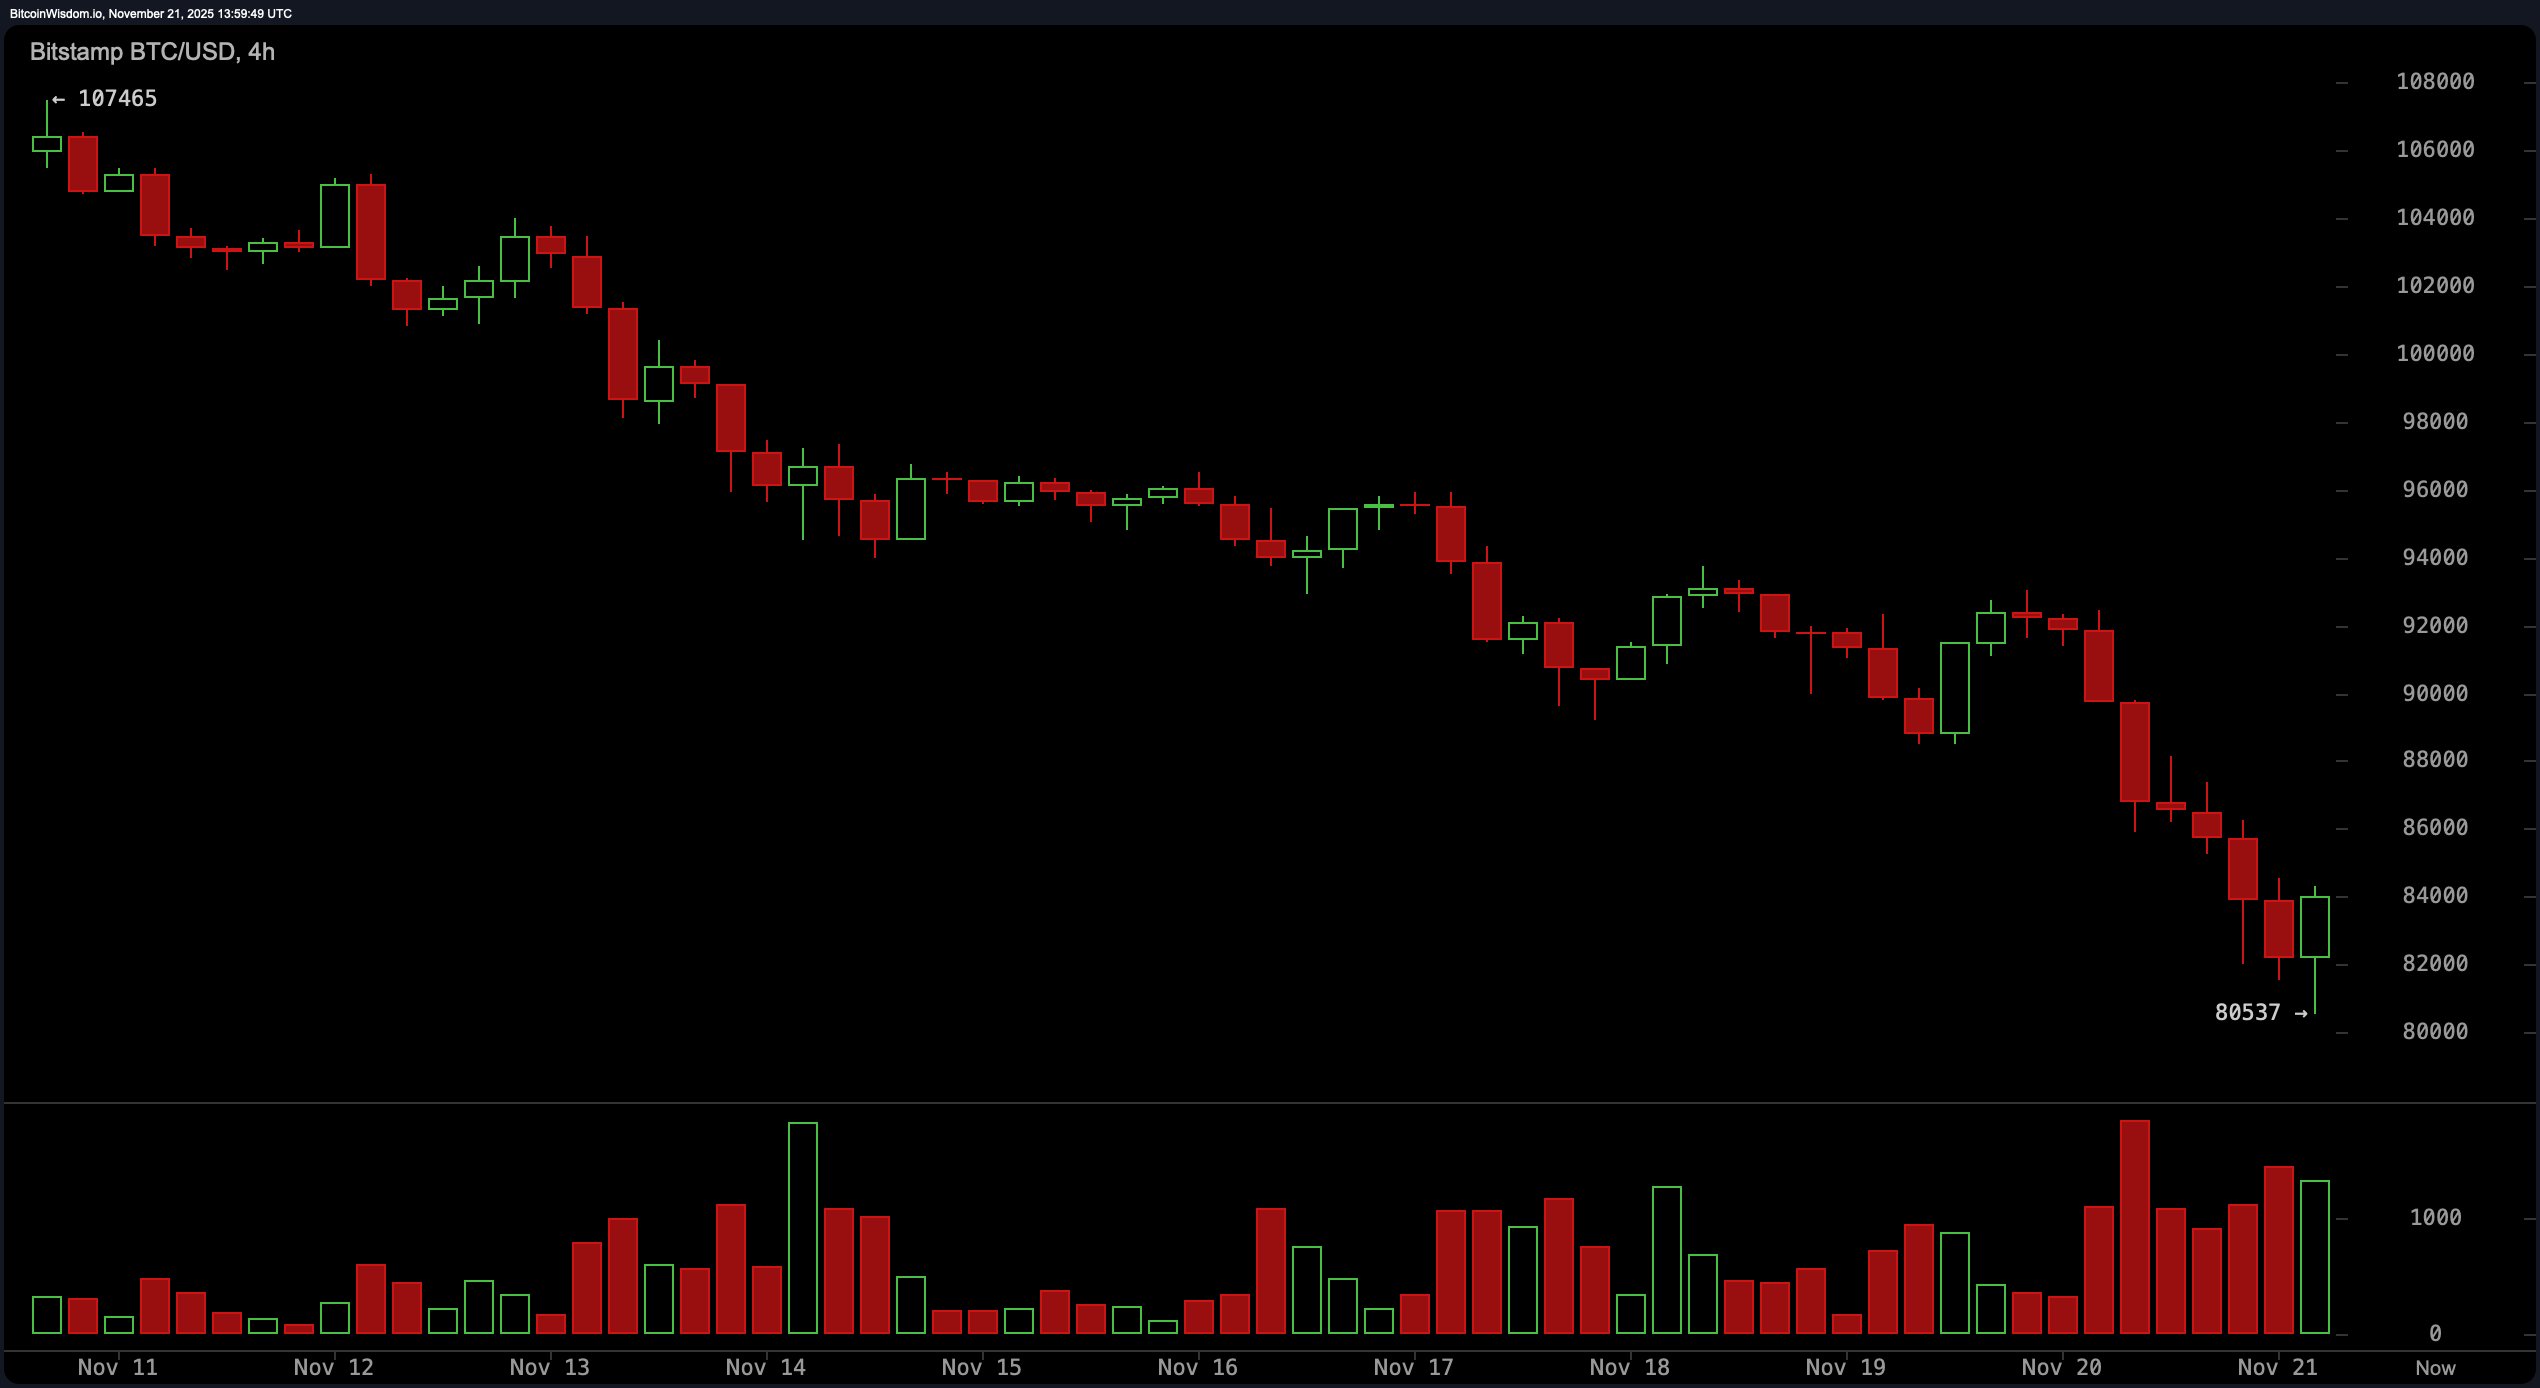
Zooming into the 4-hour chart, the picture doesn’t brighten significantly, but glimmers of hope peek through. The downtrend remains intact, but the bulls are beginning to whisper from beneath the rubble. Price has tagged new lows, yet volume refuses to follow suit—a sign of bullish divergence. That subtle discrepancy could foreshadow a relief rally, especially as candles flirt with the $83,500 level. Local resistance hovers around $86,000 to $88,000, making it the near-term battlefield for momentum traders. The short-term setup favors those nimble enough to dance between entries and exits like it’s a tango with volatility itself.

BTC/USD 4-hour chart via Bitstamp on Nov. 21, 2025.
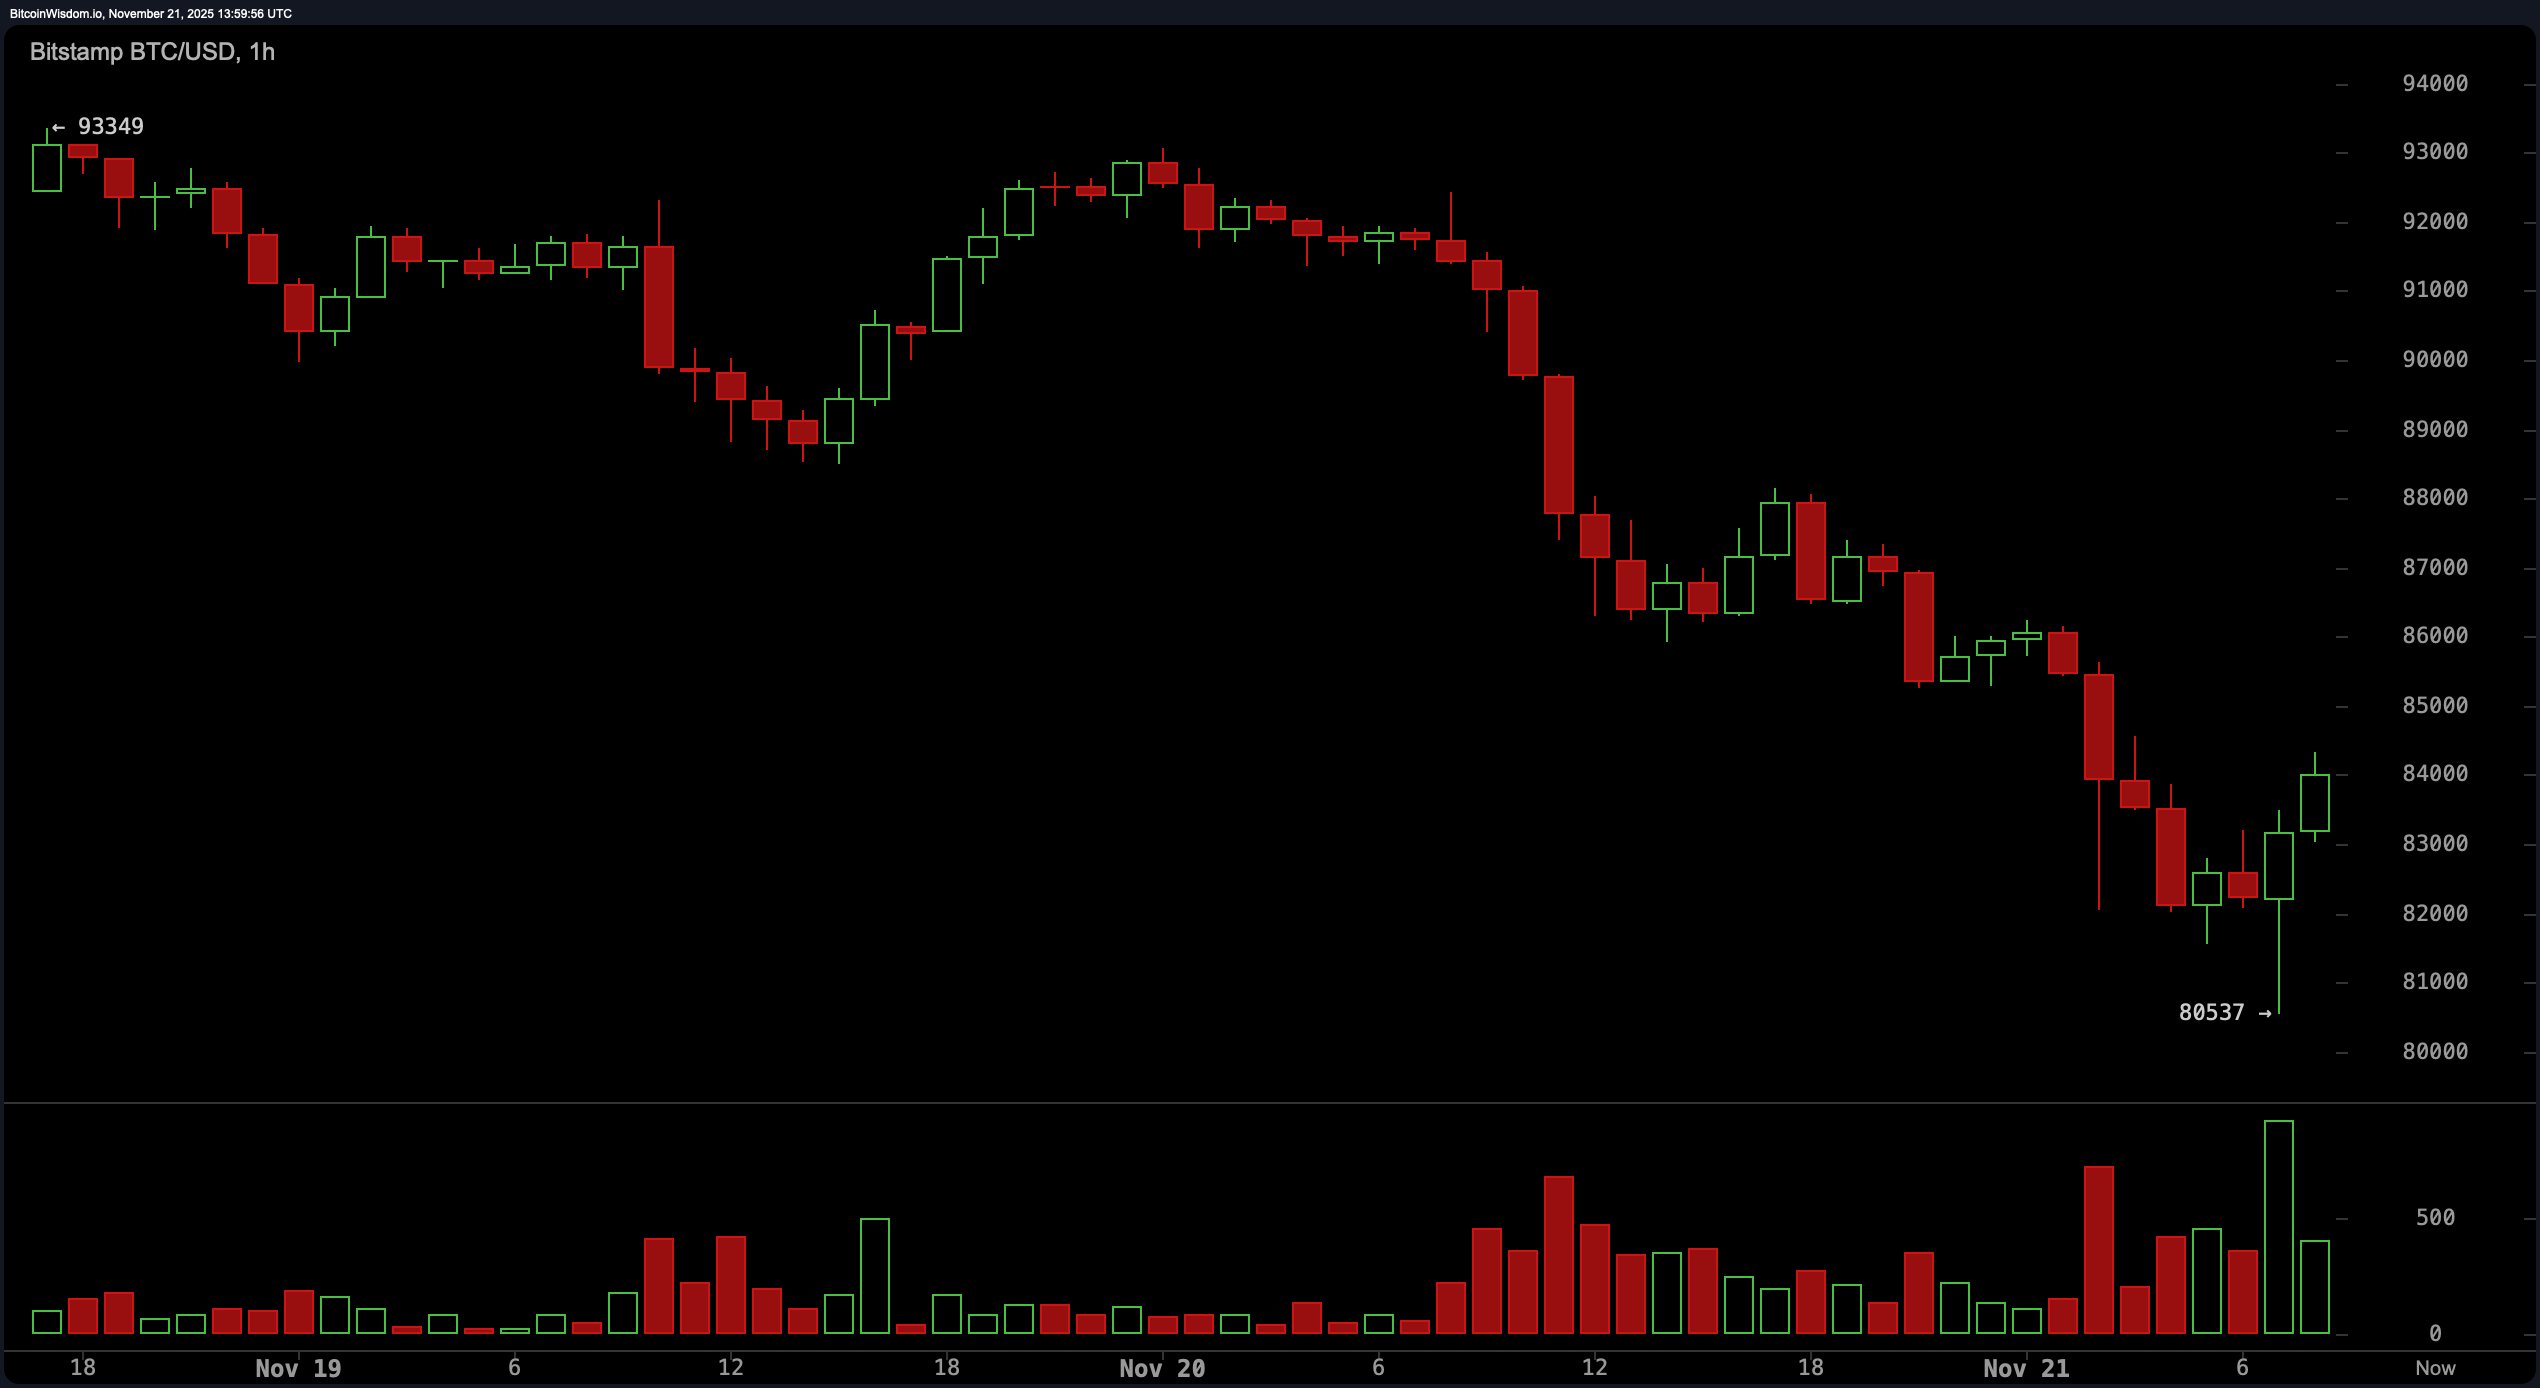
The 1-hour chart, however, is where bitcoin starts to show some swagger. A microtrend reversal is gaining traction, marked by green candles and a noticeable uptick in volume. A clean bounce off $80,537 reinforces the legitimacy of this potential pivot. Should price confidently breach $84,000, eyes will quickly shift toward targets between $87,000 and $88,000. While still early to crown a trend change, the bullish engulfing pattern forming is at least making skeptics raise an eyebrow—and maybe even an alert.

BTC/USD 1-hour chart via Bitstamp on Nov. 21, 2025.
Looking at the technical indicators, oscillators are giving mixed signals with a dash of cryptic charm. The relative strength index (RSI) is languishing at 23, signaling a market that’s oversold but not quite ready to commit to optimism.
Read more: Why the Crypto Market Is Crashing: The Theories Fueling Today’s Fear
The Stochastic oscillator reads 11, and the commodity channel index (CCI) sits at −174—both echoing neutral vibes. Meanwhile, the momentum oscillator is throwing a curveball with a signal pointing toward upward motion, while the MACD (moving average convergence divergence) remains firmly planted in sell territory at −5,669. One could say it’s a classic case of technical schizophrenia.
Moving averages, bless their consistent lag, are broadcasting a united front of pessimism. Every single one—from the 10-period exponential moving average (EMA) at $92,537 to the 200-period simple moving average (SMA) at $110,319—is trailing above the current price, making it clear that the trend is still tilted downward. It’s like bitcoin is trying to climb a staircase that keeps adding steps. Until it breaks above these averages—particularly the cluster around the $95,000 level—it’s going to be a tough slog for long-term momentum to flip.
Bull Verdict:
For the brave optimists, the micro-bullish signals on the 1-hour chart—rising volume, a potential bullish engulfing pattern, and divergence on the 4-hour timeframe—are whispering, “Not dead yet.” If bitcoin pushes past the $84,000 level with conviction and closes in on $88,000, short-term upside may spark a broader reversal attempt. But bulls, mind your stop losses—this party’s guest list is still pending confirmation from the daily chart.
Bear Verdict:
Macro bears are still in the driver’s seat, and they’re not letting go without a fight. Every major moving average is towering above price like a ceiling of rejection, and the momentum indicators aren’t rolling out any welcome mats. Unless bitcoin secures a daily close above $95,000, this bounce could be just that—a dead cat in designer fur.
- What is bitcoin’s current trading range? Bitcoin is fluctuating between $81,050 and $91,765 in the last 24 hours.
- Are technical indicators pointing to a trend reversal? The 1-hour chart suggests a potential short-term bounce, but the daily trend remains bearish.
- What key resistance level should traders monitor? The $92,000 to $95,000 zone is the critical resistance cap highlighted on multiple timeframes.
- How are moving averages influencing the outlook? All major moving averages from 10 to 200 periods are above price, reinforcing downward pressure.
免责声明:本文章仅代表作者个人观点,不代表本平台的立场和观点。本文章仅供信息分享,不构成对任何人的任何投资建议。用户与作者之间的任何争议,与本平台无关。如网页中刊载的文章或图片涉及侵权,请提供相关的权利证明和身份证明发送邮件到support@aicoin.com,本平台相关工作人员将会进行核查。


